Explore Open Rooms

1 Contact details
2 What type of senior care service are you looking for?
3 What budget do you have in mind for senior care?
4 How soon do you need to find care?
5 Additional details

Thank you for your interest!

Our team will be in touch shortly to help with next steps.

Assisted Living Home

Millcroft Living

Assisted Living Home

Millcroft Living

255 Possum Park Rd, Newark, DE 19711 View map
Overview of Millcroft Living

Nestled in a charming neighborhood in New York, Millcroft Living is a haven that combines the best of independent living with the warmth and compassion of supportive care. At Millcroft Living, they take their skilled nursing services seriously, providing post-surgical care, oxygen therapy, catheter care, and more. They offer inpatient therapies such as memory enhancement, comprehensive physical and occupational therapy, speech therapy, and pain management.

This lovely community is surrounded by convenient establishments for shopping, dining, and entertainment, as well as public parks and pools, and the stunning beaches of Delaware. Plus, pets are welcome too. Gone are the days of worrying about household chores and maintenance. Residents can now fully immerse themselves in the many amenities and activities that Millcroft Living offers. Choose from cozy alcove or studio units, complete with wall-to-wall carpeting, individual temperature control, and safe step-in showers with built-in seats and safety bars. The dining experience is also top-notch with delicious restaurant-style meals.

(302) 366-0160

Quality ratings

Measured by Centers for Medicare & Medicaid Services (CMS)

Overall rating Info The Overall CMS Rating combines results from health inspections, staffing levels and quality measures. Health inspections carry the most weight. Staffing and quality scores can increase or decrease the final rating based on performance compared to state and national standards.
5/5
Delaware average: 3.3/5
Health Inspection Info Based on the results of the facility's three most recent standard inspections and any complaint investigations. CMS reviews the number, scope, and severity of deficiencies, with more recent findings weighted more heavily.
3/5
Delaware average: 2.7/5
Staffing Info Measures average nursing staff hours per resident per day, including Registered Nurses (RNs) and total nursing staff. Ratings are adjusted based on the level of care residents require and are compared to state and national benchmarks.
5/5
Delaware average: 4.0/5
Quality Measures Info Based on clinical and physical health indicators reported to CMS, such as hospital readmissions, falls, pressure ulcers, and improvements in mobility. These measures reflect how well residents' health needs are being managed.
5/5
Delaware average: 4.2/5

Nursing care per resident

Info This shows how many total hours of nursing staff time are available per resident each day. Higher numbers usually mean more staff support.
5h 6m per day

This home provides 8% more nursing time per resident than the Delaware average.

Delaware average: 4h 43m per day

Capacity and availability

Smaller home

May offer a more intimate, personalized care environment.

Total beds 28

This home usually has availability

Lower occupancy suggests more openings may be available.

Lower demand than the Delaware average
Occupancy rate 72.1%
Residents per day (avg) 88
Occupancy rate
72.1%
Residents per day (avg)
88

Who this home usually serves

TYPE OF STAY

Mostly short-term rehab stays

Most residents typically stay for a few weeks or months before returning home or moving on.

Might be optimal for
Short stays Recovery Medicare-covered care

Breakdown by payment type

Medicare

54% of new residents, usually for short-term rehab.

Typical stay 24 days

Private pay

45% of new residents, often for short stays.

Typical stay 6 - 7 months

Medicaid

1% of new residents, often for long-term daily care.

Typical stay 10 years

Finances and operations

Privately-owned community
Operated by a business corporation.
Home revenue
$17.5M
Operating loss
-$3.1M
Privately-owned community Operated by a business corporation.
Home revenue
$17,476,411.00
Operating loss
$-3,091,592.00
Payroll costs Info The portion of the home's budget spent on staff, including nurses, caregivers, and other employees who support care and operations.
$7.8M
44.6% of revenue
Other operating costs Info All remaining costs needed to run the home, such as food, utilities, building maintenance, supplies and administrative expenses.
$12.8M
Total costs $20.6M
Bed community size
28-bed community
A moderately sized community that may balance personal attention with shared amenities and social activities.
Years in operation
1 year in operation
A newer community that may feature more recent facilities and programs.
Walk Score
Walk Score: 35 / 100
Somewhat walkable. A few nearby services may be reachable on foot, but most trips require transportation.

About this community

Occupancy

Occupancy rate
72%
In line with Delaware average
Occupied beds
20 / 28
Average residents 86 per day

License details

Facility type
Assisted Living
Status Active
Issuance January 7, 2025
Expiration June 30, 2026

Additional licensing details

License number: 1099

Ownership & operating entity

Millcroft Living is administrated by Ed Burleigh - Interim Admin.

Staffing

Key information about the people who lead and staff this community.

Leadership

Director of Nursing: Christina Hushen - Interim
Director of Nursing email: [email protected]
Administrator email: [email protected]

Health Inspection History

Inspections
Total health inspections 6

Delaware average 4.4


Last Health inspection on Oct 2025
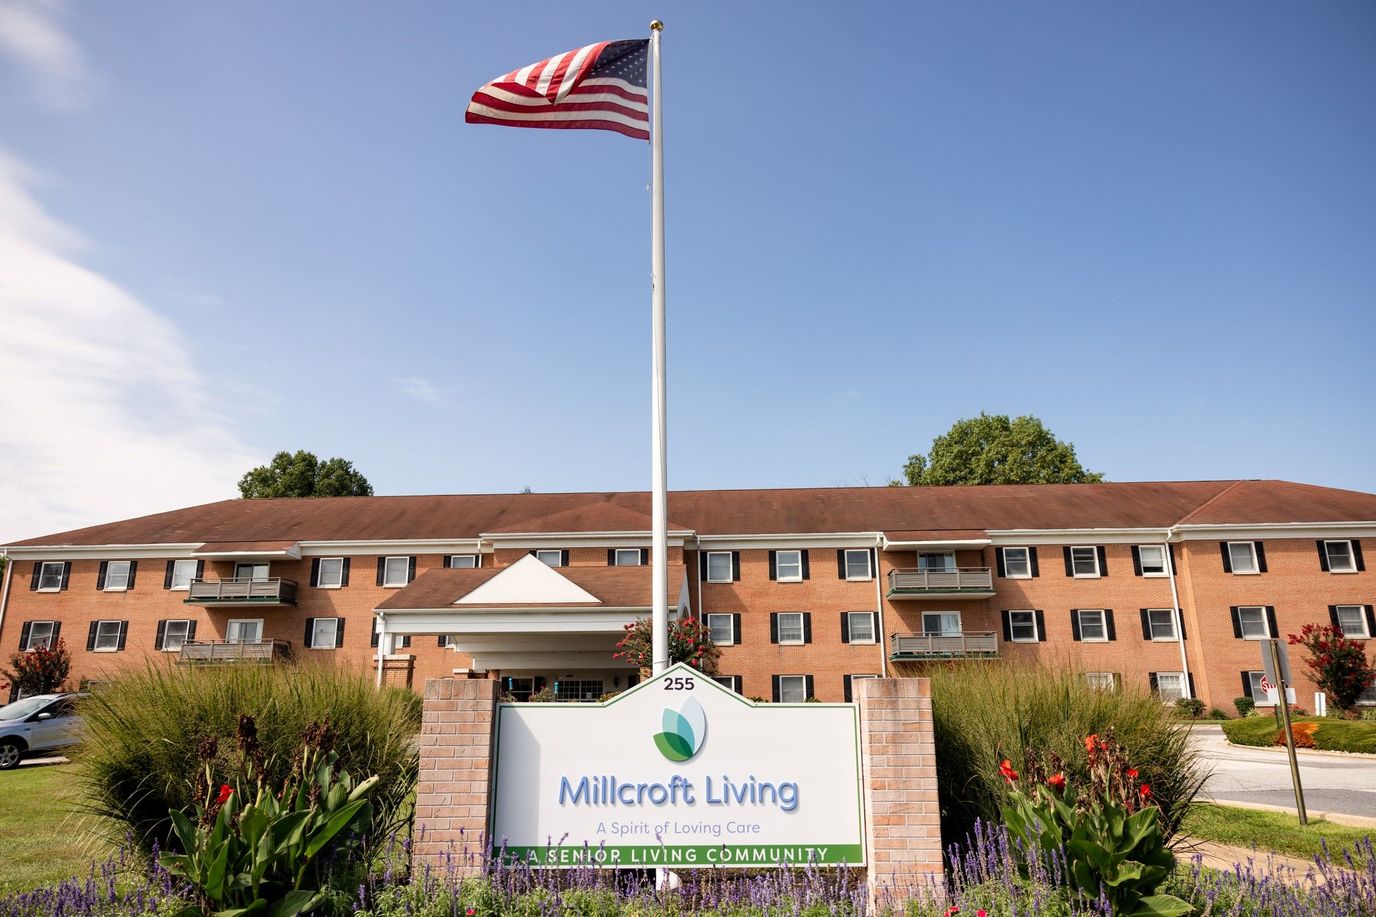
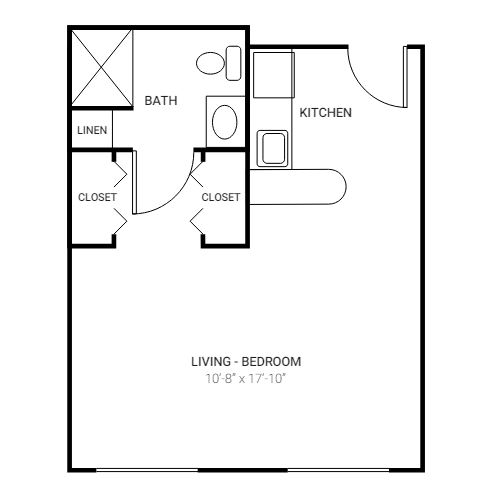
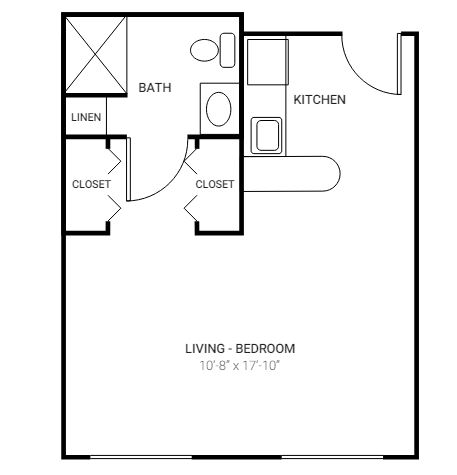
Total health citations 39

Delaware average 38.9

Citations per inspection
6.5

Delaware average 8.72


Health citations are formal notices following inspections when they fail to comply with safety and care standards.

21 of 39 citations resulted from standard inspections; 10 of 39 resulted from complaint investigations; and 8 of 39 came from combined inspections (standard and complaint).

Breakdown of citation severity (last 3 years)
Critical Health citations More info 1
11% worse than Delaware average

Delaware average: 0.9


Serious Health citations More info 1
17% better than Delaware average

Delaware average: 1.2

1 critical citation More info Delaware average: 0.9

1 serious citation More info Delaware average: 1.2

36 moderate citations More info Delaware average: 35.7

1 minor citation More info Delaware average: 1
Citations history (last 3 years)
Pharmacy moderate citation Info Issues related to medication management, including how drugs are stored, administered, and monitored. Oct 29, 2025
Corrected

Pharmacy serious citation Info Issues related to medication management, including how drugs are stored, administered, and monitored. Oct 29, 2025
Corrected

Care Planning moderate citation Info Issues related to creating and updating personalized care plans for residents based on their needs and conditions. Oct 29, 2025
Corrected

Nutrition moderate citation Info Issues related to food quality, meal service, and resident's nutritional needs. Nov 26, 2024
Corrected

Compare Assisted Living around Newark The information below is reported by the Delaware Department of Health and Social Services, Division of Health Care Quality.

Millcroft Living
AL

Assisted Living A licensed, long-term care setting for seniors or individuals with disabilities who need help with daily activities — like bathing, dressing, and medication management — but not 24-hour skilled nursing. Offers housing, meals, and around-the-clock support while aiming to maximize resident independence.

IL

Independent Living Lifestyle-focused communities for older adults offering dining, activities, and transportation with minimal personal care. Best for active, independent seniors who want community without medical support.

NH

Nursing Home Licensed facility providing 24/7 skilled nursing care for residents with complex, ongoing medical needs. Staffed by RNs, LPNs, and CNAs. Inspected and star-rated annually by CMS. Accepts Medicare (short-term rehab) and Medicaid (long-term care).

Newark
136
No
-
35
Studio / Alcove
The Vero in Newark
AL

Assisted Living A licensed, long-term care setting for seniors or individuals with disabilities who need help with daily activities — like bathing, dressing, and medication management — but not 24-hour skilled nursing. Offers housing, meals, and around-the-clock support while aiming to maximize resident independence.

Newark
136
Yes
-
57
Studio / 1 Bed / 2 Bed
Paramount Senior Living at Newark
AL

Assisted Living A licensed, long-term care setting for seniors or individuals with disabilities who need help with daily activities — like bathing, dressing, and medication management — but not 24-hour skilled nursing. Offers housing, meals, and around-the-clock support while aiming to maximize resident independence.

HC

Home Care Professional care delivered in the person's own home — from companionship and errands to skilled nursing and therapy. Allows seniors to age in place. Medicare covers skilled home health when medically necessary.

HC

Home Care Professional care delivered in the person's own home — from companionship and errands to skilled nursing and therapy. Allows seniors to age in place. Medicare covers skilled home health when medically necessary.

IL

Independent Living Lifestyle-focused communities for older adults offering dining, activities, and transportation with minimal personal care. Best for active, independent seniors who want community without medical support.

Newark
132
Yes
A+
16
-
Churchman Village
AL

Assisted Living A licensed, long-term care setting for seniors or individuals with disabilities who need help with daily activities — like bathing, dressing, and medication management — but not 24-hour skilled nursing. Offers housing, meals, and around-the-clock support while aiming to maximize resident independence.

NH

Nursing Home Licensed facility providing 24/7 skilled nursing care for residents with complex, ongoing medical needs. Staffed by RNs, LPNs, and CNAs. Inspected and star-rated annually by CMS. Accepts Medicare (short-term rehab) and Medicaid (long-term care).

Newark
101
Yes
-
37
-
Mosaic of Delaware
IL

Independent Living Lifestyle-focused communities for older adults offering dining, activities, and transportation with minimal personal care. Best for active, independent seniors who want community without medical support.

Newark
-
No
-
51
-

Living Spaces & Floor Plans

Millcroft Living Studio
Millcroft Living Alcove

Places of interest near Millcroft Living

Address 3.6 miles from city center — 4.47 miles to nearest hospital (Exceptional Care for Children)

Address 255 Possum Park Rd, Newark, DE 19711

Calculate Travel Distance to Millcroft Living

Add your location

Address

Staffing Data (Q2 2025)

This data corresponds to Q2 2025 and is based on CMS Payroll-Based Journal.

Total staff 160
Employees 121
Contractors 39
Staff to resident ratio 1.76:1
9% better than Delaware average

Delaware average ratio: 1.61:1

Avg staff/day 67
Average shift 7.8 hours
0% compared with Delaware average

Delaware average: 7.6 hours

Total staff hours (quarter) 47,462
Nursing staff breakdown
Registered Nurse

Manages medical care and health needs.

Total count 17
Average shift length Info Average shift length. Calculated as total hours divided by days worked and average staff per day. 7.9 hours

This role is partially covered by contractors.

Licensed Practical Nurse

Assists with medical care and medications.

Total count 24
Average shift length Info Average shift length. Calculated as total hours divided by days worked and average staff per day. 8.6 hours

This role is partially covered by contractors.

Certified Nursing Assistant

Helps with daily care and mobility.

Total count 69
Average shift length Info Average shift length. Calculated as total hours divided by days worked and average staff per day. 8.1 hours

This role is partially covered by contractors.

Contractor staffing

Total hours from contractors

8.7%

4,108 contractor hours this quarter

Physical Therapy Aide: 11 Speech Language Pathologist: 8 Respiratory Therapy Technician: 7 Physical Therapy Assistant: 5 Certified Nursing Assistant: 4 Registered Nurse: 2 Licensed Practical Nurse: 1 Qualified Social Worker: 1
Staff by category
Certified Nursing Assistant 65 4 69 22,786 91 100% 8.1
Licensed Practical Nurse 23 1 24 9,837 91 100% 8.6
Registered Nurse 15 2 17 4,735 91 100% 7.9
Clinical Nurse Specialist 5 0 5 2,250 78 86% 8.5
Other Dietary Services Staff 7 0 7 1,487 87 96% 7.4
Speech Language Pathologist 0 8 8 1,077 79 87% 6
Nurse Practitioner 2 0 2 878 65 71% 7.5
Physical Therapy Assistant 0 5 5 828 78 86% 6.3
Respiratory Therapy Technician 0 7 7 745 82 90% 4.7
Physical Therapy Aide 0 11 11 679 79 87% 4.5
Dietitian 1 0 1 480 64 70% 7.5
Occupational Therapy Aide 1 0 1 436 59 65% 7.4
Dental Services Staff 1 0 1 428 57 63% 7.5
Administrator 1 0 1 424 53 58% 8
Qualified Social Worker 0 1 1 394 62 68% 6.3
69 Certified Nursing Assistant
% of Days 100%
24 Licensed Practical Nurse
% of Days 100%
17 Registered Nurse
% of Days 100%
5 Clinical Nurse Specialist
% of Days 86%
7 Other Dietary Services Staff
% of Days 96%
8 Speech Language Pathologist
% of Days 87%
2 Nurse Practitioner
% of Days 71%
5 Physical Therapy Assistant
% of Days 86%
7 Respiratory Therapy Technician
% of Days 90%
11 Physical Therapy Aide
% of Days 87%
1 Dietitian
% of Days 70%
1 Occupational Therapy Aide
% of Days 65%
1 Dental Services Staff
% of Days 63%
1 Administrator
% of Days 58%
1 Qualified Social Worker
% of Days 68%

Facility Characteristics

Source: CMS Long-Term Care Facility Characteristics (Data as of Jan 2026)

Total census
91 residents
Residents by payment source
Medicare
22 residents (24.2%)
Medicaid
30 residents (33%)
Private pay or other
39 residents (42.9%)
Programs & Services
Residents' Group

Residents meet regularly to discuss policies, care quality, and activities

CCRC

Part of a Continuing Care Retirement Community offering multiple care levels

Active Resident Council

Organized group of residents that meets regularly to discuss facility policies, quality of life, and activities.

Quality of care over time

These measures show how residents usually do over time at this home, based on health outcomes and preventive care.

High-risk clinical events score Info A composite score based on pressure ulcers, falls with injury, weight loss, walking ability decline, and activities of daily living decline. 12.4
29% worse than Delaware average

Delaware average: 9.6

Functional decline score Info A composite score based on activities of daily living decline, walking ability decline, and incontinence. 23.9
26% worse than Delaware average

Delaware average: 19.0

Long-stay resident measures
Need for Help with Daily Activities Increased Info Percent of long-stay residents whose need for help with daily activities has increased 17.9%
16% worse than Delaware average

Delaware average: 15.4%

Walking Ability Worsened Info Percent of long-stay residents whose ability to move independently worsened 26.8%
35% worse than Delaware average

Delaware average: 19.8%

Low Risk Residents with Bowel/Bladder Incontinence Info Percent of low risk long-stay residents who lose control of their bowels or bladder 27.1%
23% worse than Delaware average

Delaware average: 22.1%

Falls with Major Injury Info Percent of long-stay residents experiencing one or more falls with major injury 2.9%
In line with Delaware average

Delaware average: 3.0%

High Risk Residents with Pressure Ulcers Info Percent of long-stay high risk residents with pressure ulcers 4.2%
5% better than Delaware average

Delaware average: 4.4%

Urinary Tract Infection Info Percent of long-stay residents with a urinary tract infection 1.3%
41% better than Delaware average

Delaware average: 2.1%

Lost Too Much Weight Info Percent of long-stay residents who lose too much weight 10.1%
76% worse than Delaware average

Delaware average: 5.8%

Depressive Symptoms Info Percent of long-stay residents who have depressive symptoms 0.0%
100% better than Delaware average

Delaware average: 6.0%

Antipsychotic Use Info Percent of long-stay residents who received an antipsychotic medication 9.9%
10% better than Delaware average

Delaware average: 11.0%

Pneumococcal Vaccine Info Percent of long-stay residents assessed and appropriately given the pneumococcal vaccine 100.0%
5% better than Delaware average

Delaware average: 95.3%

Influenza Vaccine Info Percent of long-stay residents assessed and appropriately given the seasonal influenza vaccine 100.0%
In line with Delaware average

Delaware average: 97.4%

Short-stay resident measures
Pneumococcal Vaccine Info Percent of short-stay residents assessed and appropriately given the pneumococcal vaccine 98.7%
20% better than Delaware average

Delaware average: 82.1%

Antipsychotic medication increase Info Percent of short-stay residents who newly received an antipsychotic medication 0.7%
21% better than Delaware average

Delaware average: 0.9%

Influenza Vaccine Info Percent of short-stay residents assessed and appropriately given the seasonal influenza vaccine 99.1%
19% better than Delaware average

Delaware average: 83.1%

Penalties and fines

Federal penalties imposed by CMS for regulatory violations, including civil money penalties (fines) and denials of payment for new Medicare/Medicaid admissions.

Source: CMS Penalties Database (Data as of Jan 2026)

Total fines amount $16K
83% lower than Delaware average

Delaware average: $98K

Number of fines 1
46% fewer fines than Delaware average

Delaware average: 1.9

Payment Denials Info Serious action where Medicare and/or Medicaid temporarily stops payments for new residents until issues are fixed. 0
100% fewer payment denials than Delaware average

Delaware average: 0.2

Fines amount comparison
This facility $16K
Delaware average $98K
Penalty History

Penalties are imposed by CMS for violations of federal nursing home regulations.

Civil Money Penalty Info Fines imposed for noncompliance, which can be assessed per day or per instance of violation. Aug 28, 2024
$16K

Last updated: Jan 2026

Guides for Better Senior Living

Care Cost Calculator: See Prices in Your Area

Nursing Home Data Explorer

Don’t Wait Too Long: 7 Red Flag Signs Your Parent Needs Assisted Living Now

The True Cost of Assisted Living in 2025 – And How Families Are Paying For It

Understanding Senior Living Costs: Pricing Models, Discounts & Financial Assistance

Financial Aid for Delaware Seniors

Get financial aid guidance

Elderly and Disabled Waiver

Delaware Medicaid E&D Waiver

Age 65+ or disabled, Delaware resident, Medicaid- eligible, nursing home-level care need.

~$2,829/month (300% FBR, individual).

$2,000 (individual), $3,000 (couple).

Small state, faster processing in some areas.

Delaware Caregiver Support Program

DE Caregiver Support (NFCSP)

Caregiver of someone 60+, Delaware resident.

No strict limit; prioritizes low-income.

Not applicable.

Limited slots; rural focus.

Program of All-Inclusive Care for the Elderly (PACE)

Delaware Medicaid PACE

Age 55+, Delaware resident, nursing home-level care need, safe with PACE support.

~$2,829/month (300% FBR).

$2,000 (individual), $3,000 (couple).

Limited to specific areas (e.g., New Castle County); few providers.

Medicare Savings Program (MSP)

Delaware Medicare Savings Program

Age 65+ or disabled, Delaware resident, enrolled in Medicare Part A/B.

~$2,510/month (QMB), ~$3,380/month (SLMB), ~$3,598/month (QI)—individual, adjusted annually.

$9,430 (individual), $14,130 (couple).

Three tiers; broader limits than some states.

Senior Community Service Employment Program (SCSEP)

Delaware SCSEP (federally funded, state-administered)

Age 55+, unemployed, low-income, Delaware resident.

~$1,983/month (125% FPL, individual).

Not specified; income-focused.

Priority for veterans, rural residents; ~400 slots/year.

Tour Icon
Planning a tour? Check our touring checklist.
Chat Icon
Thinking of living here? We can help you speak to a current resident