Minot Health & Rehab
Nursing Home, Assisted Living, Home Care & Hospice Care · Minot, ND
CMS overall rating Info CMS (the Centers for Medicare & Medicaid Services) is the federal agency that rates nursing home quality. Its Overall Rating runs from 1 to 5 stars, combining health inspections, staffing, and quality measures, with inspections weighted most heavily.

Minot Health & Rehab

Nursing Home, Assisted Living, Home Care & Hospice Care · Minot, ND
CMS overall rating Info CMS (the Centers for Medicare & Medicaid Services) is the federal agency that rates nursing home quality. Its Overall Rating runs from 1 to 5 stars, combining health inspections, staffing, and quality measures, with inspections weighted most heavily.
Calculator: See prices in your area
Minot Health & Rehab accepts Medicare, Medicaid, and private pay.

Overview of Minot Health & Rehab

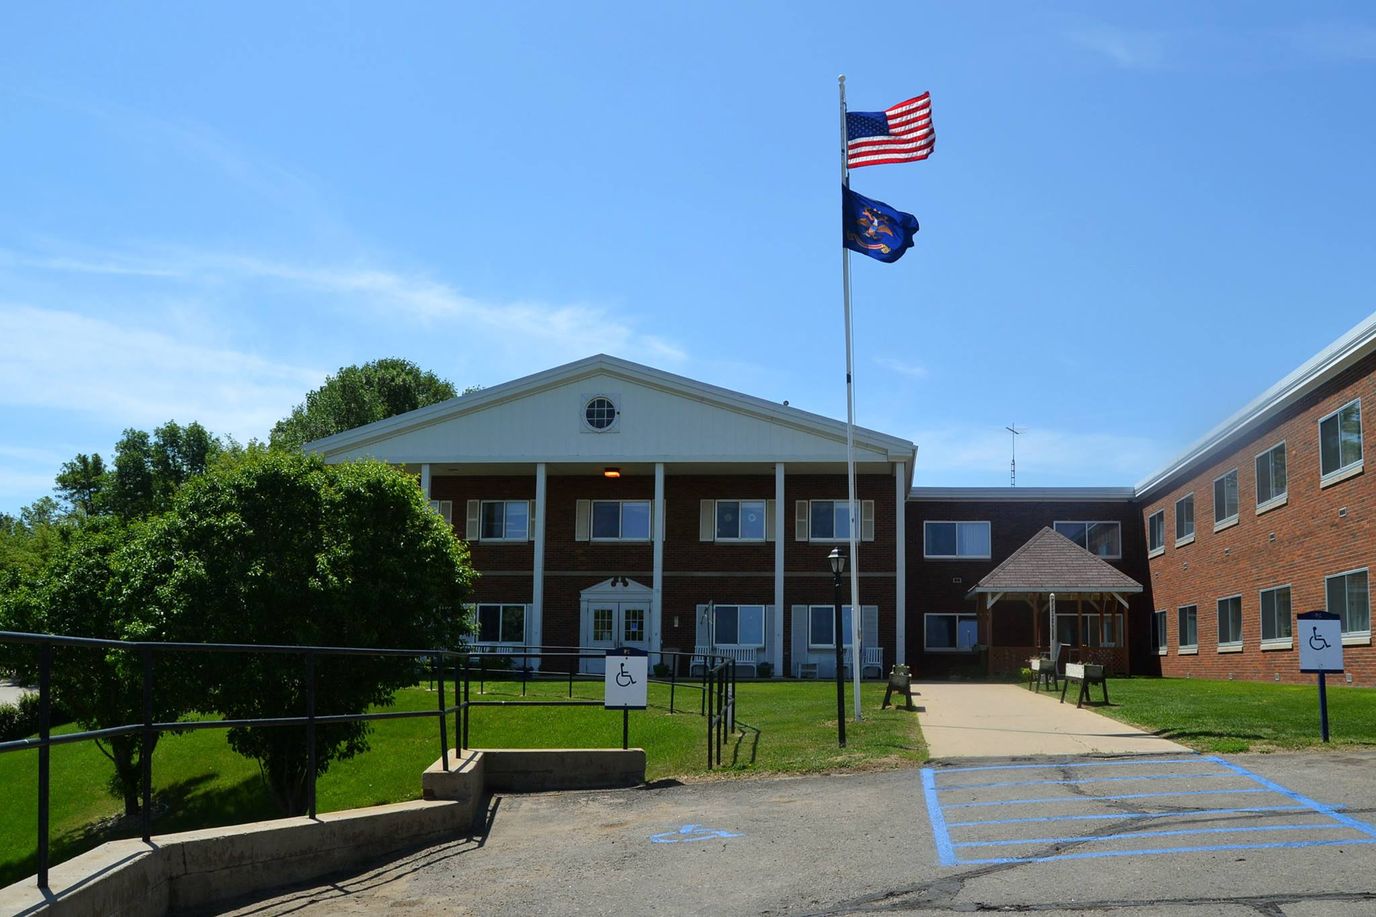
Since its establishment in 2015, Minot Health & Rehab has been recognized for its exceptional long-term nursing care and short-term rehabilitation services in Minot, North Dakota. The facility’s unwavering dedication to excellence is evident in its commitment to maintaining high nursing home qualifications, ensuring that residents receive the best possible care.

Its comprehensive range of nursing home services encompasses both short-term care for those recovering from hospital stays or surgeries, and long-term care for individuals requiring ongoing support. The facility’s expertise extends to services such as wound care, respiratory therapy, and occupational therapy. In addition to these essential services, Minot Health & Rehab offers a range of nursing home facilities that cater to residents’ diverse needs, including IV antibiotics, tracheostomy management, PICC management, IV medications, and full pharmacy services. The facility’s holistic approach, including comprehensive discharge planning, showcases its commitment to providing exceptional care at every stage.

Quality ratings

Measured by Centers for Medicare & Medicaid Services (CMS)

Overall rating Info The Overall CMS Rating combines results from health inspections, staffing levels and quality measures. Health inspections carry the most weight. Staffing and quality scores can increase or decrease the final rating based on performance compared to state and national standards.
▼ 35.7% Below ND avg. ▼ 35.7% Below ND avg.ND average: 3.1Click the badge to see the full State ranking.Click here to see the full State ranking.
Health Inspection Info Based on the results of the facility's three most recent standard inspections and any complaint investigations. CMS reviews the number, scope, and severity of deficiencies, with more recent findings weighted more heavily.
▼ 29.1% Below ND avg. ▼ 29.1% Below ND avg.ND average: 2.8Click the badge to see the full State ranking.Click here to see the full State ranking.
Staffing Info Measures average nursing staff hours per resident per day, including Registered Nurses (RNs) and total nursing staff. Ratings are adjusted based on the level of care residents require and are compared to state and national benchmarks.
▼ 30.8% Below ND avg. ▼ 30.8% Below ND avg.ND average: 4.3Click the badge to see the full State ranking.Click here to see the full State ranking.
Quality Measures Info Based on clinical and physical health indicators reported to CMS, such as hospital readmissions, falls, pressure ulcers, and improvements in mobility. These measures reflect how well residents' health needs are being managed.
▼ 25.8% Below ND avg. ▼ 25.8% Below ND avg.ND average: 2.7Click the badge to see the full State ranking.Click here to see the full State ranking.

Staffing hours breakdown

Info Daily nursing hours per resident by staff type, reported to CMS. Higher is generally better — compare this facility to state and national averages to see where staffing stands.

Hours per resident per day — compared to North Dakota state averages

Total nursing care / resident Info This home is ranked 23rd out of 26 homes in North Dakota for nurse hours. Total adjusted nursing hours per resident per day, combining RN, LPN, and aide time. CMS adjusts this for case-mix so facilities can be fairly compared.
3h 58m per day
Rank #23 / 26Nurse hours — State benchmarkedThis home is ranked 23rd out of 26 homes in North Dakota. Shows adjusted nurse hours per resident per day benchmarked to the North Dakota average, with a ranking across 26 North Dakota facilities. More hours mean more direct care. The national average is about 3.5 hrs; below 3.0 is a red flag.Rankings are based only on facilities in North Dakota that report data for that category. Facilities without available data are excluded from the ranking.Click the rank badge to see the full State ranking.Click here to see the full State ranking.
This facility North Dakota avg (5h 10m per day)
vs North Dakota avg
-23%

2 of 6 metrics below state avg

Standout metric Physical Therapist is +343% above state avg
Staff typeHours / Day / Residentvs state avg
Registered Nurse (RN) Info RNs hold the highest nursing license and can assess residents, interpret test results, and direct care plans. More RN hours per day often signals stronger clinical oversight and faster response to health changes. 1h 4m per day ▲ 17% State avg: 55m per day · National avg: 41m per day
LPN / LVN Info Licensed Practical Nurses (LPNs) or Licensed Vocational Nurses (LVNs) deliver routine hands-on care — medication administration, wound dressing, and monitoring vital signs. They work under RN supervision and make up a large share of daily bedside care. 53m per day ▲ 76% State avg: 30m per day · National avg: 52m per day
Nurse Aide Info Certified Nurse Aides (CNAs) provide the most direct day-to-day assistance: bathing, dressing, feeding, and mobility. Nurse aide hours are typically the largest staffing category and directly affect residents' quality of life. 2h 6m per day ▼ 30% State avg: 3h 0m per day · National avg: 2h 21m per day
Weekend Total Nursing Info Combined nursing hours (RN + LPN + Nurse Aide) per resident per day on weekends. Staffing often drops on weekends — this figure reveals whether the facility maintains adequate coverage outside of weekday hours. 3h 39m per day ▼ 3% State avg: 3h 46m per day · National avg: 3h 26m per day
Physical Therapist Info Hours per resident per day provided by licensed Physical Therapists (PTs) or PT Assistants. PT services help residents recover mobility after injury or illness and are especially important for post-acute (short-stay) rehabilitation. 9m per day ▲ 343% State avg: 2m per day · National avg: 4m per day
Weekend RN Info Registered nurse hours specifically on weekends. Facilities sometimes reduce RN presence on Saturdays and Sundays — a low weekend RN figure compared to weekday hours can indicate reduced clinical oversight when most administrative staff are absent. 51m per day ▲ 45% State avg: 35m per day · National avg: 29m per day

Capacity and availability

This home usually has availability

Lower occupancy than the North Dakota average: 87.8%
Occupancy rate
46.9% Rank #21 / 24Occupancy rate — State benchmarkedThis home is ranked 21st out of 24 homes in North Dakota. Shows this facility's occupancy rate versus the North Dakota average, with its Statewide rank out of 24. Higher occupancy signals strong local demand and financial stability.Rankings are based only on facilities in North Dakota that report data for that category. Facilities without available data are excluded from the ranking.Click the rank badge to see the full State ranking.Click here to see the full State ranking.
Avg. Length of Stay
82 days
Bed community size
108-bed community Rank #11 / 53Bed count — State benchmarkedThis home is ranked 11th out of 53 homes in North Dakota. Shows this facility's certified or reported bed count compared to other North Dakota facilities. Larger communities may offer more amenities, programs, and on-site services for residents and families.Rankings are based only on facilities in North Dakota that report data for that category. Facilities without available data are excluded from the ranking.Click the rank badge to see the full State ranking.Click here to see the full State ranking.
A larger shared setting that may offer more common spaces and organized community services.
Walk Score
Walk Score: 77 / 100 Rank #8 / 80Walk Score — State benchmarkedThis home is ranked 8th out of 80 homes in North Dakota. Shows how walkable this facility's neighborhood is compared to the average Walk Score across North Dakota facilities. Higher scores benefit residents, families, and staff.Rankings are based only on facilities in North Dakota that report data for that category. Facilities without available data are excluded from the ranking.Click the rank badge to see the full State ranking.Click here to see the full State ranking.
Very walkable. Most errands can be accomplished on foot, and many essentials are within a short walk.

Therapy & Rehabilitation

1 service
Rehabilitation Services

Staffing & Medical

1 service
Licensed Nurses/CNAs

Amenities & Lifestyle

Specific ProgramsHome Health and Hospice, Brain Injury Rehabilitation

Contact Minot Health & Rehab

Staffing Data

Reporting period: October 1 – December 31, 2025 (Q4 2025). Source: CMS Payroll-Based Journal report.

Total staff 68
Employees 68
Contractors 0
Staff to resident ratio 2.34 : 1
22% more staff per resident than North Dakota average
North Dakota average ratio: 1.92 : 1 North Dakota average ratio: 1.92 : 1See full North Dakota ranking
Avg staff/day 19
Average shift 7.1 hours
10% worse than North Dakota average
North Dakota average: 7.9 hours North Dakota average shift: 7.9 hoursSee full North Dakota ranking
Total staff hours (quarter) 12,474

Nursing staff breakdown

Q4 2025 · Oct 1 – Dec 31 More info This data comes from the CMS Payroll-Based Journal report covering October 1 – December 31, 2025.
Registered Nurse

Manages medical care and health needs.

RN Staff Info All 8 RN Staff are full-time employees. No contractors work on this role. 8
Average shift length Info Average shift length. Calculated as total hours divided by days worked and average staff per day. 8.1 hours
Licensed Practical Nurse

Assists with medical care and medications.

LPN Staff Info All 12 LPN Staff are full-time employees. No contractors work on this role. 12
Average shift length Info Average shift length. Calculated as total hours divided by days worked and average staff per day. 7.9 hours
Certified Nursing Assistant

Helps with daily care and mobility.

CNA Staff Info All 26 CNA Staff are full-time employees. No contractors work on this role. 26
Average shift length Info Average shift length. Calculated as total hours divided by days worked and average staff per day. 7 hours

Contractor staffing

Q4 2025 · Oct 1 – Dec 31 More info This data comes from the CMS Payroll-Based Journal report covering October 1 – December 31, 2025.
Total hours from contractors 0% — all staff are direct employees this quarter

Staff by category

Q4 2025 · Oct 1 – Dec 31 More info This data comes from the CMS Payroll-Based Journal report covering October 1 – December 31, 2025.
Certified Nursing Assistant260265,05492100%7
Licensed Practical Nurse120122,2179199%7.9
Clinical Nurse Specialist3031,2707885%8
Registered Nurse8081,0657177%8.1
Mental Health Service Worker1014796166%7.9
Administrator1014085155%8
Dietitian2023755560%6.7
Respiratory Therapy Technician2023726065%5.5
Nurse Practitioner1013684650%8
Other Dietary Services Staff2022815054%5.6
Medication Aide/Technician2022492729%7.8
Physical Therapy Aide2021523740%4.1
Therapeutic Recreation Specialist202671516%4.1
Respiratory Therapist1014689%5.8
Physical Therapy Assistant202372325%1.6
Speech Language Pathologist101351921%1.8
26 Certified Nursing Assistant
% of Days 100%
12 Licensed Practical Nurse
% of Days 99%
3 Clinical Nurse Specialist
% of Days 85%
8 Registered Nurse
% of Days 77%
1 Mental Health Service Worker
% of Days 66%
1 Administrator
% of Days 55%
2 Dietitian
% of Days 60%
2 Respiratory Therapy Technician
% of Days 65%
1 Nurse Practitioner
% of Days 50%
2 Other Dietary Services Staff
% of Days 54%
2 Medication Aide/Technician
% of Days 29%
2 Physical Therapy Aide
% of Days 40%
2 Therapeutic Recreation Specialist
% of Days 16%
1 Respiratory Therapist
% of Days 9%
2 Physical Therapy Assistant
% of Days 25%
1 Speech Language Pathologist
% of Days 21%

Penalties and fines

Includes penalties issued in 2024

Federal penalties imposed by CMS for regulatory violations, including civil money penalties (fines) and denials of payment for new Medicare/Medicaid admissions.

Source: CMS Penalties Database (Data as of Jan 2026)

Total fines amount $38K Rank #19 / 26Federal fines — State benchmarkedThis home is ranked 19th out of 26 homes in North Dakota. Shows this facility's cumulative CMS federal fine dollars versus the North Dakota average among facilities with fines, and where it ranks among 26 facilities in the pool. Lower total dollars mean a better rank.Rankings are based only on facilities in North Dakota that report data for that category. Facilities without available data are excluded from the ranking.Click the rank badge to see the full State ranking.Click here to see the full State ranking.
In line with North Dakota average

North Dakota average: $39K

Number of fines 2
30% more fines than North Dakota average

North Dakota average: 1.5

Payment Denials Info Serious action where Medicare and/or Medicaid temporarily stops payments for new residents until issues are fixed. 0
100% fewer payment denials than North Dakota average

North Dakota average: 0.0

Fines amount comparison
This facility $38K
North Dakota average $39K
Penalty History

Penalties are imposed by CMS for violations of federal nursing home regulations.

2 penalties in the past 3 years

Multiple penalties were reported in the last 3 years.

Civil Money Penalty Info Fines imposed for noncompliance, which can be assessed per day or per instance of violation. Dec 31, 2024
$26K
Civil Money Penalty Info Fines imposed for noncompliance, which can be assessed per day or per instance of violation. May 16, 2024
$13K

Last updated: Jan 2026

Quality of care over time

These measures show how residents usually do over time at this home, based on health outcomes and preventive care.

High-risk clinical events score Info A composite score based on pressure ulcers, falls with injury, weight loss, walking ability decline, and activities of daily living decline. 9.2
20% better than North Dakota average

North Dakota average: 11.4

Functional decline score Info A composite score based on activities of daily living decline, walking ability decline, and incontinence. 27.0
23% worse than North Dakota average

North Dakota average: 22.0

Long-stay resident measures
Below average North Dakota avg: 3.0 Info CMS star rating based on long-stay quality measure performance. 5 stars = significantly above average, 1 star = significantly below average.
Need for Help with Daily Activities Increased Info Percent of long-stay residents whose need for help with daily activities has increased 27.9%
37% worse than North Dakota average

North Dakota average: 20.4%

Low Risk Residents with Bowel/Bladder Incontinence Info Percent of low risk long-stay residents who lose control of their bowels or bladder 26.1%
In line with North Dakota average

North Dakota average: 25.0%

Falls with Major Injury Info Percent of long-stay residents experiencing one or more falls with major injury 0.9%
82% better than North Dakota average

North Dakota average: 5.0%

High Risk Residents with Pressure Ulcers Info Percent of long-stay high risk residents with pressure ulcers 2.5%
56% better than North Dakota average

North Dakota average: 5.6%

Urinary Tract Infection Info Percent of long-stay residents with a urinary tract infection 2.0%
43% better than North Dakota average

North Dakota average: 3.4%

Lost Too Much Weight Info Percent of long-stay residents who lose too much weight 5.4%
6% better than North Dakota average

North Dakota average: 5.7%

Depressive Symptoms Info Percent of long-stay residents who have depressive symptoms 13.9%
213% worse than North Dakota average

North Dakota average: 4.4%

Antipsychotic Use Info Percent of long-stay residents who received an antipsychotic medication 18.8%
12% better than North Dakota average

North Dakota average: 21.4%

Pneumococcal Vaccine Info Percent of long-stay residents assessed and appropriately given the pneumococcal vaccine 98.2%
In line with North Dakota average

North Dakota average: 98.4%

Influenza Vaccine Info Percent of long-stay residents assessed and appropriately given the seasonal influenza vaccine 97.0%
In line with North Dakota average

North Dakota average: 98.8%

Hospitalizations per 1,000 days Info Number of hospitalizations per 1,000 long-stay resident days. 1.53
In line with North Dakota average

North Dakota average: 1.48

ED visits per 1,000 days Info Number of outpatient emergency department visits per 1,000 long-stay resident days. 2.06
8% worse than North Dakota average

North Dakota average: 1.90

Short-stay resident measures
Significantly below average North Dakota avg: 2.3 Info CMS star rating based on short-stay quality measure performance. 5 stars = much above average, 1 star = much below average.
Pneumococcal Vaccine Info Percent of short-stay residents assessed and appropriately given the pneumococcal vaccine 91.7%
In line with North Dakota average

North Dakota average: 94.4%

Antipsychotic medication increase Info Percent of short-stay residents who newly received an antipsychotic medication 1.6%
25% better than North Dakota average

North Dakota average: 2.1%

Influenza Vaccine Info Percent of short-stay residents assessed and appropriately given the seasonal influenza vaccine 90.6%
In line with North Dakota average

North Dakota average: 88.6%

Re-hospitalized after SNF stay Info Percentage of short-stay residents who were re-hospitalized after their nursing home admission. 30.8%
47% worse than North Dakota average

North Dakota average: 20.9%

Emergency department visits Info Percentage of short-stay residents who had an outpatient emergency department visit. 22.5%
112% worse than North Dakota average

North Dakota average: 10.6%

Falls with major injury Info Percentage of SNF residents who experience falls with major injury during their stay. 0.0%
100% better than North Dakota average

North Dakota average: 0.8%

Ability to care for self at discharge Info Percentage of residents at or above expected ability to care for themselves at discharge. 32.4%
40% worse than North Dakota average

North Dakota average: 53.7%

Successful return to home or community Info Rate of successful return to home or community from a skilled nursing facility. 32.7%
35% worse than North Dakota average

North Dakota average: 50.6%

Breakdown by payment type

Medicare

58% of new residents, usually for short-term rehab.

Typical stay 29 days

Private pay

20% of new residents, often for short stays.

Typical stay 3 - 4 months

Medicaid

22% of new residents, often for long-term daily care.

Typical stay 6 - 7 months

Facility Characteristics

Source: CMS Long-Term Care Facility Characteristics (Data as of Jan 2026)

Total residents 29
Medicare
4
13.8% of residents
Medicaid
19
65.5% of residents
Private pay or other
6
20.7% of residents
Programs & Services
Residents Group

Residents meet regularly to discuss policies, care quality, and activities

Active Resident Council

Organized group of residents that meets regularly to discuss facility policies, quality of life, and activities.

Finances and operations

Based on CMS SNF Cost Report for fiscal year ending in 12/2023.

For-profit
Operated by a single business entity.
Net patient revenue Info Net patient revenue — what the home actually collects for resident care, after contractual allowances, bad debt and discounts are subtracted from its gross charges (CMS cost report, Worksheet G-3). It covers resident care only; money the home earns from other sources is shown separately as "Other income."
$5.0M
Net patient income Info Net patient income: net patient revenue minus the home's total operating expenses. A positive figure means it earns more from resident care than it spends to deliver it; a negative figure means the opposite. It excludes non-operating "other income."
-$821.4K
For-profit Operated by a single business entity.
Net patient revenue Info Net patient revenue — what the home actually collects for resident care, after contractual allowances, bad debt and discounts are subtracted from its gross charges (CMS cost report, Worksheet G-3). It covers resident care only; money the home earns from other sources is shown separately as "Other income."
$5.0M Rank #22 / 23Revenue — State benchmarkedThis home is ranked 22nd out of 23 homes in North Dakota. Shows this facility's annual revenue compared to the North Dakota average. Higher revenue generally means more resources for staffing and capital — read alongside Payroll %.Rankings are based only on facilities in North Dakota that report data for that category. Facilities without available data are excluded from the ranking.Click the rank badge to see the full State ranking.Click here to see the full State ranking.
Net patient income Info Net patient income: net patient revenue minus the home's total operating expenses. A positive figure means it earns more from resident care than it spends to deliver it; a negative figure means the opposite. It excludes non-operating "other income."
-$821.4K
Other income Info Money the home earns outside of resident care — such as investments, grants, rentals and other non-operating sources (CMS cost report, Worksheet G-3). It is tracked separately from net patient revenue: it is not part of that figure, and it is not included in net patient income.
$96.0K
Payroll costs Info Staff salaries plus wage-related costs — benefits such as payroll taxes, health insurance and retirement — from the home's own accounting records (CMS cost report, Worksheet A). Contract or agency labor is counted separately, under other operating costs. Rank #23 / 23Payroll — State benchmarkedThis home is ranked 23rd out of 23 homes in North Dakota. Shows total annual staff payroll benchmarked to the North Dakota average. Higher payroll investment relative to peers often signals better staffing and less reliance on cheaper contract labor.Rankings are based only on facilities in North Dakota that report data for that category. Facilities without available data are excluded from the ranking.Click the rank badge to see the full State ranking.Click here to see the full State ranking.
$2.0M 39.1% of net patient revenue Info Payroll as a share of revenue: staff salaries and wage-related benefits divided by net patient revenue. A higher figure means more of each revenue dollar goes to staff pay. Rank #13 / 23Payroll % — State benchmarkedThis home is ranked 13th out of 23 homes in North Dakota. Shows payroll as a percentage of revenue versus the North Dakota average. Well-run North Dakota facilities typically land around 67–77% — the top third Statewide. Below 25% may signal understaffing or heavy agency use — read with Staffing ratings.Rankings are based only on facilities in North Dakota that report data for that category. Facilities without available data are excluded from the ranking.Click the rank badge to see the full State ranking.Click here to see the full State ranking.
Other operating costs Info Everything it costs to run the home apart from payroll — food, utilities, supplies, maintenance, contract labor and administration. Calculated as total operating expense minus payroll (staff salaries and wage-related benefits).
$3.9M
Total costs Info The home's total operating expense for the year — all the costs of running it, salaries included (CMS cost report, Worksheet G-3).
$5.8M

Who this home usually serves

TYPE OF STAY

Mostly short-term rehab stays

Most residents typically stay for a few weeks or months before returning home or moving on.

Most new residents arrive under Medicare (58% of admissions), and a typical Medicare stay runs around 29 days.

Admissions
172 total

Coverage residents most often arrive under.

Medicare 58%
Private pay 20%
Medicaid 22%
Discharges
167 total

Coverage residents most often leave under.

Medicare 35%
Private pay 25%
Medicaid 40%

Places of interest near Minot Health & Rehab

Address 0.3 miles from city center Info Estimated distance in miles from Minot's city center to Minot Health & Rehab's address, calculated via Google Maps.

Calculate Travel Distance to Minot Health & Rehab

Add your location

Address

Compare Assisted Living around Minot

The information below is reported by the North Dakota Department of Health and Human Services, Health Facilities Division.

Minot Health & Rehab
AL
HC
NH
Minot (Downtown) -
108
Facility 108
ND AVG 75
Rank #11 / 53
-
77
Facility 77
ND AVG 42
Rank #8 / 80
-
Trinity Homes
AL
MC
NH
Minot -
141
Facility 141
ND AVG 75
Rank #4 / 53
A+
66
Facility 66
ND AVG 42
Rank #17 / 80
-
Good Samaritan Society – Mohall
AL
MC
NH
Mohall (Main Street East) -
46
Facility 46
ND AVG 75
Rank #35 / 53
-
21
Facility 21
ND AVG 42
Rank #60 / 80
-

Financial Assistance for
Assisted Living in North Dakota

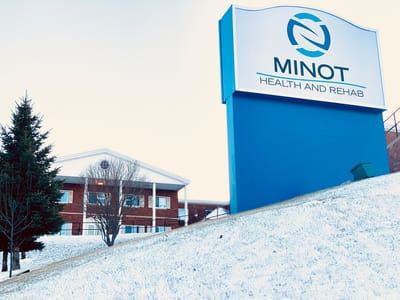
Minot Health & Rehab is located in Minot, North Dakota.
Here are the financial assistance programs available to residents in North Dakota.

Get Financial aid guidance

Aged and Disabled Waiver

ND Medicaid A&D Waiver

Age 65+ or disabled
General North Dakota resident, Medicaid- eligible, nursing home-level care need.
Income Limits (2025) ~$2,829/month 300% FBR, individual
Asset Limits $3,000 individual, higher than most states
ND

Higher asset limit; sparse population aids rural access.

Benefits
Personal care (5-7 hours/day) Respite (240 hours/year) Adult day care (~$60/day) Home aides

Service Payments for Elderly and Disabled (SPED)

ND SPED

Age 65+ or disabled
General North Dakota resident, at risk of decline.
Income Limits ~$1,732/month individual, varies
Asset Limits $50,000 individual, higher limit
ND

Higher asset limit; rural focus.

Benefits
In-home care (2-4 hours/week) Respite (up to 5 days/year) Transportation (~5 trips/month)

Basic Care Assistance Program (BCAP)

North Dakota Basic Care Assistance Program

Age 65+ (or disabled 18+)
General ND resident, in licensed basic care facility, low-income.
Income Limits (2025) ~$1,255/month (individual, after facility costs); varies by facility rate.
Asset Limits $3,000 individual
ND

Supplements SSI; covers ~50 facilities statewide.

Benefits
Cash (~$1,000-$1,500/month) for room/board/care in basic care facilities

Family Home Care Program

North Dakota Family Home Care Program

Age 60+
General ND resident, need help with 1+ ADL, family caregiver available.
Income Limits (2025) No strict cap; prioritizes low-income ~$24,980/year
Asset Limits Not assessed; need-based.
ND

Caregiver must be family; payment varies by hours/service.

Benefits
Family caregiver payment (~$10-$15/hour, up to 20 hours/week) Respite support

Medicare Savings Program (MSP)

North Dakota Medicare Savings Program

Age 65+ or disabled
General ND resident, Medicare Part A/B.
Income Limits (2025) ~$2,510/month (QMB), ~$3,380/month (SLMB), ~$3,598/month (QI)—individual.
Asset Limits $9,430 (individual), $14,130 (couple).
ND

Three tiers; no waitlist; includes Extra Help for Part D.

Benefits
Covers Part B premiums ($174.70/month) Deductibles ($240/year) Copays (~20%)

Family Caregiver Support Program (FCSP)

North Dakota Family Caregiver Support Program

Age
General Caregivers of 60+ needing care or 55+ caregivers of others; ND resident; functional needs (2+ ADLs).
Income Limits (2025) Prioritizes ~$24,980/year (individual); no strict cap.
Asset Limits Not assessed; need-based.
ND

8 regions; rural/low-income priority.

Benefits
Respite (4-6 hours/week or 5 days/year) Adult day care ($50/day) Training Supplies (~$500/year)

VA Aid and Attendance (A&A) and Housebound Benefits

North Dakota VA Aid and Attendance/Housebound

Age 65+ or disabled veteran/spouse
General ND resident, wartime service, need for ADL help (A&A) or homebound.
Income Limits (2025) Net income < ~$1,984/month (veteran with dependent, A&A); pension offsets income.
Asset Limits ~$155,356 net worth limit
ND

High veteran demand in rural areas; ND Veterans Home option.

Benefits
Cash (~$1,433-$2,642/month veteran, ~$951-$1,318 spouse) for care costs (e.g., in-home, assisted living)

Property Tax Homestead Credit for Seniors

North Dakota Homestead Property Tax Credit

Age 65+ (or disabled)
General ND resident, homeowner, low-income.
Income Limits (2025) ~$22,500/year (individual), ~$29,500/year (couple).
Asset Limits Home value < $500,000; other assets not assessed.
ND

Credit up to $500-$1,000; applies to primary residence.

Benefits
Tax reduction (~$500-$1,000/year) on property taxes

Medicaid Personal Care Option (PCO)

North Dakota Medicaid Personal Care Option

Age 65+ (or disabled)
General ND resident, Medicaid-eligible, need help with 1+ ADL.
Income Limits (2025) ~$1,255/month (100% FPL, individual); QIT optional for excess income.
Asset Limits $3,000 (individual), $6,000 (couple) (excludes home up to $713,000, car).
ND

Self-directed option (hire family); part of Medicaid State Plan, not a waiver.

Benefits
Personal care (5-20 hours/week) Homemaker services Respite (~5 days/year)

Frequently Asked Questions about Minot Health & Rehab

What neighborhood is Minot Health & Rehab in?

Minot Health & Rehab is in the Downtown neighborhood.

Is Minot Health & Rehab in a walkable area?

Minot Health & Rehab has a walk score of 77. Very walkable. Most errands can be accomplished on foot, and many essentials are within a short walk.

What is the occupancy rate at Minot Health & Rehab?

Minot Health & Rehab's occupancy is 46.9%.

Does Minot Health & Rehab operate as a for-profit or non-profit?

Minot Health & Rehab is registered as a for-profit.

Are there photos of Minot Health & Rehab?

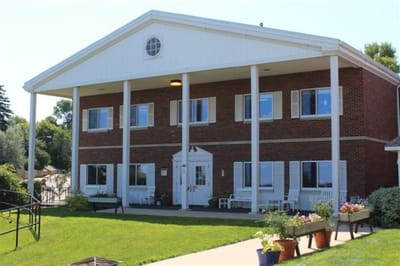
Yes — there are 3 photos of Minot Health & Rehab in the photo gallery on this page.

What is the address of Minot Health & Rehab?

Minot Health & Rehab is located at 600 Main St S, Minot, ND 58701.

What is the phone number of Minot Health & Rehab?

(701) 852-1255 will put you in contact with the team at Minot Health & Rehab.

Guides for Better Senior Living

Care Cost Calculator: See Prices in Your Area

Nursing Home Data Explorer

Don’t Wait Too Long: 7 Red Flag Signs Your Parent Needs Assisted Living Now

The True Cost of Assisted Living in 2025 – And How Families Are Paying For It

Understanding Senior Living Costs: Pricing Models, Discounts & Financial Assistance