


Total staff
159
Employees
76
Contractors
83
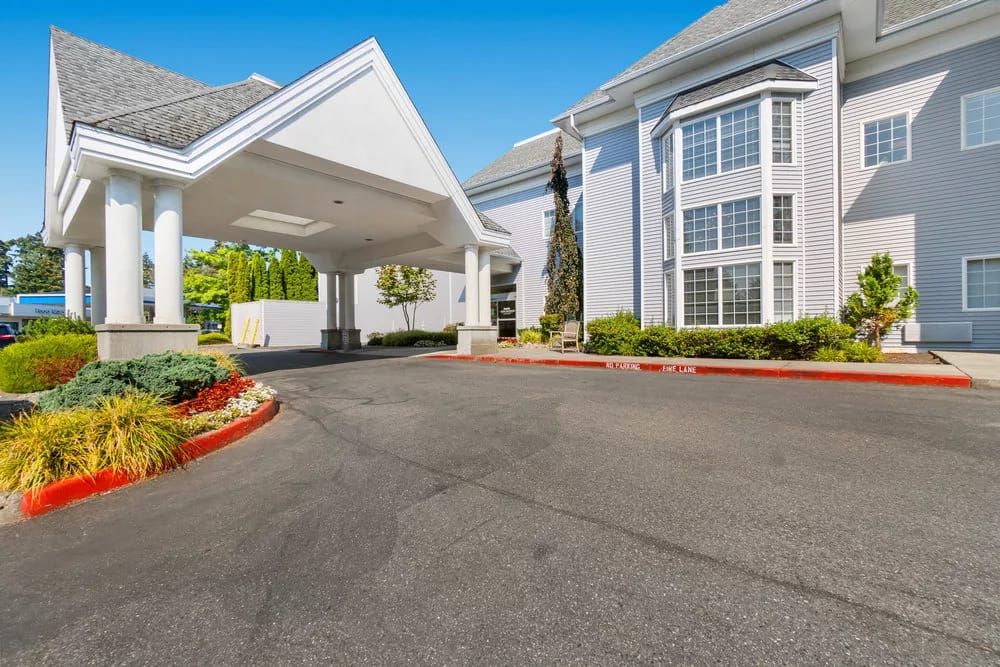
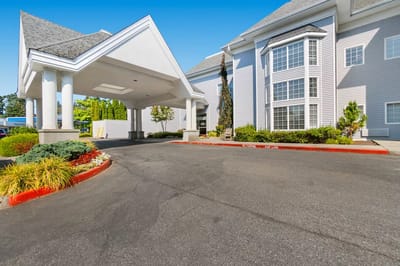

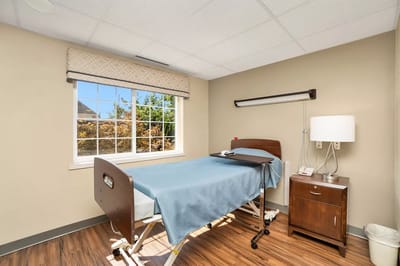

Mission Healthcare at Bellevue, a 69-bed skilled nursing facility operated by the nonprofit MHO, LLC, is located at 2424 156th Avenue NE in Bellevue’s Northeast neighborhood, King County. The community accepts Medicare (60% of new admissions, 26-day average stay) and private-pay residents (40%, approximately 1-month average stay); Medicaid is not accepted.
The current census stands at 51 residents with occupancy at 67.4%, below the Washington state average of 72.5%.
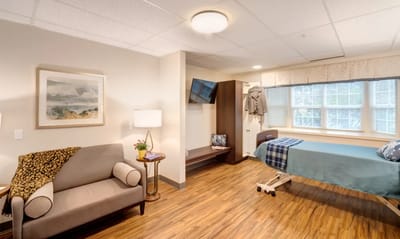
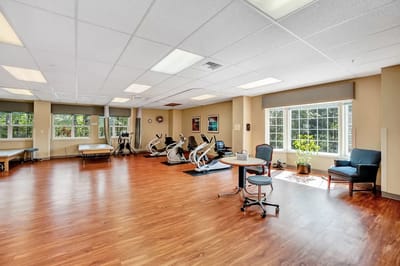
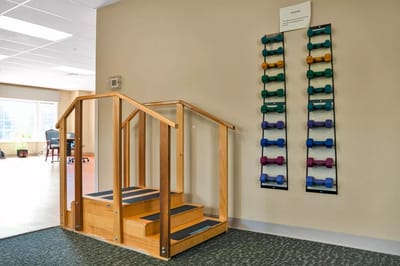
As part of the Careage Community network, Mission Healthcare describes its clinical focus on short-term post-acute rehabilitation, including cardiac rehabilitation, fall prevention, and neurological recovery. Therapy services encompass speech, occupational, and physical therapy.
Nursing care averages 4 hours 33 minutes per resident per day, ranking 17th among 89 Washington facilities and exceeding the state average by 8%. The facility maintains a staff-to-resident ratio of 3.12:1, above the state average, though this metric reflects current below-average occupancy. Contractors comprise 21.6% of total staffing hours.
Despite high absolute nursing hours, the facility’s CMS staffing rating is 1-star, placing it 70.8% below the state average. The overall CMS rating is 2-star (38% below state average), with health inspection rated 2-star (29% below state average) and quality measures rated 3-star (27% above state average).
Zero percent of long-stay residents experience major falls with injury and zero percent develop urinary tract infections. Pressure ulcers affect 1.9% of high-risk residents, substantially better than the state average. Conversely, 16.7% of long-stay residents experience excessive weight loss; 187% worse than the state average. Short-stay influenza vaccination reaches 67.8%, 17% below the state average.
The facility has not faced federal penalties in three years. However, financial performance deteriorated significantly. The facility reported a $2.9 million operating deficit against $10.2 million in revenue, yielding a -28.3% profit margin.
Payroll comprises 62.5% of revenue; a top-tier investment ranking 10th of 93 state facilities.
The facility operated at cumulative losses since 2015, with bed capacity reduced from 129 to 69 beds in 2019. Financial data through 2023 shows persistent operating deficits despite payroll prioritization.
Mission Healthcare is situated in a very walkable location (walk score 83) in suburban Bellevue, 4.3 miles from the city center and 2.72 miles from Kaiser Permanente Bellevue Medical Center.
The facility is structured for Medicare and private-pay short-term post-acute rehabilitation in a specialized care environment, though financial constraints and occupancy challenges suggest operational strain.
Staffing hours
![]() Daily nursing hours per resident by staff type, reported to CMS. Higher is generally better — compare this facility to state and national averages to see where staffing stands.
Daily nursing hours per resident by staff type, reported to CMS. Higher is generally better — compare this facility to state and national averages to see where staffing stands.
Hours per resident per day vs Washington averages
Total nursing care
![]() This home is ranked 16th out of 61 homes in Washington for nurse hours. Total adjusted nursing hours per resident per day, combining RN, LPN, and aide time. CMS adjusts this for case-mix so facilities can be fairly compared.
This home is ranked 16th out of 61 homes in Washington for nurse hours. Total adjusted nursing hours per resident per day, combining RN, LPN, and aide time. CMS adjusts this for case-mix so facilities can be fairly compared.
4h 33m
8% above state avg3 of 6 metrics below state avg
Reporting period: October 1 – December 31, 2025 (Q4 2025). Source: CMS Payroll-Based Journal report.
Manages medical care and health needs.
Assists with medical care and medications.
Helps with daily care and mobility.
Total hours from contractors
6,408 contractor hours this quarter
| Certified Nursing Assistant | 47 | 31 | 78 | 14,399 | 92 | 100% | 8.3 |
| Registered Nurse | 10 | 9 | 19 | 3,880 | 92 | 100% | 8.6 |
| Licensed Practical Nurse | 5 | 1 | 6 | 2,583 | 91 | 99% | 8.4 |
| Clinical Nurse Specialist | 3 | 0 | 3 | 1,411 | 83 | 90% | 8.1 |
| RN Director of Nursing | 2 | 0 | 2 | 955 | 71 | 77% | 8.8 |
| Speech Language Pathologist | 0 | 10 | 10 | 829 | 74 | 80% | 6.1 |
| Physical Therapy Assistant | 0 | 7 | 7 | 828 | 77 | 84% | 6.5 |
| Respiratory Therapy Technician | 0 | 11 | 11 | 663 | 71 | 77% | 4.9 |
| Physical Therapy Aide | 0 | 6 | 6 | 618 | 67 | 73% | 7.6 |
| Qualified Activities Professional | 2 | 0 | 2 | 541 | 50 | 54% | 9.7 |
| Nurse Practitioner | 1 | 0 | 1 | 520 | 65 | 71% | 8 |
| Administrator | 1 | 0 | 1 | 472 | 59 | 64% | 8 |
| Mental Health Service Worker | 1 | 0 | 1 | 424 | 53 | 58% | 8 |
| Dietitian | 1 | 0 | 1 | 397 | 36 | 39% | 11 |
| Dental Services Staff | 2 | 0 | 2 | 347 | 56 | 61% | 6.2 |
| Other Dietary Services Staff | 1 | 0 | 1 | 339 | 45 | 49% | 7.5 |
| Occupational Therapy Aide | 0 | 2 | 2 | 253 | 47 | 51% | 5.4 |
| Qualified Social Worker | 0 | 4 | 4 | 78 | 21 | 23% | 3.7 |
| Occupational Therapy Assistant | 0 | 1 | 1 | 59 | 8 | 9% | 7.4 |
| Medical Director | 0 | 1 | 1 | 52 | 13 | 14% | 4 |
Federal penalties imposed by CMS for regulatory violations, including civil money penalties (fines) and denials of payment for new Medicare/Medicaid admissions.
Source: CMS Penalties Database
No penalties in the past 3 years
No civil money penalties or payment denials were reported in the last 3 years.
These measures show how residents usually do over time at this home, based on health outcomes and preventive care.
Washington average: 10.0
Washington average: 20.9
Washington average: 16.4%
Washington average: 21.8%
Washington average: 24.3%
Washington average: 2.6%
Washington average: 4.9%
Washington average: 1.7%
Washington average: 5.8%
Washington average: 16.2%
Washington average: 14.5%
Washington average: 96.2%
Washington average: 88.1%
Washington average: 1.4%
Washington average: 82.0%
Quality measures are calculated from Minimum Data Set (MDS) assessments. For most measures, lower percentages indicate better care quality.
60% of new residents, usually for short-term rehab.
40% of new residents, often for short stays.
Source: CMS Long-Term Care Facility Characteristics (Data as of Jan 2026)
Data sourced from CMS Long-Term Care Facility Characteristics quarterly report. Payer mix reflects the current resident census by primary payment source.
Historical financial and operational data for Mission Healthcare at Bellevue from 2011–2023, based on CMS SNF Cost Reports.
Key figures below are for fiscal year ending in 12/2023.
Based on CMS SNF Cost Report for fiscal year ending in 12/2023.
Most residents typically stay for a few weeks or months before returning home or moving on.
Most new residents arrive under Medicare (60% of admissions), and a typical Medicare stay runs around 26 days.
Coverage residents most often arrive under.
Coverage residents most often leave under.
![]() 4.3 miles from city center
4.3 miles from city center
![]() Estimated distance in miles from Bellevue's city center to Mission Healthcare at Bellevue's address, calculated via Google Maps.
— 2.72 miles to nearest hospital (Kaiser Permanente Bellevue Medical Center)
Estimated distance in miles from Bellevue's city center to Mission Healthcare at Bellevue's address, calculated via Google Maps.
— 2.72 miles to nearest hospital (Kaiser Permanente Bellevue Medical Center)
Add your location
Mission Healthcare at Bellevue is located in NE Bellevue, Washington State.
Here are the financial assistance programs available to residents in Washington State.
Mission Healthcare at Bellevue is in the Northeast Bellevue neighborhood of Bellevue.
Mission Healthcare at Bellevue has a walk score of 83. Very walkable. Most errands can be accomplished on foot, and many essentials are within a short walk.
Mission Healthcare at Bellevue's occupancy is 67.4%.
No, Mission Healthcare at Bellevue has a no-pet policy.
Mission Healthcare at Bellevue is registered as a for-profit in WA.
Yes — there are 10 photos of Mission Healthcare at Bellevue in the photo gallery on this page.
Mission Healthcare at Bellevue is located at 2424 156Th Ave Ne, Bellevue, WA 98007.
Care Cost Calculator: See Prices in Your Area
Nursing Home Data Explorer
Don’t Wait Too Long: 7 Red Flag Signs Your Parent Needs Assisted Living Now
The True Cost of Assisted Living in 2025 – And How Families Are Paying For It
Understanding Senior Living Costs: Pricing Models, Discounts & Financial Assistance


