Missoula Health and Rehabilitation Center

Nursing Home

Missoula Health and Rehabilitation Center

3018 Rattlesnake Dr, Missoula, MT 59802 View Map
Nursing Home
icon
Care Cost Calculator: See Prices in Your Area Care Cost Calculator: See Prices in Your Area icon
Overview of Missoula Health and Rehabilitation Center

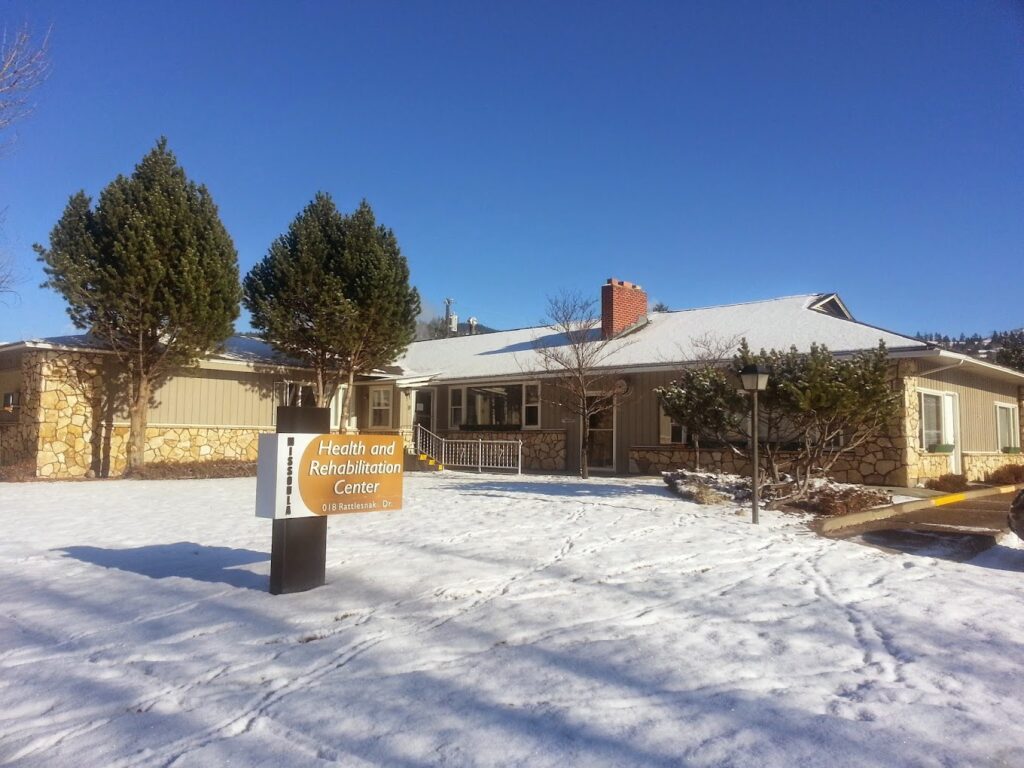
Missoula Health and Rehabilitation Center stands out as one of the most reputable and trusted assisted living communities in the area. Alongside their exceptional services, they provide specialized care through their dedicated memory care unit, ensuring residents with cognitive challenges receive the attention they need. With a focus on promoting well-being and independence, they go above and beyond to create a nurturing environment that feels like home.

Their team of skilled professionals is equipped to provide the highest level of care, ensuring residents’ physical and emotional well-being is prioritized. With tailored programs and a secure environment, residents receive the specialized attention necessary to promote cognitive functioning and enhance their overall quality of life.

(406) 549-0988

Quality ratings

Measured by Centers for Medicare & Medicaid Services (CMS)

Overall rating Info Official CMS rating based on health inspections, staffing and quality measures.
3/5
Montana average: 2.9/5
Health Inspection Info Official CMS rating based on deficiencies found during state health inspections.
3/5
Montana average: 2.8/5
Staffing Info Official CMS rating based on nurse staffing hours per resident per day.
4/5
Montana average: 3.2/5
Quality Measures Info Official CMS rating based on clinical outcomes for residents.
4/5
Montana average: 3.0/5

Nursing care per resident

Info Average daily nursing hours per resident (adjusted for acuity). Higher values indicate more nursing time per resident.
4h 15m per day

This home provides 6% less nursing time per resident than the state average.

Montana average: 4h 32m per day

Staffing hours breakdown

Info Hours of care per resident per day, broken down by staff type. Data from CMS Medicare.
Staff type Facility State avg National avg
Registered Nurse (RN) Info Registered nurse hours per resident per day. 36m per day 56m per day 41m per day
LPN / LVN Info Licensed Practical Nurse / Licensed Vocational Nurse hours per resident per day. 53m per day 30m per day 52m per day
Nurse Aide Info Nurse aide hours per resident per day. 2h 4m per day 2h 32m per day 2h 21m per day
Total Nursing (Weekend) Info Total number of nurse staff hours per resident per day on weekends. 3h 4m per day 3h 29m per day 3h 26m per day
Physical Therapist Info Physical therapist staff hours per resident per day. 8m per day 4m per day 4m per day
RN (Weekend) Info Registered nurse hours per resident per day on weekends. 23m per day 41m per day 29m per day

Capacity and availability

Smaller home

May offer a more intimate, personalized care environment.

Total beds 49

This home usually has availability

Lower occupancy suggests more openings may be available.

Lower demand than the Montana average
Occupancy rate 80.4%
Residents per day (avg) 36
Occupancy rate
80.4%
Residents per day (avg)
36

Who this home usually serves

TYPE OF STAY

Mostly short-term rehab stays

Most residents typically stay for a few weeks or months before returning home or moving on.

Might be optimal for
Short stays Recovery Medicare-covered care

Breakdown by payment type

Medicare

40% of new residents, usually for short-term rehab.

Typical stay 1 months

Private pay

30% of new residents, often for short stays.

Typical stay 1 years

Medicaid

30% of new residents, often for long-term daily care.

Typical stay 1 - 2 years

Finances and operations

Proprietary home
Other
Home revenue
$2.0M
Operating loss
-$89.4K
Proprietary home Other
Home revenue
$1,972,399.00
Operating loss
$-89,430.00
Payroll costs Info The portion of the home's budget spent on staff, including nurses, caregivers, and other employees who support care and operations.
$704.3K
35.7% of revenue
Other operating costs Info All remaining costs needed to run the home, such as food, utilities, building maintenance, supplies and administrative expenses.
$1.4M
Total costs $2.1M
Bed community size
49-bed community
A moderately sized community that may balance personal attention with shared amenities and social activities.
Years in operation
17 years in operation
A community with a solid operating history and experience delivering ongoing care.
Walk Score
Walk Score: 13 / 100
Car-dependent. Most errands require a car, with limited nearby walkable options.

About this community

License Status
Current
Facility Type
Long Term Care
License Date
February 29, 2024
License Expiration
February 28, 2027

Additional licensing details

License number: 97
CMS Certification Number: 275035

Ownership & operating entity

Missoula Health and Rehabilitation Center is administrated by Davis, Rebecca.

Staffing

Key information about the people who lead and staff this community.

Leadership

Contact: Ms. Karrie Holt, Executive Director

Care Services

Provides Assisted Living
Provides Memory Care

Types of Care at Missoula Health and Rehabilitation Center

Assisted Living Memory Care Nursing Home
Contact Missoula Health and Rehabilitation Center

Inspection History

In Montana, the Department of Public Health and Human Services, Quality Assurance Division is the state body responsible for inspecting and licensing all senior residential care facilities.

Latest inspection

Date:January 29, 2025

Compare Nursing Homes around Missoula

The information below is reported by the Montana Department of Public Health and Human Services, Quality Assurance Division.
Missoula Health and Rehabilitation Center
SNF

Nursing Home 24/7 care needed

AL

Assisted Living For seniors needing help with daily tasks but not full-time nursing.

Missoula (Upper Rattlesnake)
60
No
13
PACIFIC NORTHWEST SNF OPERATIONS HOLDINGS (MT) LLC
80.4%
$1,923,240.00
$704,306.00
36.6%
36.20
3/5
4.2432
3/5
4/5
4/5
-
34
-
-43%
-6%
+30%
-
Riverside Nursing and Rehabilitation Center
SNF

Nursing Home 24/7 care needed

AL

Assisted Living For seniors needing help with daily tasks but not full-time nursing.

Missoula (Heart of Missoula)
72
No
42
DAVID SMILOVITZ TRUST
90.6%
$8,017,891.00
$3,227,148.00
40.2%
66.50
3/5
4.2401
3/5
4/5
4/5
1
30
1
-10%
-6%
+47%
Studio / 1 Bed / 2 Bed
Big Sky Palliative and Hospice
SNF

Nursing Home 24/7 care needed

AL

Assisted Living For seniors needing help with daily tasks but not full-time nursing.

Missoula (Franklin to the Fort)
-
No
62
-
-
-
-
-
-
-
-
-
-
-
-
-
-
-
-
-
-
The Village Health & Rehabilitation
SNF

Nursing Home 24/7 care needed

AL

Assisted Living For seniors needing help with daily tasks but not full-time nursing.

Missoula
193
No
49
-
-
-
-
-
-
-
-
-
-
-
-
-
-
-
-
-
Studio / 1 Bed

Places of interest near Missoula Health and Rehabilitation Center

Address 2.6 miles from city center — 1.66 miles to nearest hospital (Providence Wound Care Center)

Address 3018 Rattlesnake Dr, Missoula, MT 59802

Calculate Travel Distance to Missoula Health and Rehabilitation Center

Add your location

Address

Staffing Data

Source: CMS Payroll-Based Journal (Q2 2025)

68
Total Staff
68
Employees
0
Contractors
16,649
Total Hours (Quarter)
25
Avg Staff/Day
7.3
Avg Shift (hrs)
Nursing Staff Breakdown
Role Count Avg Shift (hrs) Uses Contractors?
Registered Nurse68.5 No
Licensed Practical Nurse58 No
Certified Nursing Assistant277.2 No
Staff by Category
Administration
1 staff
8hs shift avg
Nursing Staff
44 staff
7.4hs shift avg
Physicians & Practitioners
4 staff
7.7hs shift avg
Therapy Services
12 staff
6.7hs shift avg
Activities & Recreation
0 staff
0hs shift avg
Social Services
0 staff
0hs shift avg
Dietary Services
6 staff
7.7hs shift avg
Other Services
1 staff
7hs shift avg
Role Employees Contractors Total Staff Total Hours Days Worked % of Days Avg Shift (hrs)
Certified Nursing Assistant270276,50891100%7.2
Physical Therapist110112,36091100%6.3
Licensed Practical Nurse5051,99591100%8
Registered Nurse6061,0877684%8.5
Clinical Nurse Specialist3031,0166976%7.5
Occupational Therapy Aide1015846673%8.8
Administrator1015126470%8
Nurse Practitioner1015126470%8
RN Director of Nursing2024816571%7.2
Dietitian3034656066%7.8
Mental Health Service Worker1014416369%7
Other Dietary Services Staff3034355763%7.6
Nurse Aide in Training4042523033%6.1

Health Inspection History

Inspections
Total health inspections 3

Montana average 5.1


Last Health inspection on Feb 2025

Total health citations 34
Citations per inspection
11.33

Health citations are formal notices following inspections when they fail to comply with safety and care standards.

31 of 34 citations resulted from standard inspections; and 3 of 34 came from combined inspections (standard and complaint).

Breakdown of citation severity (last 3 years)
Critical Health citations More info 0
100% better than Montana average

Montana average: 0.3


Serious Health citations More info 0
100% better than Montana average

Montana average: 2.2

0 critical citations More info Montana average: 0.3

0 serious citations More info Montana average: 2.2

34 moderate citations More info Montana average: 26.5

0 minor citations More info Montana average: 0.7
Citations history (last 3 years)
Administration moderate citation Feb 13, 2025
Corrected

Infection Control moderate citation Feb 13, 2025
Corrected

Nutrition moderate citation Feb 13, 2025
Corrected

Pharmacy moderate citation Feb 13, 2025
Corrected

Facility Characteristics

Source: CMS Long-Term Care Facility Characteristics (Data as of Jan 2026)

Ownership: For-Profit LLC
Part of: Pacific Northwest Op Co, LLC
Resident Census by Payment Source
34 Total Residents
Medicare 2 (5.9%)
Medicaid 32 (94.1%)
Programs & Services
Residents' Group
Nurse Aide Training
Family Engagement

Active councils help families stay involved in care decisions and facility operations.

Quality of care over time

These measures show how residents usually do over time at this home, based on health outcomes and preventive care.

High-risk clinical events score Info A composite score based on pressure ulcers, falls with injury, weight loss, walking ability decline, and activities of daily living decline. 4.0
64% better than Montana average

Montana average: 11.2

Functional decline score Info A composite score based on activities of daily living decline, walking ability decline, and incontinence. 13.2
39% better than Montana average

Montana average: 21.8

Long-stay resident measures
Need for Help with Daily Activities Increased Info Percent of long-stay residents whose need for help with daily activities has increased 6.7%
65% better than Montana average

Montana average: 19.4%

Walking Ability Worsened Info Percent of long-stay residents whose ability to move independently worsened 7.7%
63% better than Montana average

Montana average: 20.8%

Low Risk Residents with Bowel/Bladder Incontinence Info Percent of low risk long-stay residents who lose control of their bowels or bladder 25.1%
In line with Montana average

Montana average: 25.2%

Falls with Major Injury Info Percent of long-stay residents experiencing one or more falls with major injury 3.2%
27% better than Montana average

Montana average: 4.3%

High Risk Residents with Pressure Ulcers Info Percent of long-stay high risk residents with pressure ulcers 2.3%
64% better than Montana average

Montana average: 6.3%

Urinary Tract Infection Info Percent of long-stay residents with a urinary tract infection 0.0%
100% better than Montana average

Montana average: 2.8%

Lost Too Much Weight Info Percent of long-stay residents who lose too much weight 0.0%
100% better than Montana average

Montana average: 6.1%

Depressive Symptoms Info Percent of long-stay residents who have depressive symptoms 0.0%
100% better than Montana average

Montana average: 4.7%

Antipsychotic Use Info Percent of long-stay residents who received an antipsychotic medication 37.9%
98% worse than Montana average

Montana average: 19.1%

Pneumococcal Vaccine Info Percent of long-stay residents assessed and appropriately given the pneumococcal vaccine 100.0%
7% better than Montana average

Montana average: 93.8%

Influenza Vaccine Info Percent of long-stay residents assessed and appropriately given the seasonal influenza vaccine 100.0%
7% better than Montana average

Montana average: 93.7%

Hospitalizations per 1,000 days Info Number of hospitalizations per 1,000 long-stay resident days. 0.56
56% better than Montana average

Montana average: 1.27

ED visits per 1,000 days Info Number of outpatient emergency department visits per 1,000 long-stay resident days. 0.96
56% better than Montana average

Montana average: 2.17

Short-stay resident measures
Pneumococcal Vaccine Info Percent of short-stay residents assessed and appropriately given the pneumococcal vaccine 95.2%
25% better than Montana average

Montana average: 76.4%

Antipsychotic medication increase Info Percent of short-stay residents who newly received an antipsychotic medication 0.0%
100% better than Montana average

Montana average: 1.8%

Influenza Vaccine Info Percent of short-stay residents assessed and appropriately given the seasonal influenza vaccine 72.4%
In line with Montana average

Montana average: 73.8%

Re-hospitalized after SNF stay Info Percentage of short-stay residents who were re-hospitalized after their nursing home admission. 27.6%
42% worse than Montana average

Montana average: 19.4%

Emergency department visits Info Percentage of short-stay residents who had an outpatient emergency department visit. 19.2%
28% worse than Montana average

Montana average: 15.0%

Falls with major injury Info Percentage of SNF residents who experience falls with major injury during their stay. 5.3%
583% worse than Montana average

Montana average: 0.8%

Ability to care for self at discharge Info Percentage of residents at or above expected ability to care for themselves at discharge. 53.6%
In line with Montana average

Montana average: 53.7%

Successful return to home or community Info Rate of successful return to home or community from a skilled nursing facility. 43.5%
14% worse than Montana average

Montana average: 50.6%

Guides for Better Senior Living

Care Cost Calculator: See Prices in Your Area

Nursing Home Data Explorer

Don’t Wait Too Long: 7 Red Flag Signs Your Parent Needs Assisted Living Now

The True Cost of Assisted Living in 2025 – And How Families Are Paying For It

Understanding Senior Living Costs: Pricing Models, Discounts & Financial Assistance

Financial Aid for Montana Seniors

Get financial aid guidance

Big Sky Waiver

Montana Medicaid Big Sky Waiver

Age 65+ or disabled, Montana resident, Medicaid- eligible, nursing home-level care need.

~$2,829/month (300% FBR, individual).

$2,000 (individual), $3,000 (couple).

Rural state; limited providers in some areas.

Montana Community First Choice

MT CFC

Age 65+ or disabled, Montana resident, Medicaid- eligible.

~$1,732/month (individual, Medicaid threshold).

$2,000 (individual).

Less intensive than waiver; rural focus.

Big Sky Rx

Montana Big Sky Rx

Age 65+ or disabled, Montana resident, enrolled in Medicare Part D, income below limit.

~$2,510/month (individual), ~$3,380/month (couple).

Not assessed.

Covers up to $38.75/month premium; statewide via AAAs.

Medicare Savings Program (MSP)

Montana Medicare Savings Program

Age 65+ or disabled, Montana resident, Medicare Part A/B.

~$2,510/month (QMB), ~$3,380/month (SLMB), ~$3,598/month (QI)—individual.

$9,430 (individual), $14,130 (couple).

Three tiers; no waitlist; includes Extra Help for Part D.

Montana Caregiver Support Program (via NFCSP)

Montana Caregiver Support Program

Caregivers of 60+ needing care or 55+ caregivers of others; Montana resident; functional needs (2+ ADLs).

Prioritizes ~$24,980/year (individual); no strict cap.

Not assessed; need-based.

10 AAAs; prioritizes low-income, rural caregivers.

Senior Community Service Employment Program (SCSEP)

Montana SCSEP

Age 55+, unemployed, low-income, Montana resident.

~$1,983/month (125% FPL).

Not specified; income-focused.

Priority for veterans, rural residents; AARP partnership.

VA Aid and Attendance (A&A) and Housebound Benefits

Montana VA Aid and Attendance/Housebound

Age 65+ or disabled veteran/spouse, Montana resident, wartime service, need for ADL help (A&A) or homebound.

Net income < ~$1,984/month (veteran with dependent, A&A); pension offsets income.

~$155,356 (net worth limit).

High veteran demand in rural areas.

Who we are

Your Senior Care Partner, Every Step of the Way

We help families find affordable senior communities and unlock same day discounts, Medicaid, and Medicare options tailored to your needs.

Contact us Today