


Total staff
159
Employees
97
Contractors
62
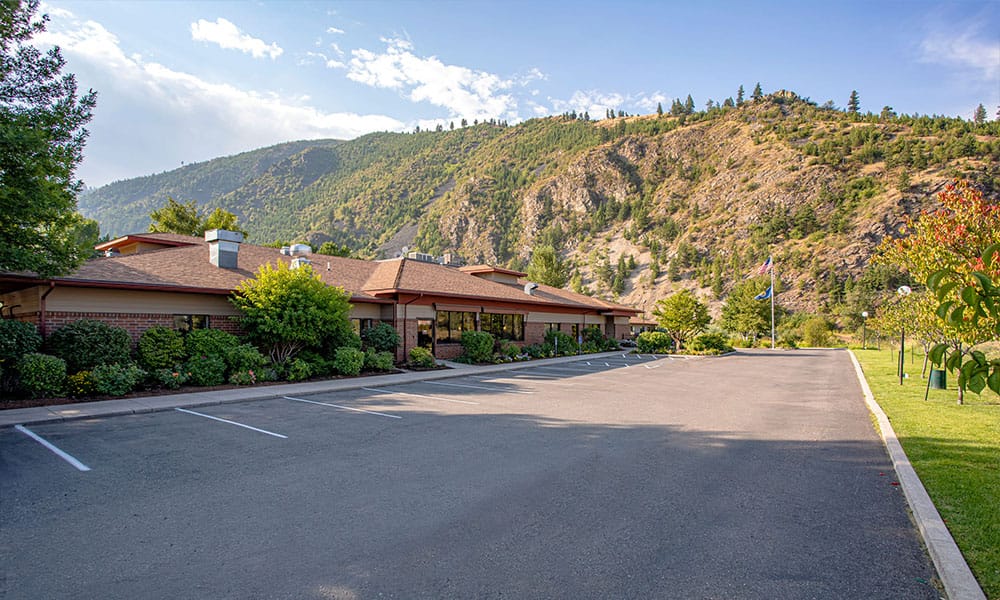
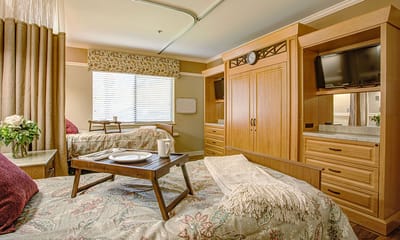
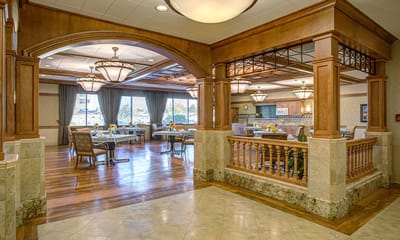
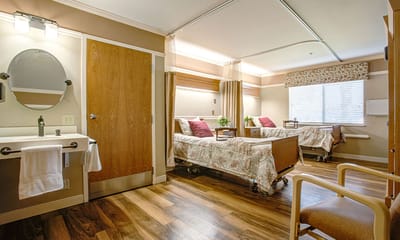
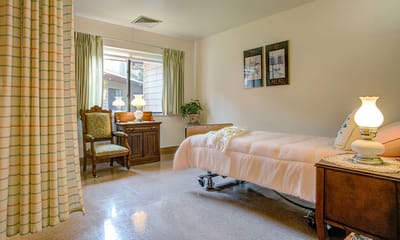
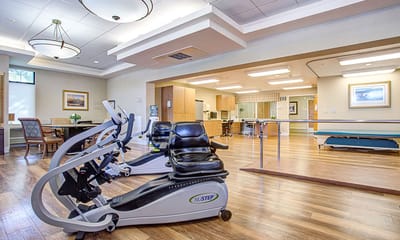
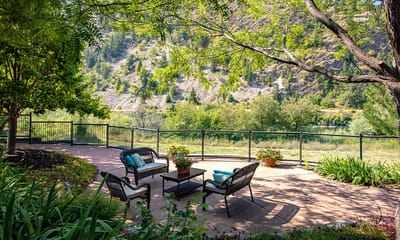
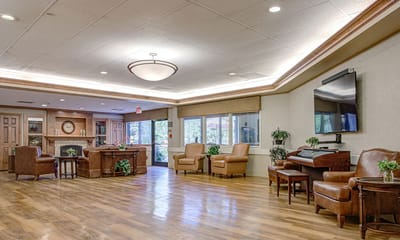
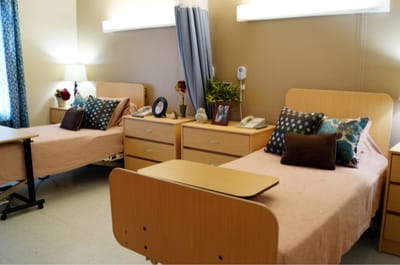
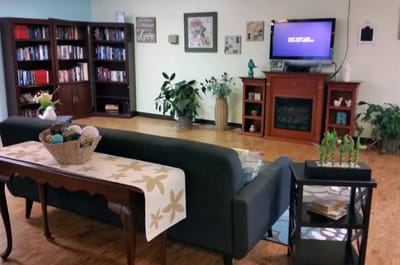
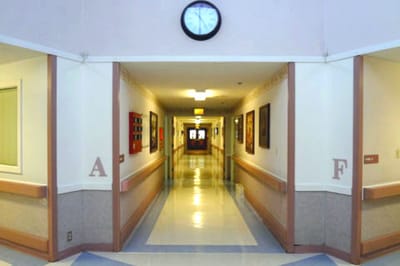
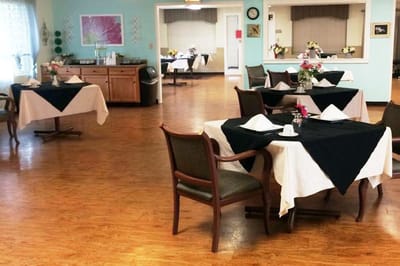
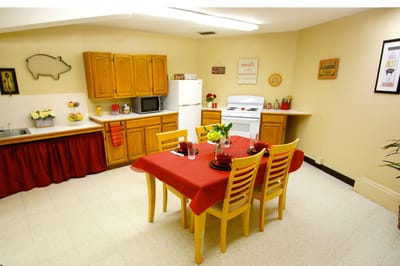
Riverside Nursing and Rehabilitation Center is the epitome of excellence when it comes to senior living care, as evidenced by its outstanding nursing home quality measures. Within this extraordinary community, exceptional standards are upheld to ensure that residents receive the utmost care and support they deserve. The ambiance exudes warmth and comfort, creating a welcoming environment that feels like home.
The dedicated team of professionals utilizes state-of-the-art equipment to deliver personalized treatment plans, all while maintaining the highest nursing home quality measures. These measures serve as a testament to the community’s commitment to providing superior care and achieving optimal outcomes for its residents. In addition to top-notch medical services, Riverside goes above and beyond to ensure resident satisfaction. The community values transparency and encourages open communication by actively seeking and addressing nursing home reviews. This commitment to ongoing improvement allows Riverside to continuously enhance its services, ensuring that residents receive the highest level of care and comfort.
| Staff type | Hours / Day / Resident | vs state avg |
|---|---|---|
|
Registered Nurse (RN)
| 44m per day | ▼ 22% State avg: 56m per day · National avg: 41m per day |
|
LPN / LVN
| 23m per day | ▼ 22% State avg: 30m per day · National avg: 52m per day |
|
Nurse Aide
| 2h 43m per day | ▲ 7% State avg: 2h 32m per day · National avg: 2h 21m per day |
|
Weekend Total Nursing
| 3h 26m per day | ■ Avg State avg: 3h 29m per day · National avg: 3h 26m per day |
|
Physical Therapist
| 3m per day | ▼ 13% State avg: 4m per day · National avg: 4m per day |
|
Weekend RN
| 27m per day | ▼ 33% State avg: 41m per day · National avg: 29m per day |
Reporting period: October 1 – December 31, 2025 (Q4 2025). Source: CMS Payroll-Based Journal report.
Manages medical care and health needs.
Assists with medical care and medications.
Helps with daily care and mobility.
Total hours from contractors
2,806 contractor hours this quarter
| Certified Nursing Assistant | 65 | 21 | 86 | 14,576 | 92 | 100% | 7.4 |
| Registered Nurse | 8 | 11 | 19 | 3,471 | 92 | 100% | 9.2 |
| Licensed Practical Nurse | 6 | 6 | 12 | 1,862 | 92 | 100% | 7.2 |
| Medication Aide/Technician | 6 | 2 | 8 | 1,844 | 88 | 96% | 8.2 |
| Other Dietary Services Staff | 3 | 0 | 3 | 861 | 87 | 95% | 6.7 |
| Qualified Activities Professional | 2 | 0 | 2 | 630 | 79 | 86% | 7.1 |
| Nurse Practitioner | 1 | 0 | 1 | 512 | 64 | 70% | 8 |
| Mental Health Service Worker | 1 | 0 | 1 | 512 | 64 | 70% | 8 |
| Physical Therapy Assistant | 0 | 5 | 5 | 489 | 67 | 73% | 7 |
| RN Director of Nursing | 1 | 0 | 1 | 485 | 64 | 70% | 7.6 |
| Administrator | 1 | 0 | 1 | 464 | 58 | 63% | 8 |
| Clinical Nurse Specialist | 1 | 0 | 1 | 409 | 49 | 53% | 8.3 |
| Dietitian | 1 | 0 | 1 | 400 | 50 | 54% | 8 |
| Respiratory Therapy Technician | 0 | 6 | 6 | 352 | 53 | 58% | 6 |
| Occupational Therapy Aide | 1 | 2 | 3 | 304 | 54 | 59% | 4.5 |
| Therapeutic Recreation Specialist | 0 | 3 | 3 | 190 | 26 | 28% | 4.5 |
| Qualified Social Worker | 0 | 1 | 1 | 185 | 53 | 58% | 3.5 |
| Speech Language Pathologist | 0 | 1 | 1 | 34 | 10 | 11% | 3.4 |
| Medical Director | 0 | 2 | 2 | 22 | 4 | 4% | 5.6 |
| Physical Therapy Aide | 0 | 2 | 2 | 11 | 3 | 3% | 3.8 |
Federal penalties imposed by CMS for regulatory violations, including civil money penalties (fines) and denials of payment for new Medicare/Medicaid admissions.
Source: CMS Penalties Database (Data as of Jan 2026)
Montana average: $87K
Montana average: 2.3
Montana average: 0.2
No penalties in the past 3 years
No civil money penalties or payment denials were reported in the last 3 years.
These measures show how residents usually do over time at this home, based on health outcomes and preventive care.
Montana average: 11.2
Montana average: 21.8
Montana average: 19.4%
Montana average: 20.8%
Montana average: 25.2%
Montana average: 4.3%
Montana average: 6.3%
Montana average: 2.8%
Montana average: 6.1%
Montana average: 4.7%
Montana average: 19.1%
Montana average: 93.8%
Montana average: 93.7%
Montana average: 1.27
Montana average: 2.17
Montana average: 76.4%
Montana average: 1.8%
Montana average: 73.8%
Montana average: 19.4%
Montana average: 15.0%
Montana average: 0.8%
Montana average: 53.7%
Montana average: 50.6%
Quality measures are calculated from Minimum Data Set (MDS) assessments. For most measures, lower percentages indicate better care quality.
57% of new residents, usually for short-term rehab.
38% of new residents, often for short stays.
5% of new residents, often for long-term daily care.
Source: CMS Long-Term Care Facility Characteristics (Data as of Jan 2026)
Residents meet regularly to discuss policies, care quality, and activities
Organized group of residents that meets regularly to discuss facility policies, quality of life, and activities.
Data sourced from CMS Long-Term Care Facility Characteristics quarterly report. Payer mix reflects the current resident census by primary payment source.
Historical financial and operational data for Riverside Nursing and Rehabilitation Center from 2011–2023, based on CMS SNF Cost Reports.
Key figures below are for fiscal year ending in 12/2023.
Based on CMS SNF Cost Report for fiscal year ending in 12/2023.
Most residents typically stay for a few weeks or months before returning home or moving on.
Most new residents arrive under Medicare (57% of admissions), and a typical Medicare stay runs around 1 - 2 months.
Coverage residents most often arrive under.
Coverage residents most often leave under.
![]() 1.1 miles from city center
1.1 miles from city center
![]() Estimated distance in miles from Missoula's city center to Riverside Nursing and Rehabilitation Center's address, calculated via Google Maps.
— 1.4 miles to nearest hospital (Providence St. Patrick Hospital)
Estimated distance in miles from Missoula's city center to Riverside Nursing and Rehabilitation Center's address, calculated via Google Maps.
— 1.4 miles to nearest hospital (Providence St. Patrick Hospital)
Add your location
Info below is compiled from CMS reports & the MT Dept. of Public Health & Human Services (DPHHS), senior community websites & trusted data sources such as Walk Score & BBB.
Communities are listed from highest to lowest based on our ranking methodology.
| The Living Centre | NH AL IL SNF | Stevensville (Main Street) | 50
Facility
50
MT AVG
70
Rank
#61 / 103 |
74.6%
Facility
74.6%
MT AVG
61.5
Rank
#14 / 32 | +21% | 4.87
Facility
4.87
MT AVG
4.53
Rank
#8 / 33 | -41% | +8% | $37.5k
Facility
$37.5k
MT AVG
$83.8k
Rank
#18 / 34 | 15
Facility
15
MT AVG
29.7
Rank
#4 / 34 | 2.5
Facility
2.5
MT AVG
5.7
Rank
#3 / 34 | 2 | 37 | A+ |
38
Facility
38
MT AVG
43
Rank
#90 / 159 | Living Centre Limited | $6.0MFiscal year ending 08/2024
Facility
$6.0MFiscal year ending 08/2024
MT AVG
$6.3M
Rank
#23 / 32 | $3.4MFiscal year ending 08/2024
Facility
$3.4MFiscal year ending 08/2024
MT AVG
$2.8M
Rank
#19 / 32 | 56.7%Fiscal year ending 08/2024
Facility
56.7%Fiscal year ending 08/2024
MT AVG
45.6%
Rank
#4 / 32 | 275125 | ||||
| Missoula Health and Rehabilitation Center | NH AL MC RC SNF | Missoula (Upper Rattlesnake) | 49
Facility
49
MT AVG
70
Rank
#62 / 103 | - | - | 4.24
Facility
4.24
MT AVG
4.53
Rank
#10 / 33 | -58% | -6% | $0
Facility
$0
MT AVG
$83.8k
Rank
#1 / 34 | 34
Facility
34
MT AVG
29.7
Rank
#20 / 34 | 11.3
Facility
11.3
MT AVG
5.7
Rank
#34 / 34 | - | 37 | - |
13
Facility
13
MT AVG
43
Rank
#131 / 159 | Pacific Northwest Snf Operations Holdings (Mt) LLC | $4.0M*Fiscal year ending 12/2022These figures are from this home's most recent complete cost report — an older period than most facilities report. Compare with that in mind.
Facility
$4.0M*Fiscal year ending 12/2022These figures are from this home's most recent complete cost report — an older period than most facilities report. Compare with that in mind.
MT AVG
$6.3M
Rank
#22 / 32 | $2.0M*Fiscal year ending 12/2022These figures are from this home's most recent complete cost report — an older period than most facilities report. Compare with that in mind.
Facility
$2.0M*Fiscal year ending 12/2022These figures are from this home's most recent complete cost report — an older period than most facilities report. Compare with that in mind.
MT AVG
$2.8M
Rank
#27 / 32 | 48.7%*Fiscal year ending 12/2022These figures are from this home's most recent complete cost report — an older period than most facilities report. Compare with that in mind.
Facility
48.7%*Fiscal year ending 12/2022These figures are from this home's most recent complete cost report — an older period than most facilities report. Compare with that in mind.
MT AVG
45.6%
Rank
#28 / 32 | 275035 | ||||
| Riverside Nursing and Rehabilitation Center | NH AL | Missoula (Heart Of Missoula) | 72
Facility
72
MT AVG
70
Rank
#42 / 103 |
91.1%
Facility
91.1%
MT AVG
61.5
Rank
#5 / 32 | +48% | 4.24
Facility
4.24
MT AVG
4.53
Rank
#10 / 33 | -23% | -6% | $65.1k
Facility
$65.1k
MT AVG
$83.8k
Rank
#26 / 34 | 30
Facility
30
MT AVG
29.7
Rank
#17 / 34 | 6.0
Facility
6.0
MT AVG
5.7
Rank
#22 / 34 | 1 | 66 | - |
42
Facility
42
MT AVG
43
Rank
#82 / 159 | David Smilovitz Trust | $8.1MFiscal year ending 12/2023
Facility
$8.1MFiscal year ending 12/2023
MT AVG
$6.3M
Rank
#17 / 32 | $4.0MFiscal year ending 12/2023
Facility
$4.0MFiscal year ending 12/2023
MT AVG
$2.8M
Rank
#7 / 32 | 49.6%Fiscal year ending 12/2023
Facility
49.6%Fiscal year ending 12/2023
MT AVG
45.6%
Rank
#6 / 32 | 275126 |
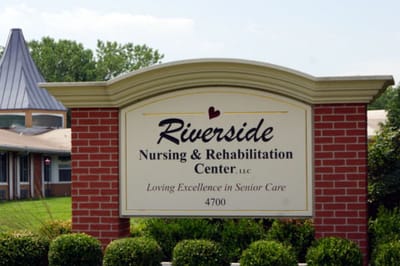
Riverside Nursing and Rehabilitation Center is located in Missoula, Montana.
Here are the financial assistance programs available to residents in Montana.
Riverside Nursing and Rehabilitation Center is in the Heart of Missoula neighborhood.
Riverside Nursing and Rehabilitation Center has a walk score of 42. Somewhat walkable. A few nearby services may be reachable on foot, but most trips require transportation.
Riverside Nursing and Rehabilitation Center's occupancy is 90.6%.
No, Riverside Nursing and Rehabilitation Center has a no-pet policy.
Riverside Nursing and Rehabilitation Center is registered as a for-profit.
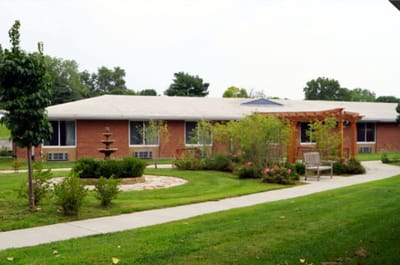
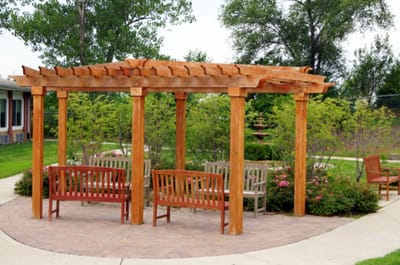
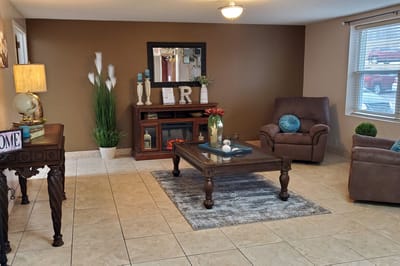
Yes — there are 17 photos of Riverside Nursing and Rehabilitation Center in the photo gallery on this page.
Riverside Nursing and Rehabilitation Center is located at 1301 E Broadway St, Missoula, MT 59802.
Care Cost Calculator: See Prices in Your Area
Nursing Home Data Explorer
Don’t Wait Too Long: 7 Red Flag Signs Your Parent Needs Assisted Living Now
The True Cost of Assisted Living in 2025 – And How Families Are Paying For It
Understanding Senior Living Costs: Pricing Models, Discounts & Financial Assistance


