


Total health inspections
3
Pennsylvania average 6.7
Last Health inspection on Jun 2025
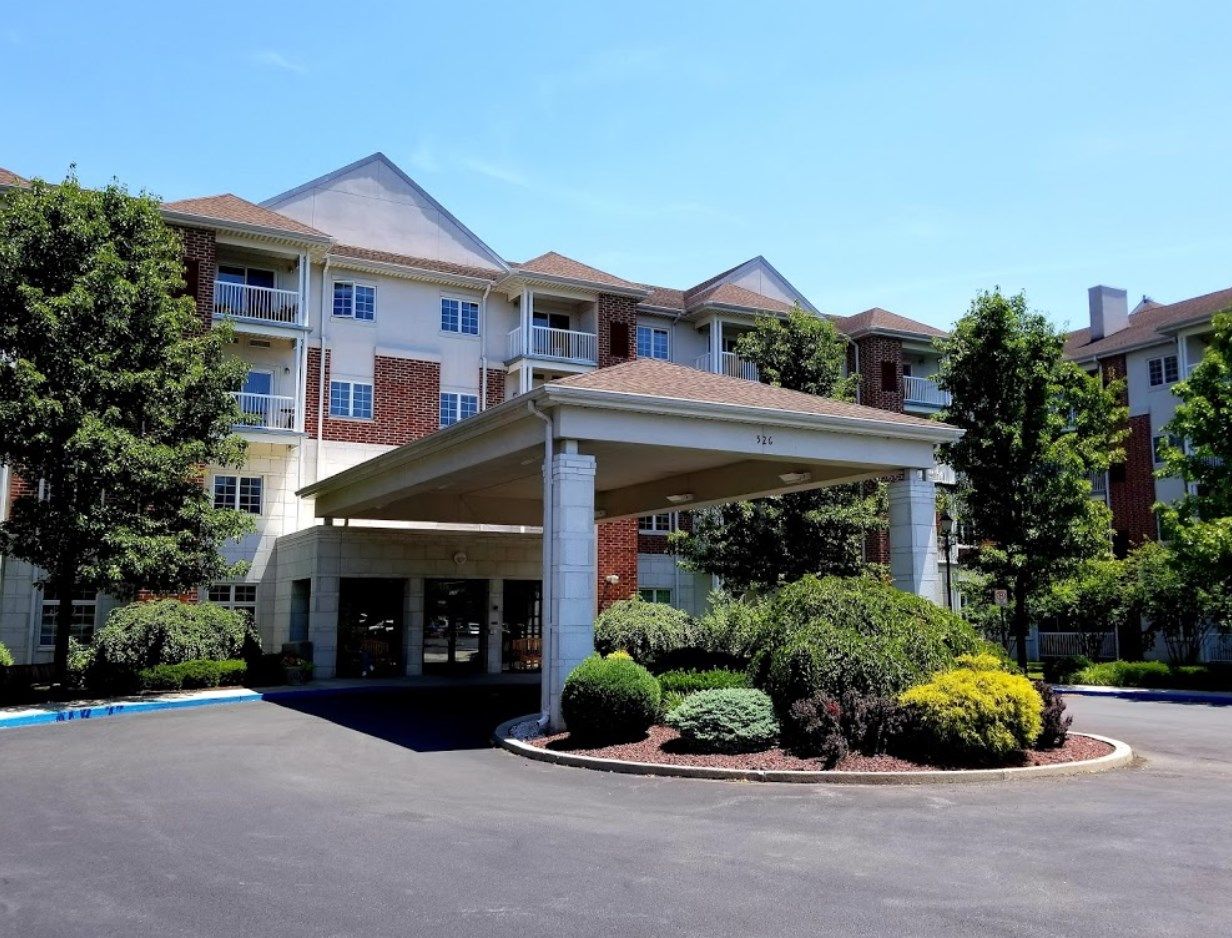


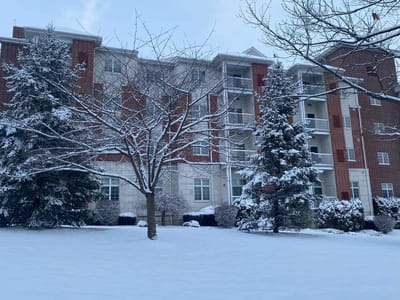


Moravian Village of Bethlehem is a trusted retirement community in Bethlehem, PA, that offers personal care and transitional care. Surrounded by lush trees and scenic mountain views, residents here are assured of having a laid-back stay. Chef-prepared dining, household management, and a 24-hour emergency response system are also among the community’s unique offerings. Prioritizing the well-being of older adults, the community employs a holistic approach to care tailored to their individual needs.
With a registered dietitian, meals are thoughtfully planned for residents’ preferences. The community’s cozy setting and beautiful scenery are also perfect for meditation and yoga. With its spacious pet-friendly amenities, residents can play with their pets. This senior living community is one of the ideal options to spend retirement in the historic district of Bethlehem, PA, especially with its top-notch services and home-like environment.
| Staff type | Hours / Day / Resident | vs state avg |
|---|---|---|
|
Registered Nurse (RN)
|
1h 9m per day | ▲ 48% State avg: 47m per day · National avg: 41m per day |
|
LPN / LVN
|
1h 7m per day | ▲ 21% State avg: 55m per day · National avg: 52m per day |
|
Nurse Aide
|
2h 8m per day | ▼ 3% State avg: 2h 12m per day · National avg: 2h 20m per day |
|
Weekend Total Nursing
|
4h 11m per day | ▲ 19% State avg: 3h 31m per day · National avg: 3h 26m per day |
|
Physical Therapist
|
13m per day | ▲ 116% State avg: 6m per day · National avg: 4m per day |
|
Weekend RN
|
57m per day | ▲ 74% State avg: 33m per day · National avg: 28m per day |
Moravian Village of Bethlehem is legally operated by Moravian Village Of Bethlehem.
In Pennsylvania, the Department of Human Services (for assisted living facilities) and the Department of Health (for nursing homes) conduct unannounced inspections to verify adherence to state regulations.
7 points above the Pennsylvania average for nursing homes (83/100)
Rank #132 / 460 in Pennsylvania Inspection Score — State benchmarked This home is ranked 132nd out of 460 homes in Pennsylvania for inspection score. Shows this facility's inspection score compared to the Pennsylvania average among 460 comparable communities in the ranking pool. Facilities with the same value for a metric share the same rank. Rankings are based only on facilities in Pennsylvania that report data for that category. Facilities without available data are excluded from the ranking. This is a proprietary Assisted Living Magazine score. Inspection score: 90 out of 100. Letter grade A-. 7 points above the Pennsylvania average for nursing homes (83/100)
Citations
|
This Facility | PA Average | vs. PA Avg |
|---|---|---|---|
|
Total citations
|
10 | 63 | This facility has 84% fewer total citations than a typical Pennsylvania nursing home (10 vs. PA avg 63).↓ 84% better Rank #49 / 478 Total citations — State benchmarked This home is ranked 49th out of 478 homes in Pennsylvania for total citations. Shows this facility's total citations compared to the Pennsylvania average among 478 comparable communities in the ranking pool. Facilities with the same value for a metric share the same rank. Rankings are based only on facilities in Pennsylvania that report data for that category. Facilities without available data are excluded from the ranking. |
|
Citations per inspection
|
1.1 | 5.7 | This facility has 81% fewer citations per inspection than a typical Pennsylvania nursing home (1.1 vs. PA avg 5.7).↓ 81% better Rank #29 / 478 Citations per inspection — State benchmarked This home is ranked 29th out of 478 homes in Pennsylvania for citations per inspection. Shows this facility's citations per inspection compared to the Pennsylvania average among 478 comparable communities in the ranking pool. Facilities with the same value for a metric share the same rank. Rankings are based only on facilities in Pennsylvania that report data for that category. Facilities without available data are excluded from the ranking. |
Inspections
|
This Facility | PA Average | vs. PA Avg |
|---|---|---|---|
|
Total inspections
|
9 | 11 | This facility has had 18% fewer total inspections than the Pennsylvania average (9 vs. PA avg 11). More inspections can mean more regulatory scrutiny rather than worse care.↓ 18% fewer |
|
Inspections with citations
|
5 | 8 | This facility has 38% fewer inspections with citations than a typical Pennsylvania nursing home (5 vs. PA avg 8).↓ 38% better |
|
Inspection citation rate
|
56% | 73% | This facility has 17 percentage points lower inspection citation rate than a typical Pennsylvania nursing home (56% vs. PA avg 73%).↓ 17% better Rank #123 / 478 Inspection citation rate — State benchmarked This home is ranked 123rd out of 478 homes in Pennsylvania for % of inspections with citations. Shows this facility's % of inspections with citations compared to the Pennsylvania average among 478 comparable communities in the ranking pool. Facilities with the same value for a metric share the same rank. Rankings are based only on facilities in Pennsylvania that report data for that category. Facilities without available data are excluded from the ranking. |
Pennsylvania average 6.7
Last Health inspection on Jun 2025
Pennsylvania average 31.3
Pennsylvania average 4.4
Health citations are formal notices following inspections when they fail to comply with safety and care standards.
3 of 4 citations resulted from standard inspections; and 1 of 4 resulted from complaint investigations.
Pennsylvania average: 0.3
Pennsylvania average: 0.6
Reporting period: October 1 – December 31, 2025 (Q4 2025). Source: CMS Payroll-Based Journal report.
Manages medical care and health needs.
Assists with medical care and medications.
Helps with daily care and mobility.
Total hours from contractors
8,840 contractor hours this quarter
| Certified Nursing Assistant | 28 | 31 | 59 | 10,364 | 92 | 100% | 7 |
| Licensed Practical Nurse | 12 | 37 | 49 | 4,502 | 92 | 100% | 7.5 |
| Registered Nurse | 12 | 14 | 26 | 2,669 | 92 | 100% | 6.4 |
| Clinical Nurse Specialist | 9 | 0 | 9 | 2,441 | 92 | 100% | 7.9 |
| Respiratory Therapy Technician | 0 | 4 | 4 | 1,050 | 77 | 84% | 5.9 |
| RN Director of Nursing | 4 | 0 | 4 | 909 | 74 | 80% | 8.4 |
| Physical Therapy Assistant | 0 | 4 | 4 | 818 | 71 | 77% | 7.1 |
| Physical Therapy Aide | 0 | 3 | 3 | 698 | 73 | 79% | 6 |
| Speech Language Pathologist | 0 | 3 | 3 | 634 | 65 | 71% | 6.7 |
| Mental Health Service Worker | 2 | 0 | 2 | 592 | 61 | 66% | 7.4 |
| Other Dietary Services Staff | 2 | 0 | 2 | 589 | 69 | 75% | 7.4 |
| Nurse Practitioner | 1 | 0 | 1 | 515 | 64 | 70% | 8 |
| Qualified Social Worker | 0 | 4 | 4 | 500 | 65 | 71% | 5 |
| Administrator | 1 | 0 | 1 | 496 | 62 | 67% | 8 |
| Occupational Therapy Aide | 2 | 0 | 2 | 460 | 61 | 66% | 7 |
| Dietitian | 1 | 0 | 1 | 424 | 56 | 61% | 7.6 |
Federal penalties imposed by CMS for regulatory violations, including civil money penalties (fines) and denials of payment for new Medicare/Medicaid admissions.
Source: CMS Penalties Database
No penalties in the past 3 years
No civil money penalties or payment denials were reported in the last 3 years.
These measures show how residents usually do over time at this home, based on health outcomes and preventive care.
Pennsylvania average: 11.0
Pennsylvania average: 22.2
Pennsylvania average: 19.0%
Pennsylvania average: 21.1%
Pennsylvania average: 26.7%
Pennsylvania average: 3.2%
Pennsylvania average: 5.5%
Pennsylvania average: 1.8%
Pennsylvania average: 6.6%
Pennsylvania average: 5.5%
Pennsylvania average: 17.1%
Pennsylvania average: 86.9%
Pennsylvania average: 93.5%
Pennsylvania average: 1.68
Pennsylvania average: 1.20
Pennsylvania average: 68.8%
Pennsylvania average: 1.5%
Pennsylvania average: 68.7%
Pennsylvania average: 23.1%
Pennsylvania average: 9.8%
Pennsylvania average: 0.8%
Pennsylvania average: 53.7%
Pennsylvania average: 50.6%
Quality measures are calculated from Minimum Data Set (MDS) assessments. For most measures, lower percentages indicate better care quality.
59% of new residents, usually for short-term rehab.
41% of new residents, often for short stays.
Source: CMS Long-Term Care Facility Characteristics (Data as of Jan 2026)
Residents meet regularly to discuss policies, care quality, and activities
Part of a Continuing Care Retirement Community offering multiple care levels
Organized group of residents that meets regularly to discuss facility policies, quality of life, and activities.
Data sourced from CMS Long-Term Care Facility Characteristics quarterly report. Payer mix reflects the current resident census by primary payment source.
Historical financial and operational data for Moravian Village of Bethlehem from 2011–2023, based on CMS SNF Cost Reports.
Key figures below are for fiscal year ending in 12/2023.
Based on CMS SNF Cost Report for fiscal year ending in 12/2023.
Most residents typically stay for a few weeks or months before returning home or moving on.
Most new residents arrive under Medicare (59% of admissions), and a typical Medicare stay runs around 24 days.
Coverage residents most often arrive under.
Coverage residents most often leave under.
![]() 0.5 miles from city center
0.5 miles from city center
![]() Estimated distance in miles from Bethlehem's city center to Moravian Village of Bethlehem's address, calculated via Google Maps.
Estimated distance in miles from Bethlehem's city center to Moravian Village of Bethlehem's address, calculated via Google Maps.
Add your location
Info below is compiled from CMS reports & the PA Depts. of Human Services & Health, senior community websites & trusted data sources such as Walk Score & BBB.
Communities are listed from highest to lowest based on our ranking methodology.
|
|
|
|
|
|
|
|
|
|
|
|
|
|
|
|
|
|
|
|
|
|
|
|
|
|
|
|---|---|---|---|---|---|---|---|---|---|---|---|---|---|---|---|---|---|---|---|---|---|---|---|---|---|
| Moravian Village of Bethlehem |
NH
AL
IL
MC
SNF
|
Bethlehem (Central Bethlehem) |
250
Facility
250
PA AVG
94
Rank
#9 / 553
| - | - |
4.61
Facility
4.61
PA AVG
4.15
Rank
#65 / 181
| +24% | +11% |
$0
Facility
$0
PA AVG
$61.2k
Rank
#1 / 184
|
90
Facility
90
PA AVG
83
Rank
#132 / 460
|
4
Facility
4
PA AVG
31.3
Rank
#17 / 179
|
1.3
Facility
1.3
PA AVG
4.4
Rank
#10 / 179
| - | 18 | - |
59
Facility
59
PA AVG
46
Rank
#216 / 667
| Moravian Village Of Bethlehem, Inc |
$17.7MFiscal year ending 12/2023
Facility
$17.7MFiscal year ending 12/2023
PA AVG
$32.8M
Rank
#113 / 183
|
$7.5MFiscal year ending 12/2023
Facility
$7.5MFiscal year ending 12/2023
PA AVG
$6.7M
Rank
#114 / 183
|
42%Fiscal year ending 12/2023
Facility
42%Fiscal year ending 12/2023
PA AVG
40%
Rank
#109 / 183
| 396096 | ||||
| Country Meadows of Bethlehem V |
NH
AL
HOS
IL
MC
RC
SNF
|
Bethlehem |
126
Facility
126
PA AVG
94
Rank
#100 / 553
|
48.4%
Facility
48.4%
PA AVG
68.1
Rank
#431 / 507
| -29% |
4.08
Facility
4.08
PA AVG
4.15
Rank
#101 / 181
| -20% | -2% |
$0
Facility
$0
PA AVG
$61.2k
Rank
#1 / 184
|
88
Facility
88
PA AVG
83
Rank
#162 / 460
|
6
Facility
6
PA AVG
31.3
Rank
#35 / 179
|
3.0
Facility
3.0
PA AVG
4.4
Rank
#61 / 179
| - | 61 | - |
5
Facility
5
PA AVG
46
Rank
#634 / 667
| Leader Holdings, LP |
$10.0MFiscal year ending 12/2023
Facility
$10.0MFiscal year ending 12/2023
PA AVG
$32.8M
Rank
#159 / 183
|
$6.7MFiscal year ending 12/2023
Facility
$6.7MFiscal year ending 12/2023
PA AVG
$6.7M
Rank
#133 / 183
|
67.5%Fiscal year ending 12/2023
Facility
67.5%Fiscal year ending 12/2023
PA AVG
40%
Rank
#8 / 183
| 396053 | ||||
| Kirkland Village |
NH
AL
HOS
IL
MC
RC
SNF
|
Bethlehem |
64
Facility
64
PA AVG
94
Rank
#382 / 553
|
46.9%
Facility
46.9%
PA AVG
68.1
Rank
#440 / 507
| -31% |
4.30
Facility
4.30
PA AVG
4.15
Rank
#81 / 181
| +46% | +4% |
$21.6k
Facility
$21.6k
PA AVG
$61.2k
Rank
#153 / 184
|
84
Facility
84
PA AVG
83
Rank
#220 / 460
|
8
Facility
8
PA AVG
31.3
Rank
#49 / 179
|
4.0
Facility
4.0
PA AVG
4.4
Rank
#102 / 179
| - | 30 | A+ |
12
Facility
12
PA AVG
46
Rank
#590 / 667
| Presbyterian Homes, Inc |
$26.2MFiscal year ending 12/2023
Facility
$26.2MFiscal year ending 12/2023
PA AVG
$32.8M
Rank
#62 / 183
|
$8.9MFiscal year ending 12/2023
Facility
$8.9MFiscal year ending 12/2023
PA AVG
$6.7M
Rank
#111 / 183
|
34.1%Fiscal year ending 12/2023
Facility
34.1%Fiscal year ending 12/2023
PA AVG
40%
Rank
#171 / 183
| 395916 |
Moravian Village of Bethlehem is located in Bethlehem, Pennsylvania.
Here are the financial assistance programs available to residents in Pennsylvania.
Moravian Village of Bethlehem is in the Central Bethlehem neighborhood of Bethlehem.
Moravian Village of Bethlehem has a walk score of 59. Moderately walkable. Some errands can be accomplished on foot, with a mix of nearby amenities.
According to PA state health department records, Moravian Village of Bethlehem's license number is 215690.
According to PA state health department records, Moravian Village of Bethlehem's license expires on August 3, 2026.
Moravian Village of Bethlehem's occupancy is 43.8%.
No, Moravian Village of Bethlehem has a no-pet policy.
Moravian Village of Bethlehem is registered as a non-profit in PA.
Care Cost Calculator: See Prices in Your Area
Nursing Home Data Explorer
Don’t Wait Too Long: 7 Red Flag Signs Your Parent Needs Assisted Living Now
The True Cost of Assisted Living in 2025 – And How Families Are Paying For It
Understanding Senior Living Costs: Pricing Models, Discounts & Financial Assistance


