

Total health inspections
5
Texas average 7.4
Last Health inspection on Jan 2025

We arrange tours, appointments, and even moving support so you don’t have to
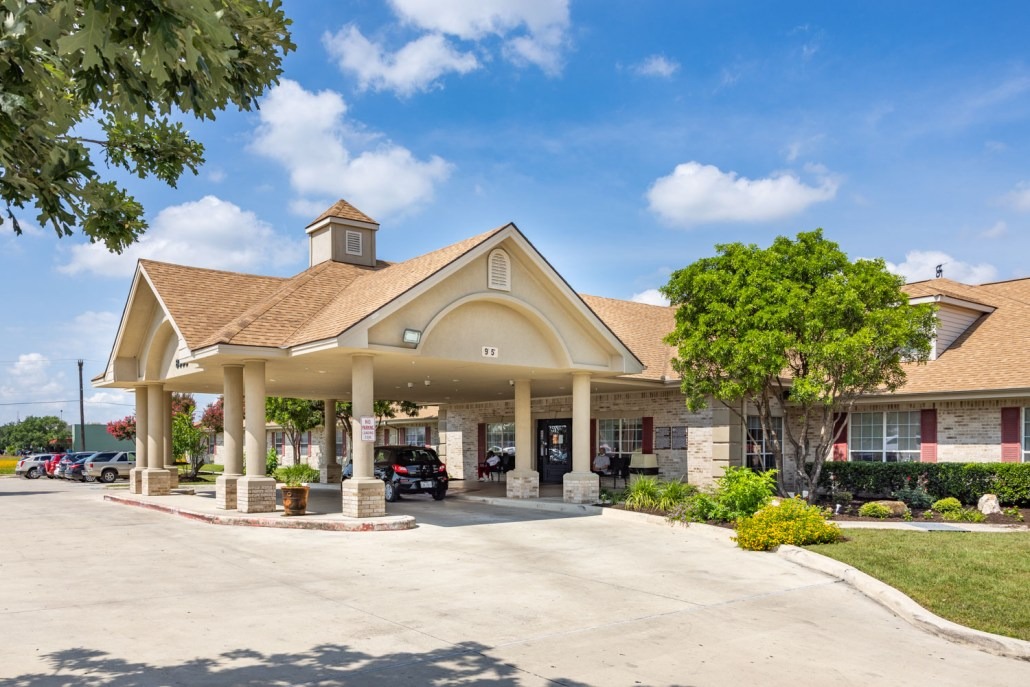
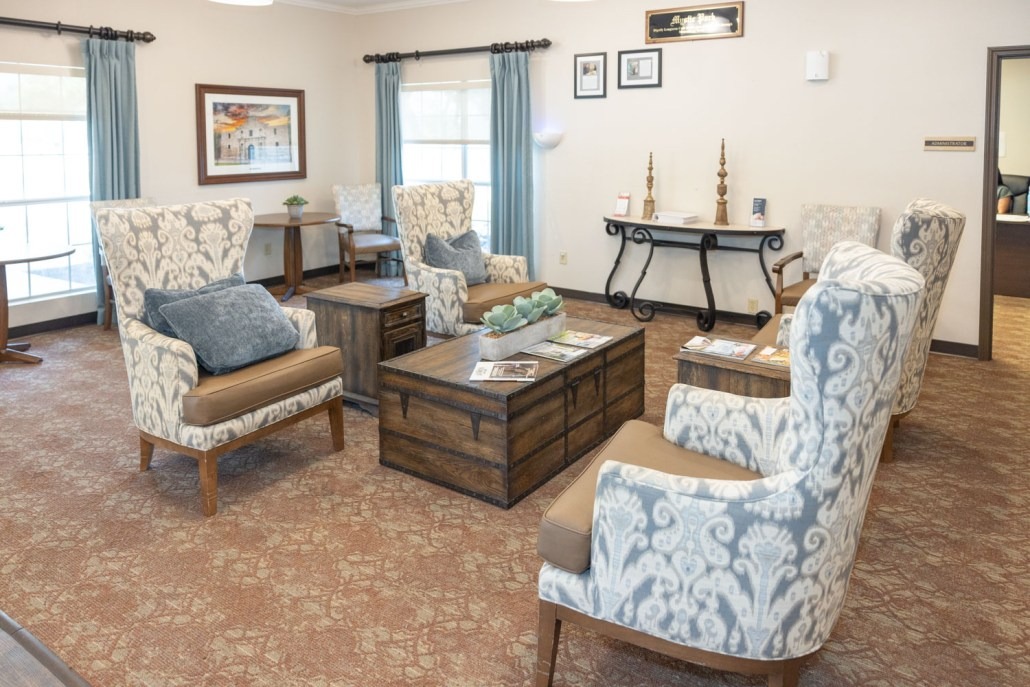
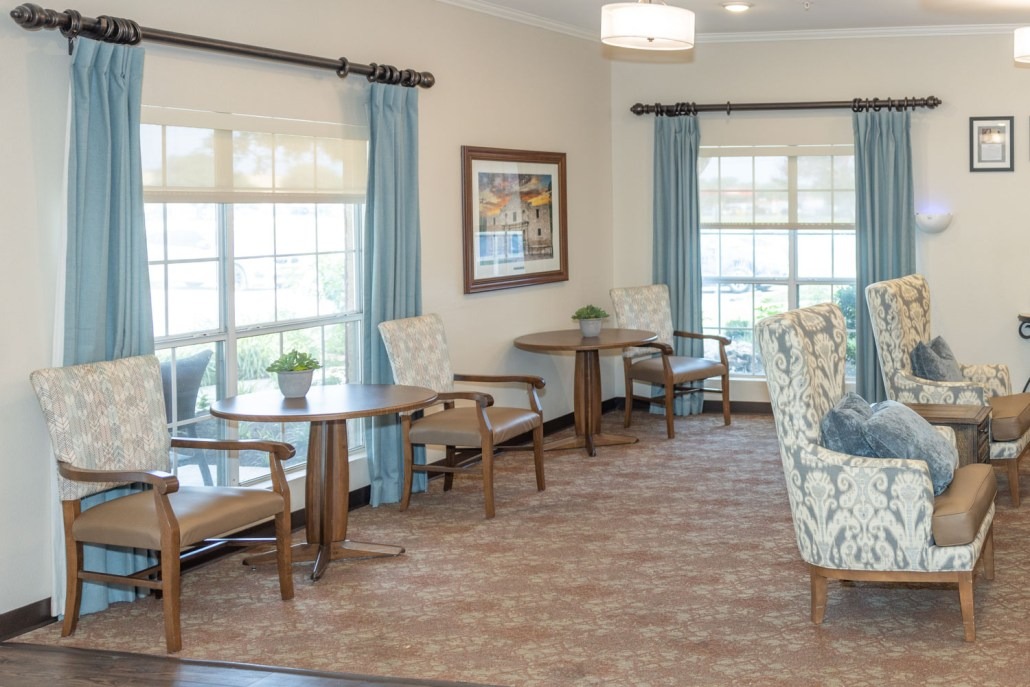
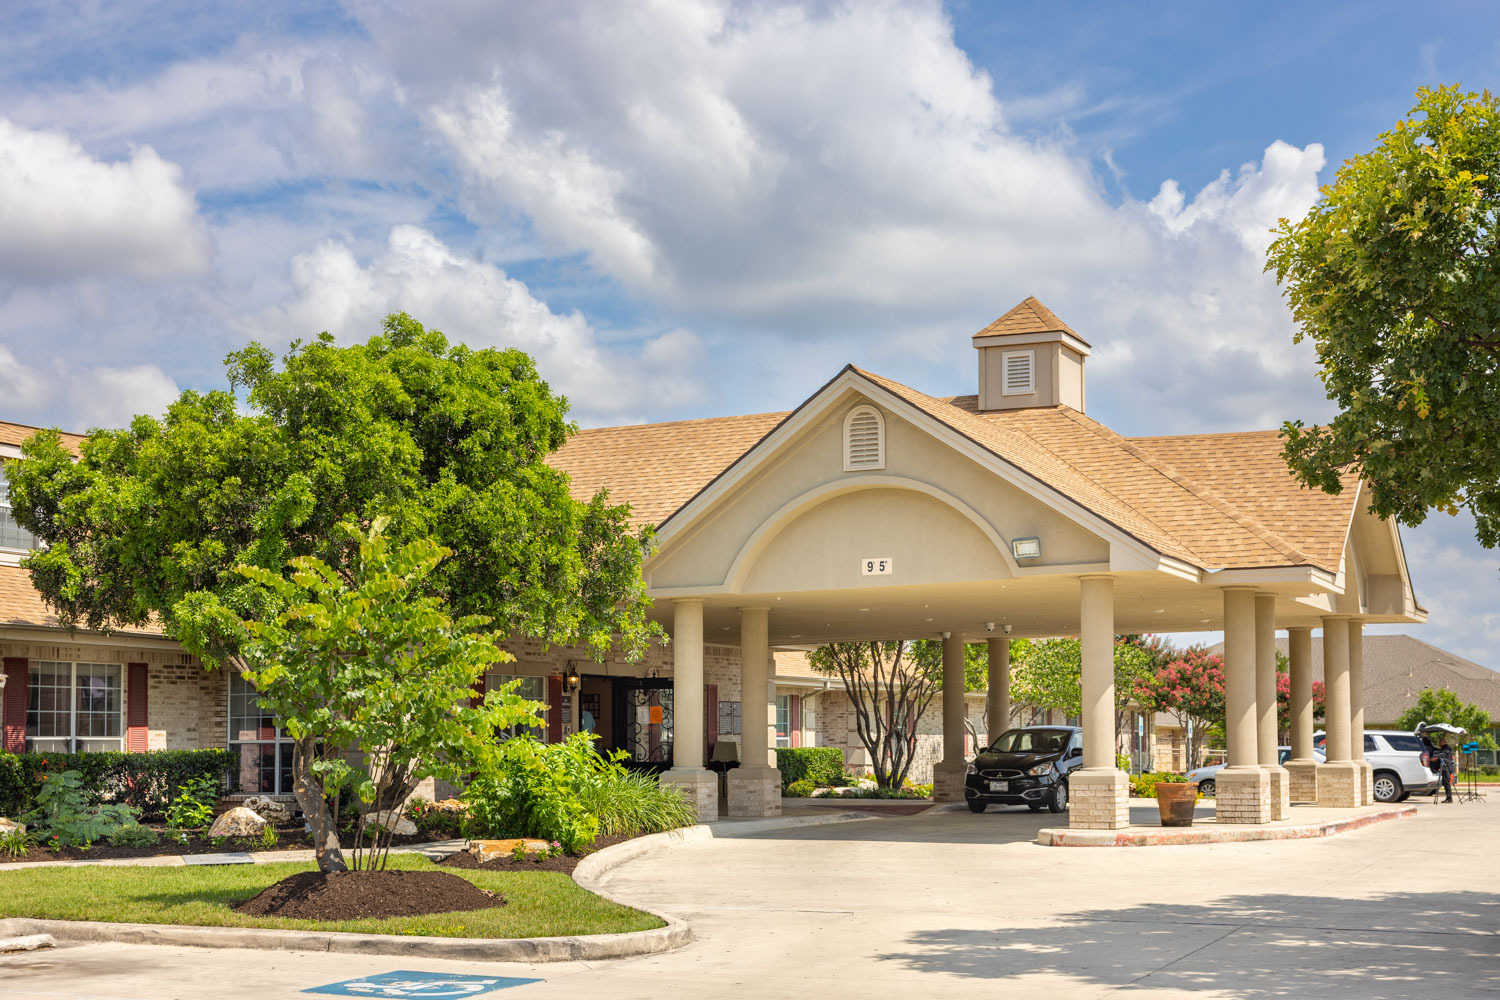
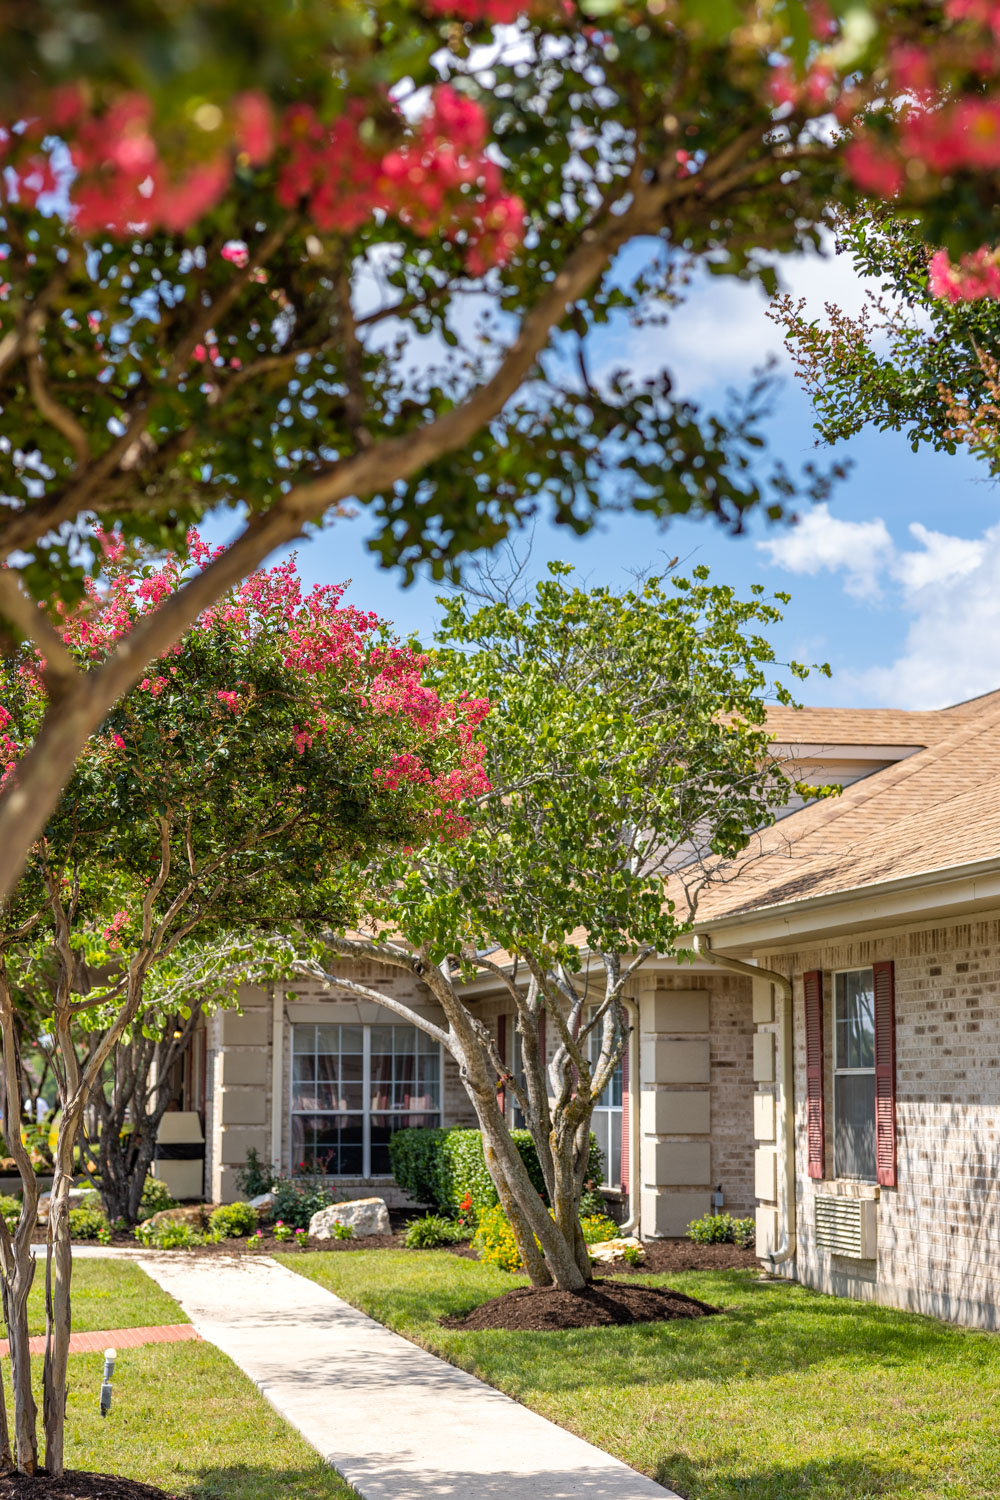


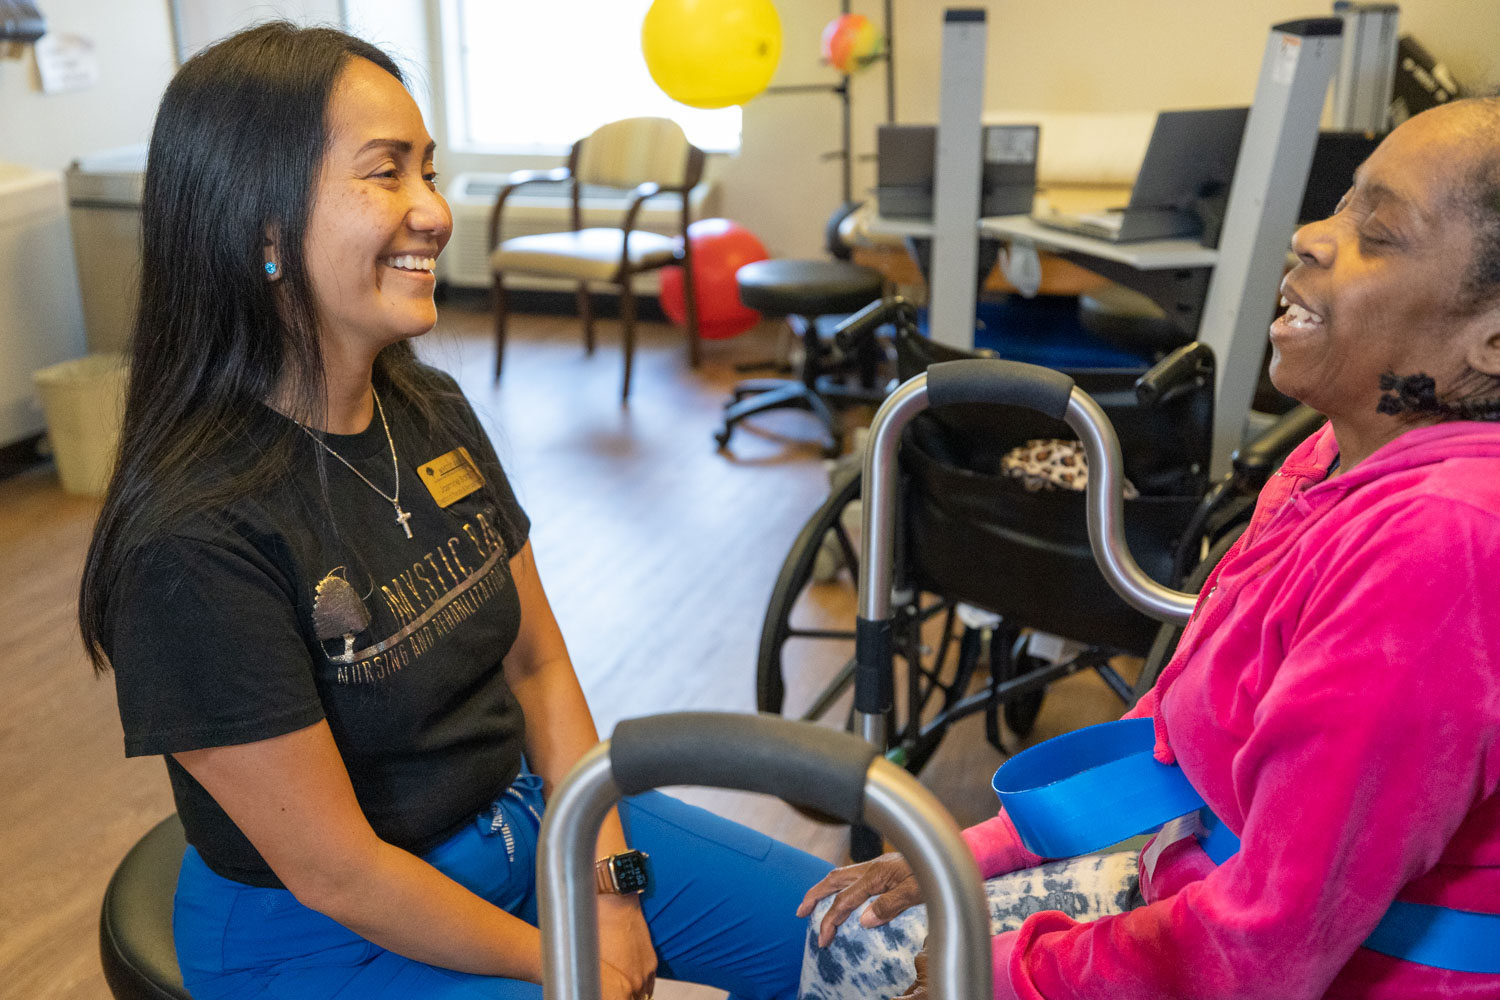


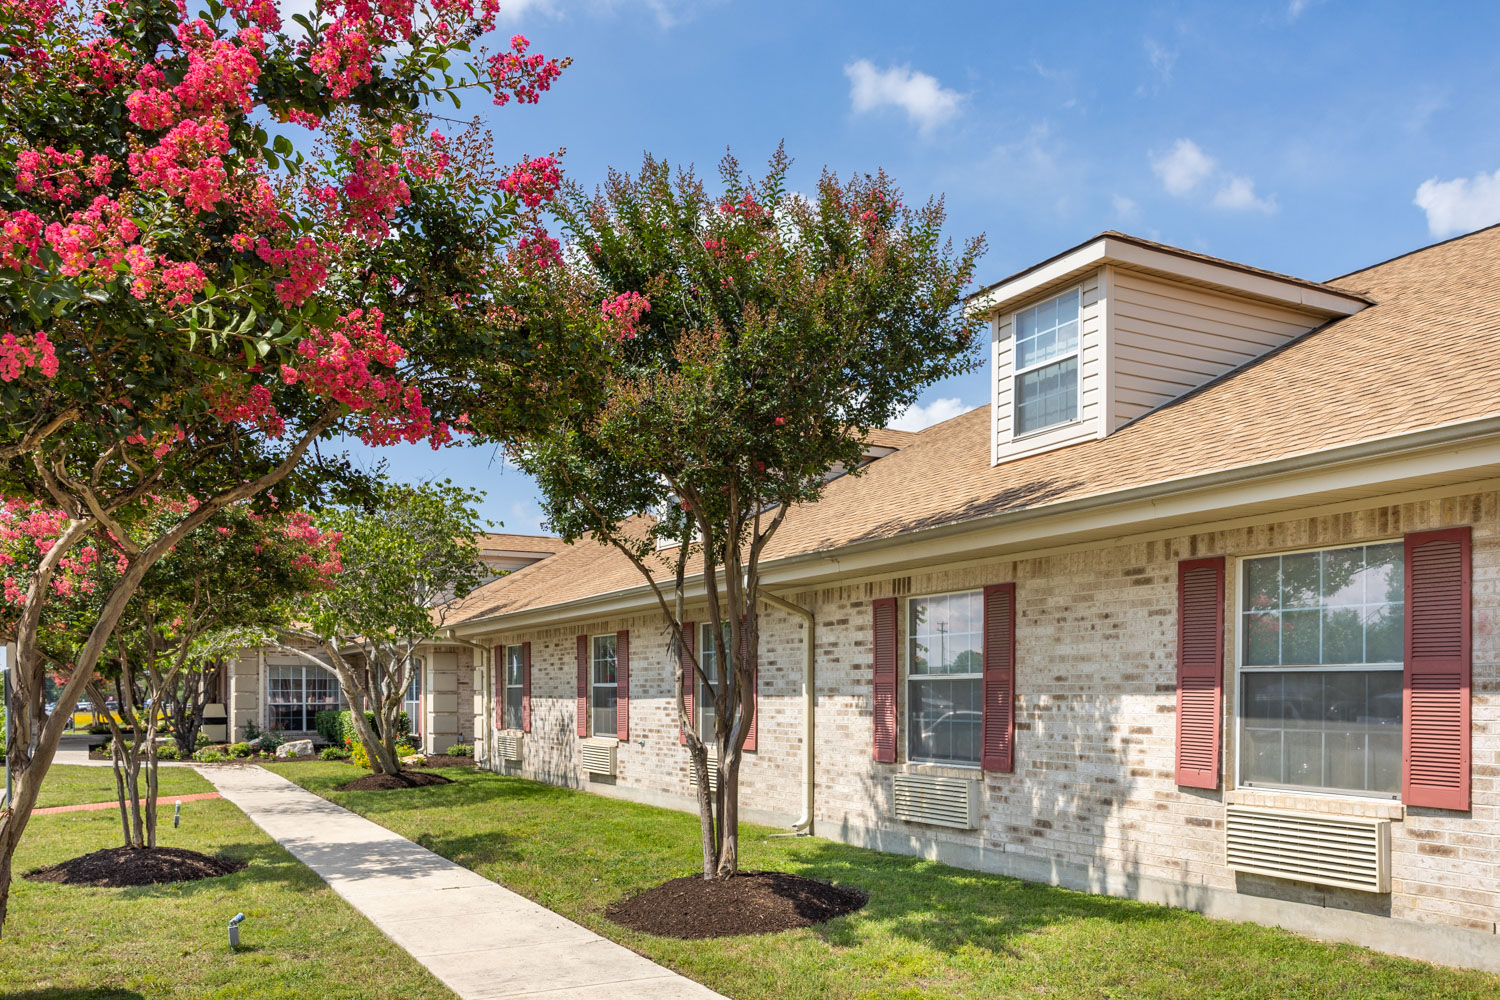


Set in the proximity of Nani Falcone Community Park in Mystic Park, San Antonio, TX, Mystic Park Nursing and Rehabilitation Center is an astounding community that specializes in skilled nursing and in-house therapy. Here, residents are guaranteed to receive the highest quality of care with the community’s comprehensive services tailored to their healthcare needs. With hands-on therapy services, residents can opt for short-term and long-term care depending on their needs.
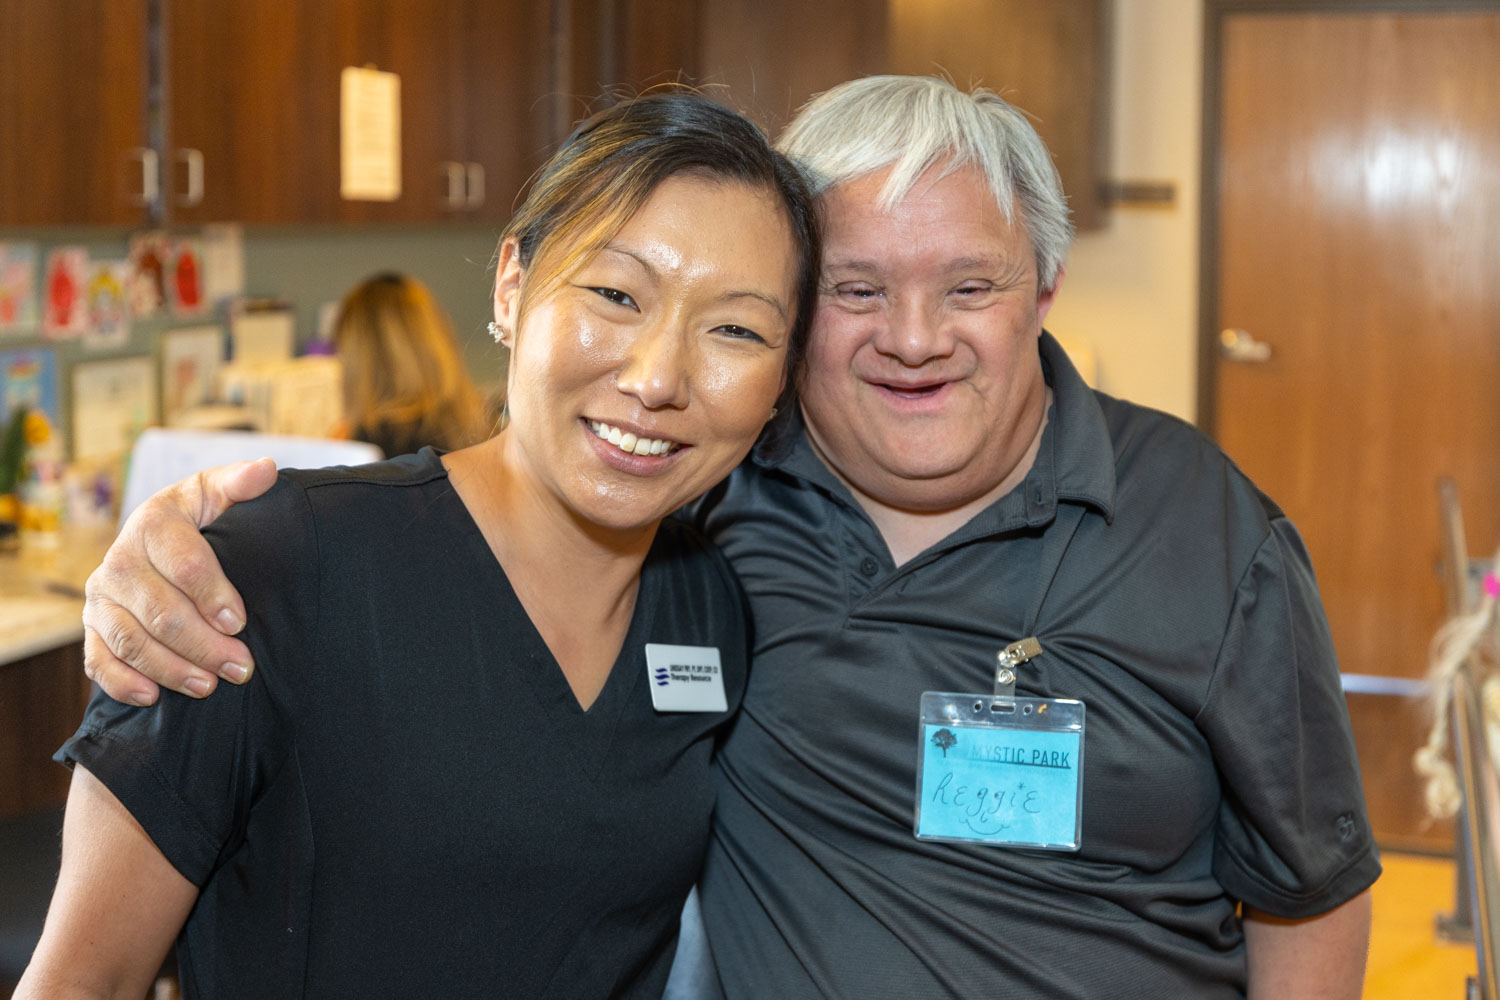
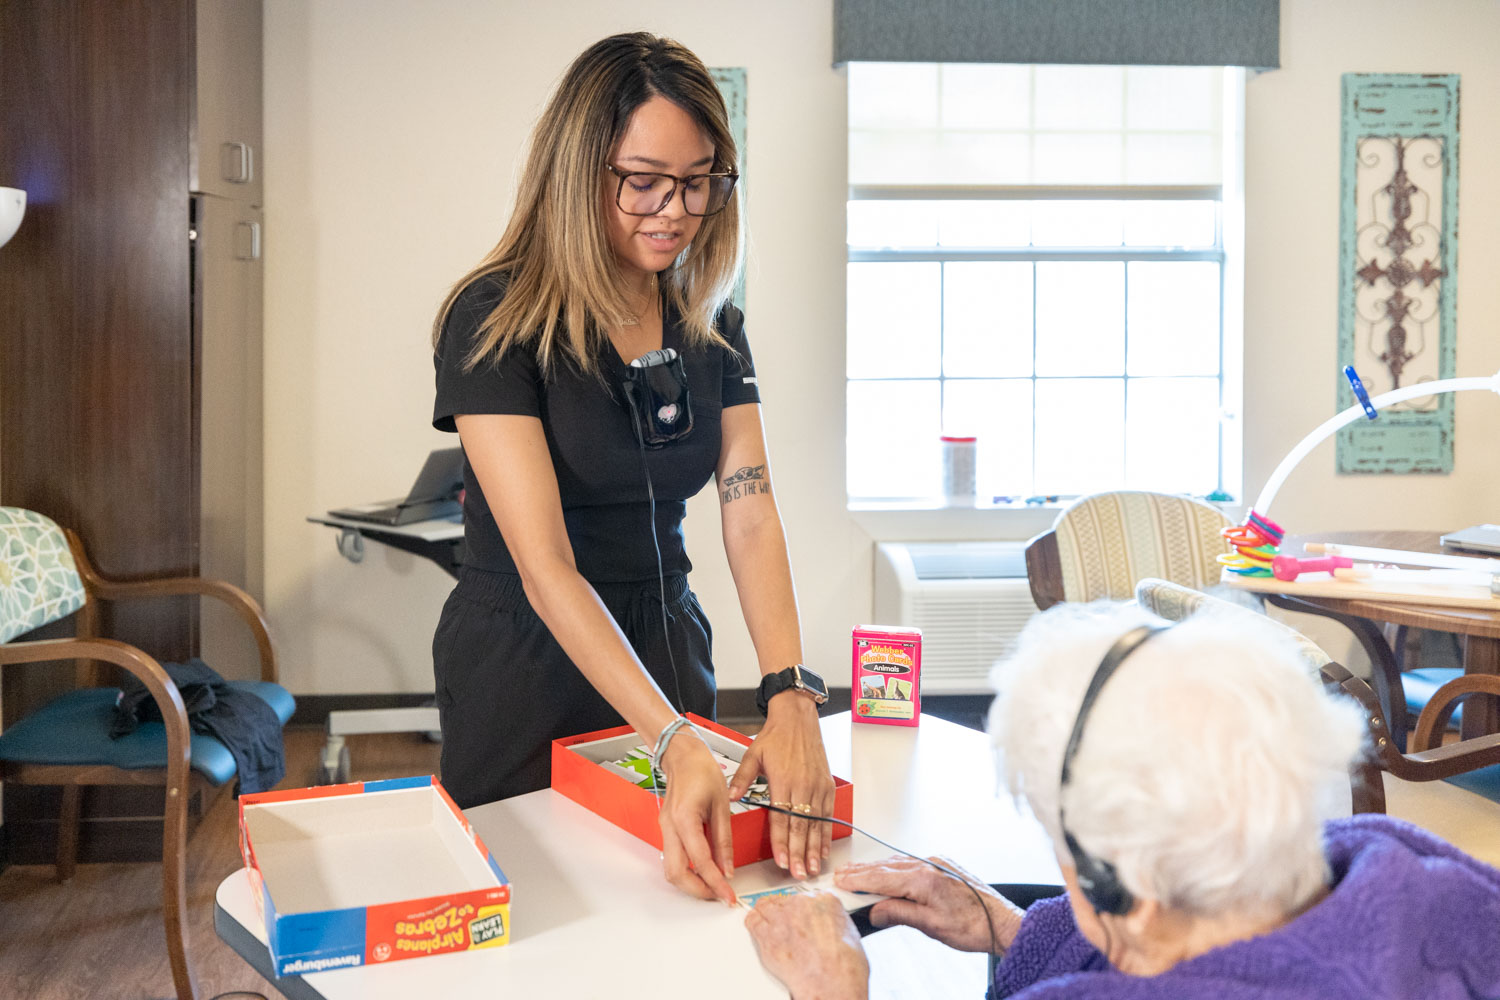
Aside from comprehensive care, the community also conducts fun activities and engaging programs for residents’ enjoyment and wellness. Physical, occupational, and speech therapy are provided to enhance residents’ well-being. With a variety of care provided by a specially trained team including wound care, neurological conditions, lymphedema, and pulmonary programs, residents can rest assured of meeting their needs. The community is great for those who need additional support to live their golden years comfortably.
 Official CMS rating based on health inspections, staffing and quality measures.
Official CMS rating based on deficiencies found during state health inspections.
Official CMS rating based on nurse staffing hours per resident per day.
Official CMS rating based on clinical outcomes for residents.
Average daily nursing hours per resident (adjusted for acuity). Higher values indicate more nursing time per resident.
Hours of care per resident per day, broken down by staff type. Data from CMS Medicare.
Registered nurse hours per resident per day.
Licensed Practical Nurse / Licensed Vocational Nurse hours per resident per day.
Nurse aide hours per resident per day.
Total number of nurse staff hours per resident per day on weekends.
Physical therapist staff hours per resident per day.
Registered nurse hours per resident per day on weekends.
Official CMS rating based on health inspections, staffing and quality measures.
Official CMS rating based on deficiencies found during state health inspections.
Official CMS rating based on nurse staffing hours per resident per day.
Official CMS rating based on clinical outcomes for residents.
Average daily nursing hours per resident (adjusted for acuity). Higher values indicate more nursing time per resident.
Hours of care per resident per day, broken down by staff type. Data from CMS Medicare.
Registered nurse hours per resident per day.
Licensed Practical Nurse / Licensed Vocational Nurse hours per resident per day.
Nurse aide hours per resident per day.
Total number of nurse staff hours per resident per day on weekends.
Physical therapist staff hours per resident per day.
Registered nurse hours per resident per day on weekends.
Offers a balance of services and community atmosphere.
Lower occupancy suggests more openings may be available.
Residents typically stay for brief periods, with frequent admissions and discharges throughout the year.
23% of new residents, usually for short-term rehab.
65% of new residents, often for short stays.
12% of new residents, often for long-term daily care.
The portion of the home's budget spent on staff, including nurses, caregivers, and other employees who support care and operations.
All remaining costs needed to run the home, such as food, utilities, building maintenance, supplies and administrative expenses.
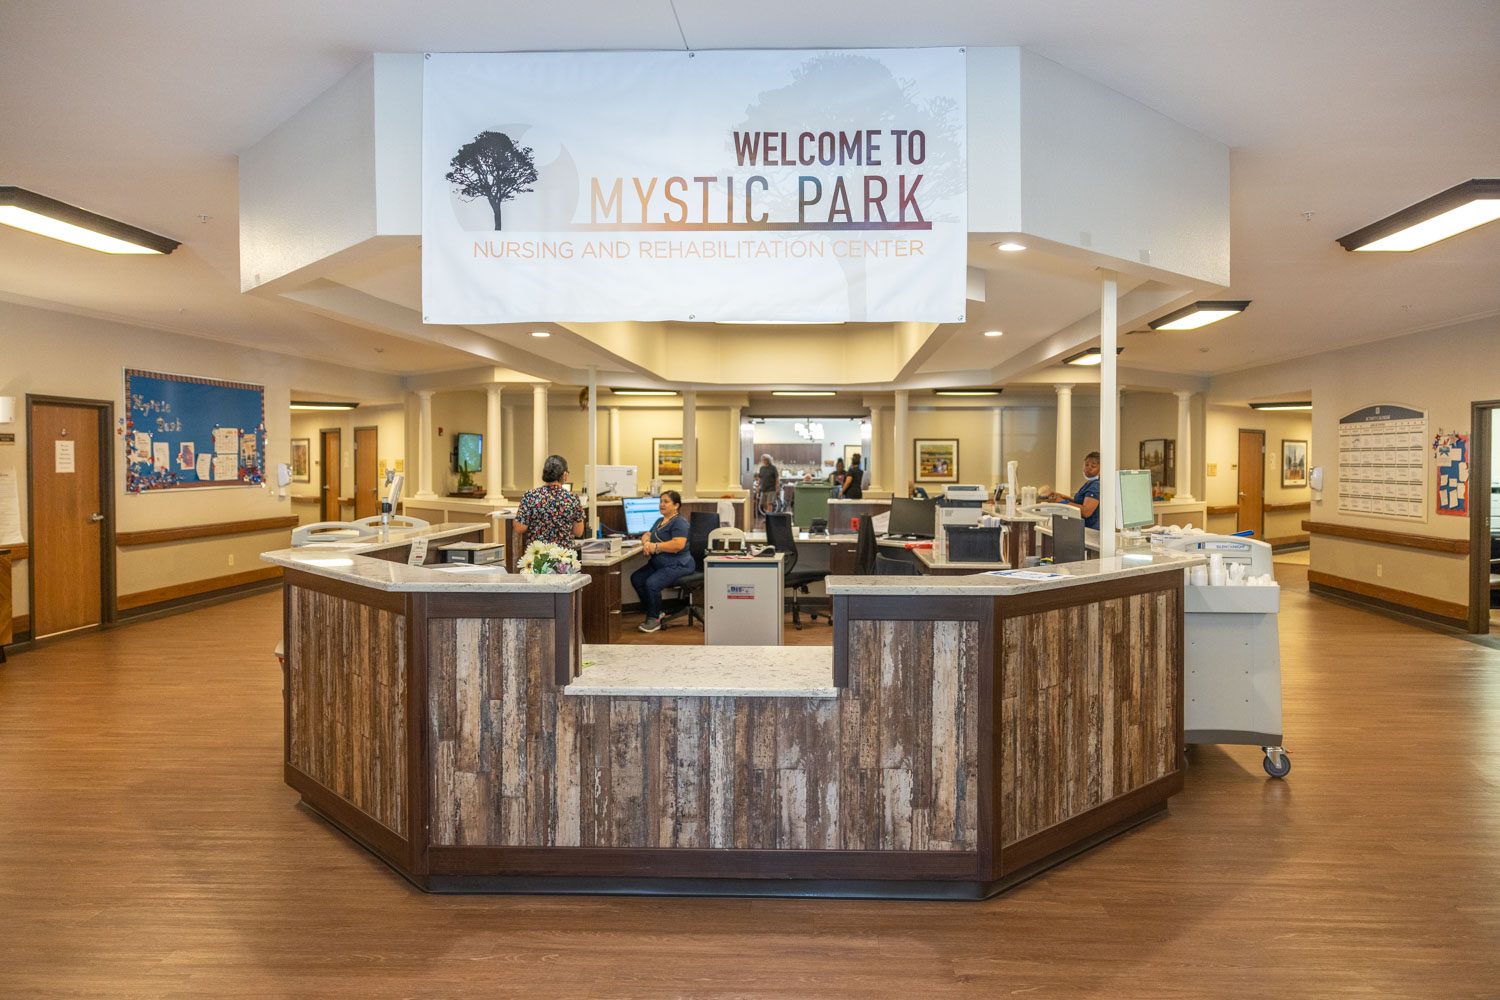
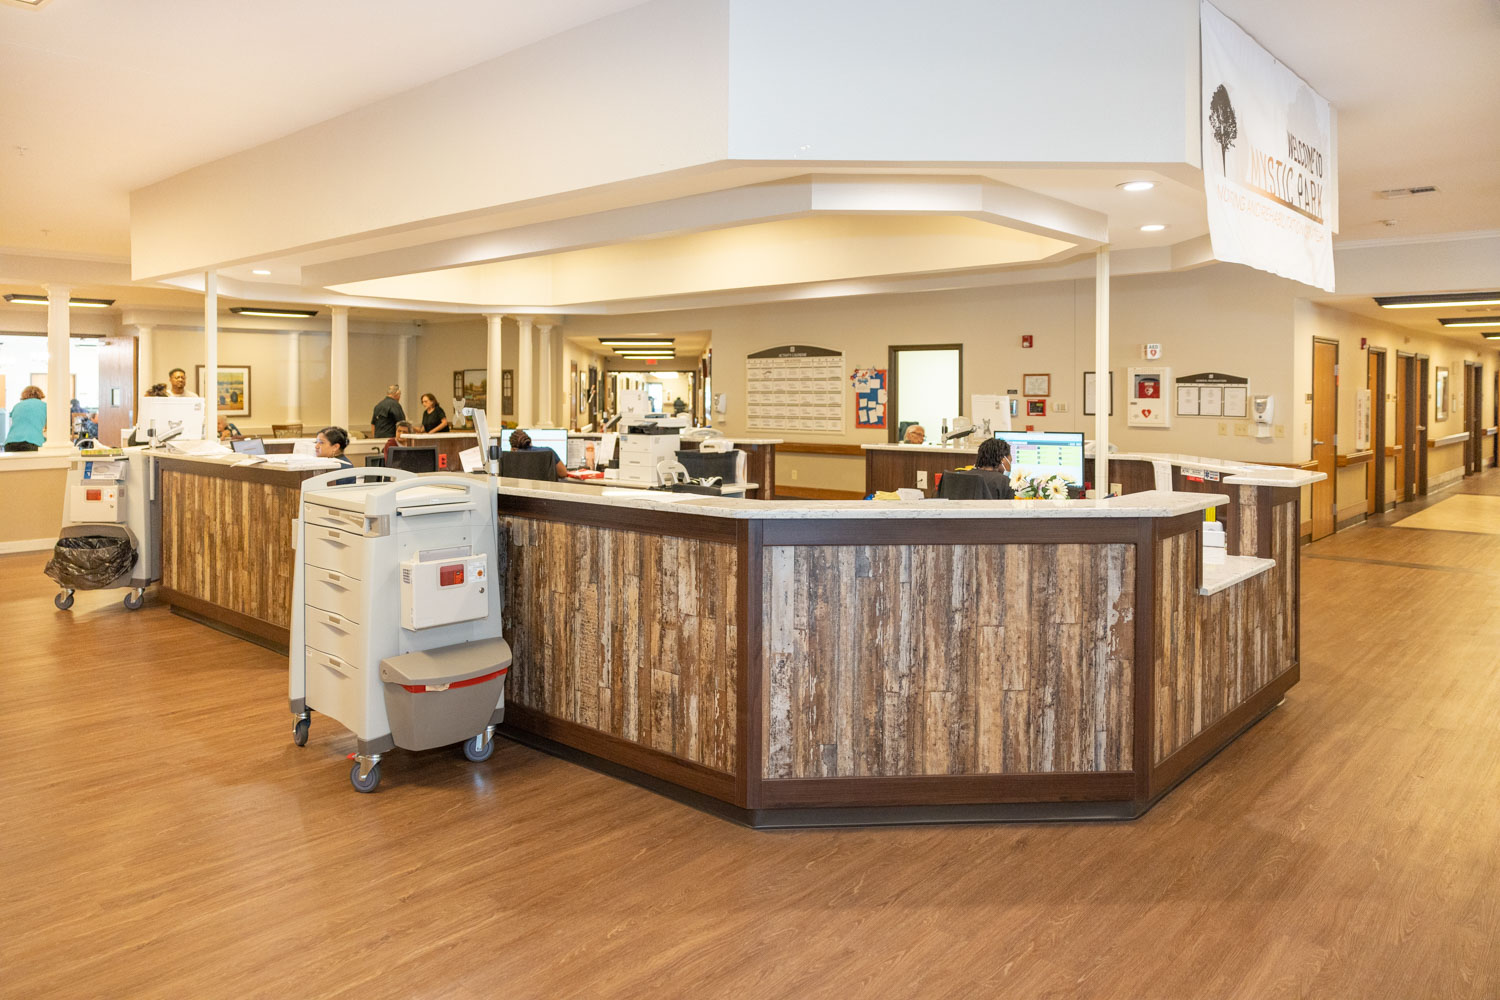
Mystic Park Nursing and Rehabilitation Center is administrated by OSIRIS WHITE.
Key information about the people who lead and staff this community.
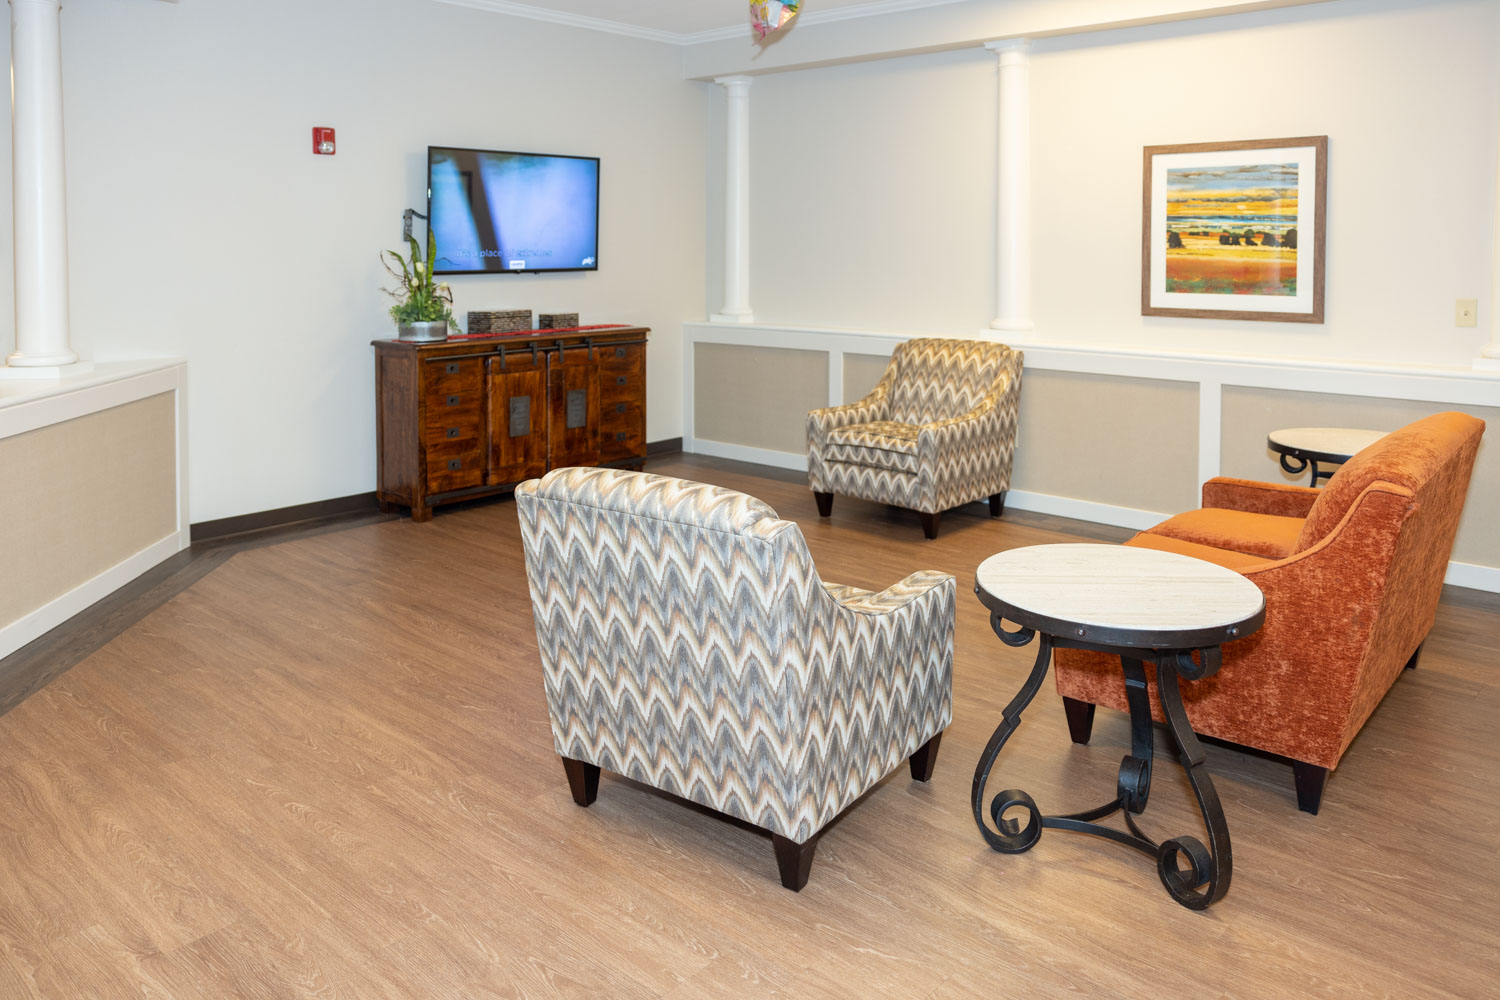
Housing Options: Private / Semi-Private Rooms
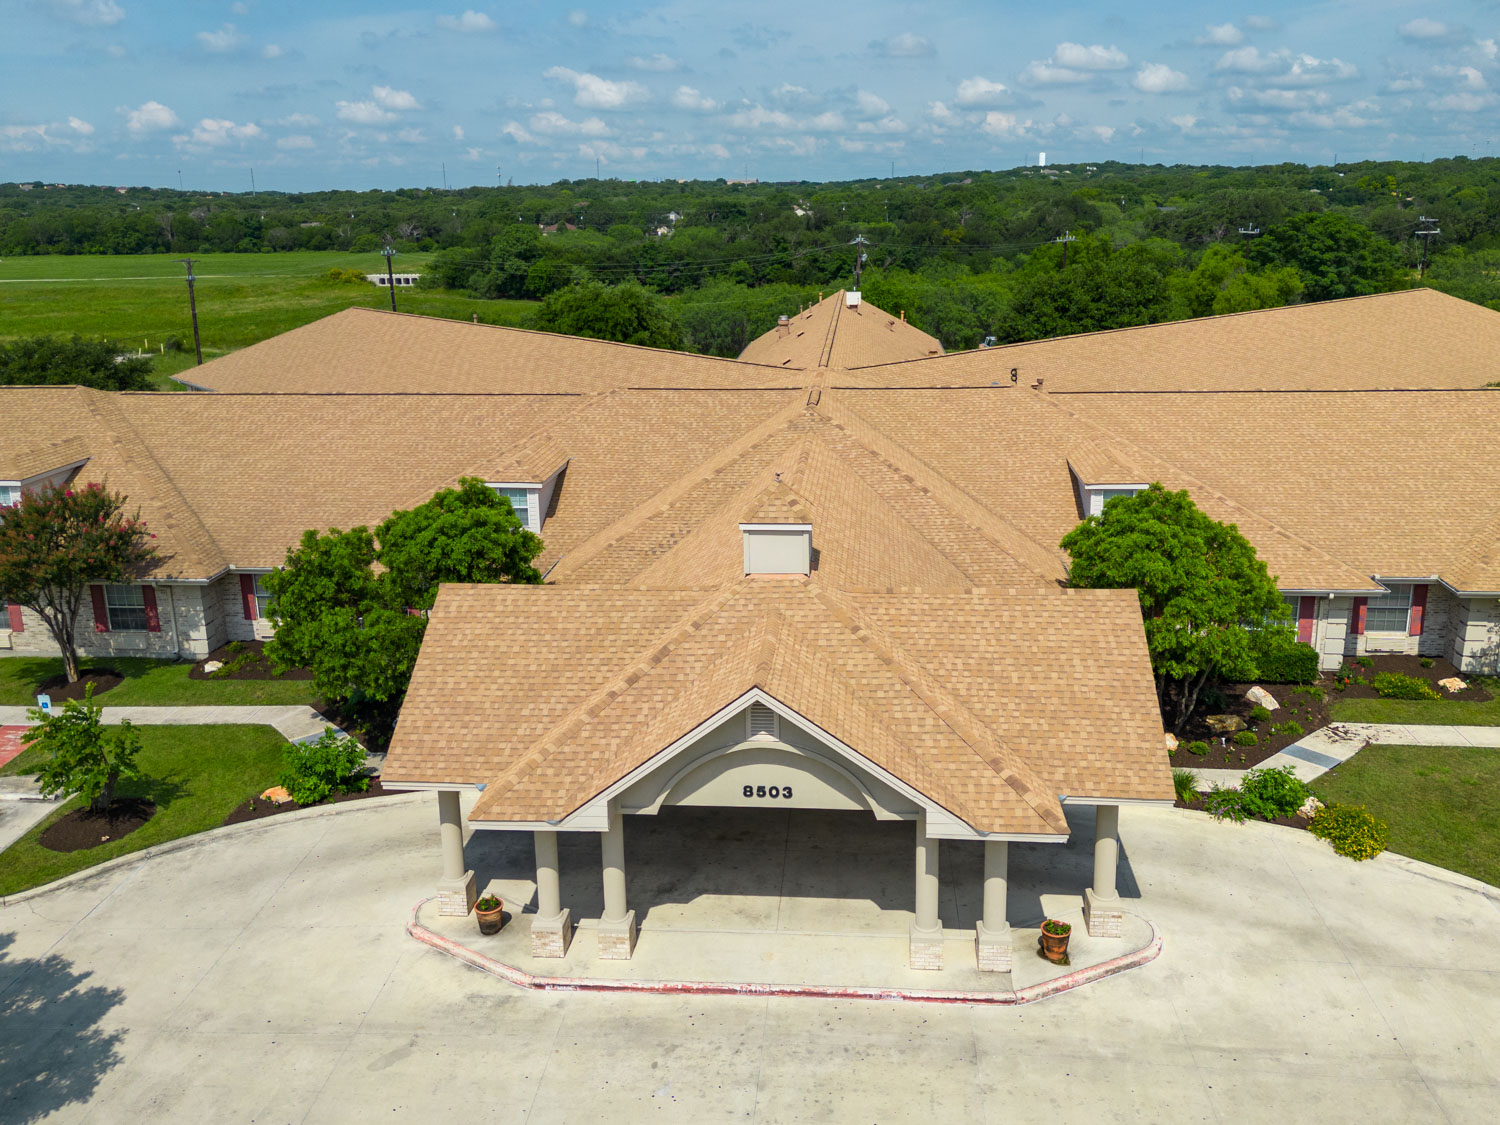
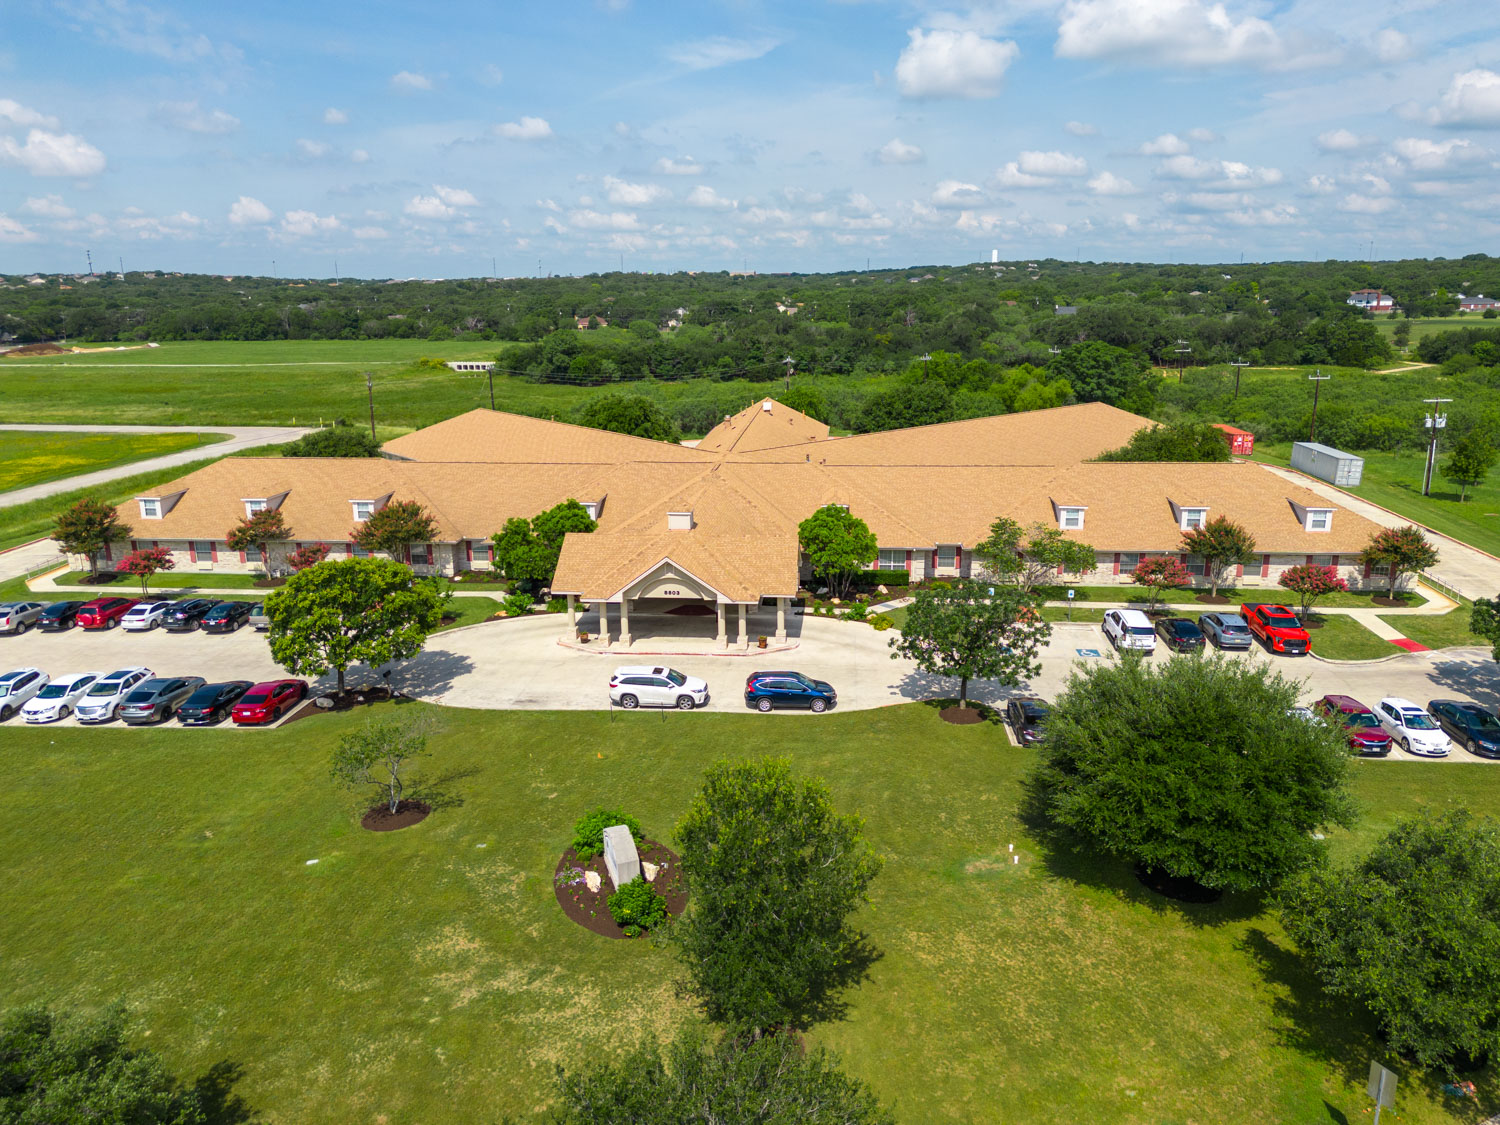
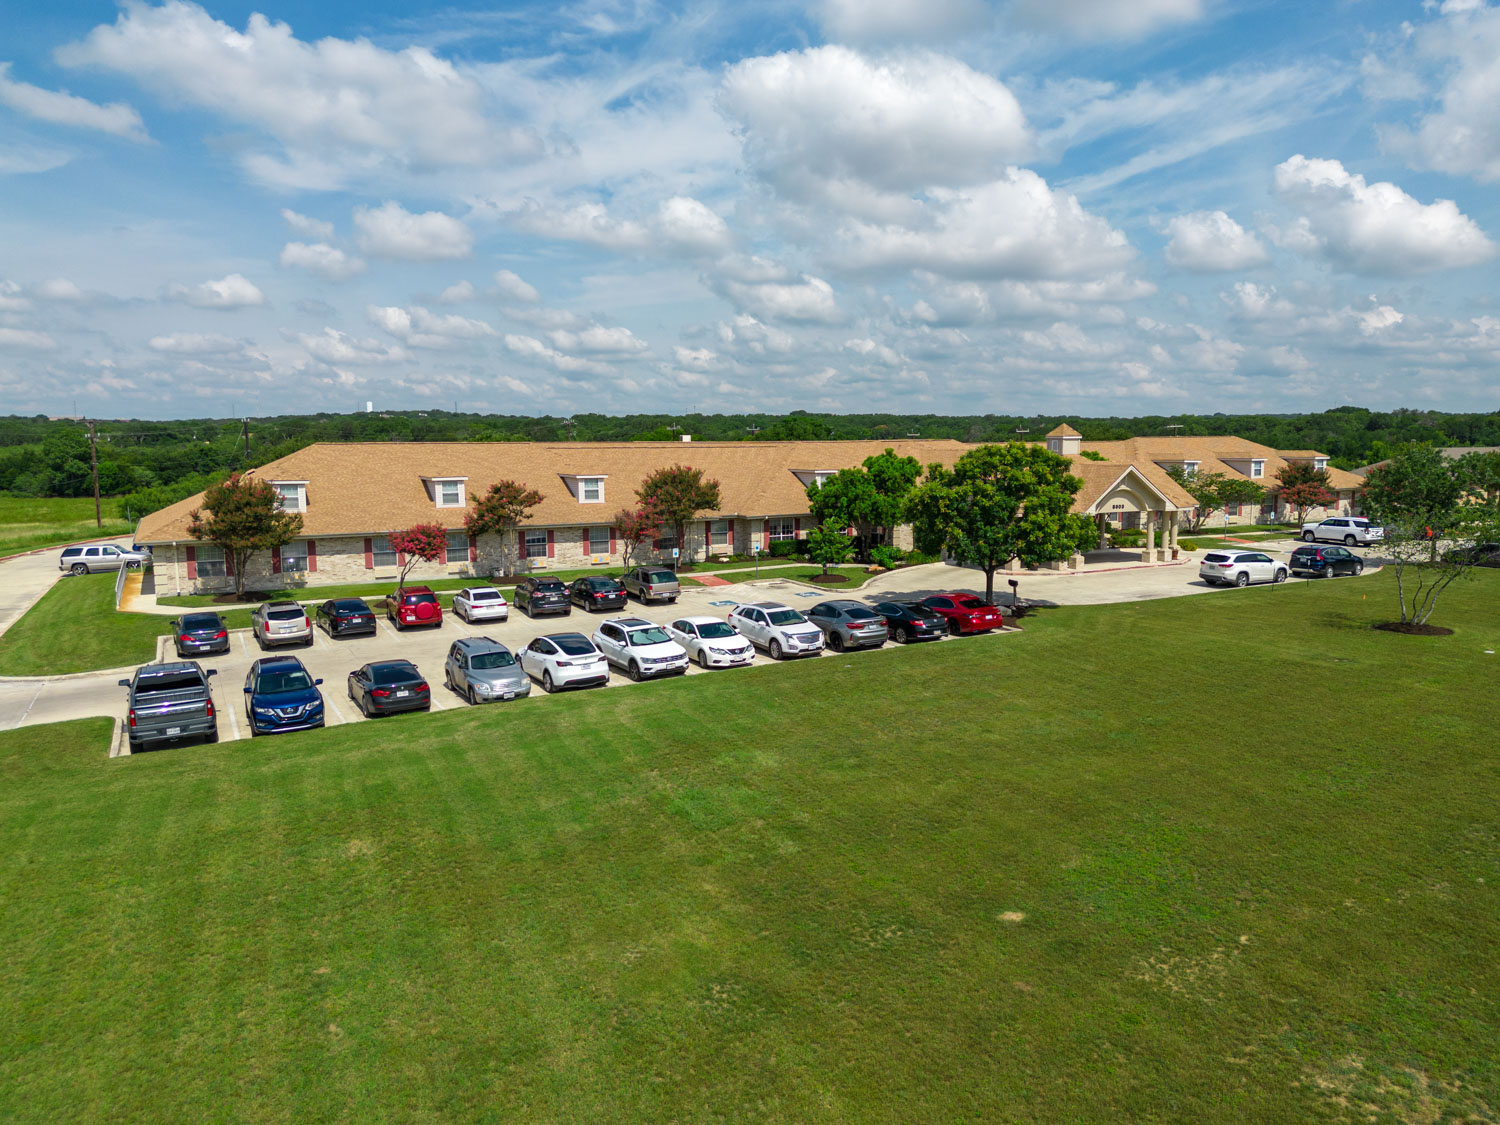
Building Type: Single-story
Dining Services
Housekeeping Services
Transportation Services
Recreational Activities
Exercise Programs
Ways to qualify for care at this community, including accepted programs and payment options.
This facility is certified for eligible Medicaid services.
This facility is certified for eligible Medicare services.
Nursing Homes 24/7 care needed
Hospice Care
Nursing Homes 24/7 care needed
Respite Care
Nursing Homes 24/7 care needed
Hospice Care
Nursing Homes 24/7 care needed
Respite Care
Nursing Homes 24/7 care needed
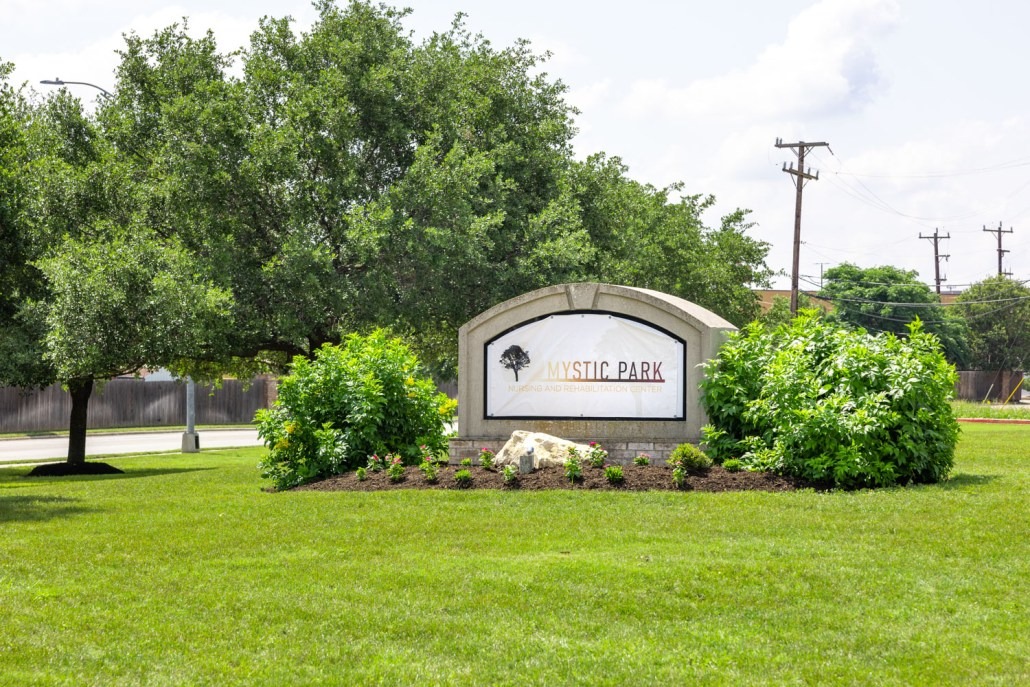
 Mystic Park Nursing and Rehabilitation Center
 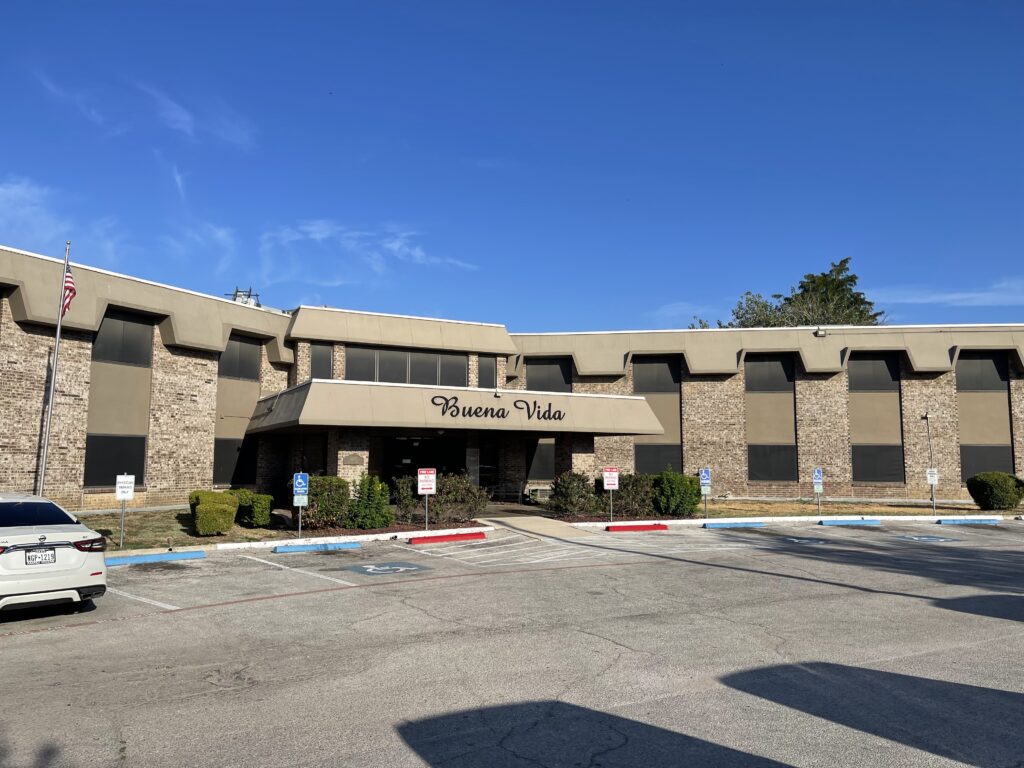 Buena Vida Nursing and Rehab Center San Antonio
 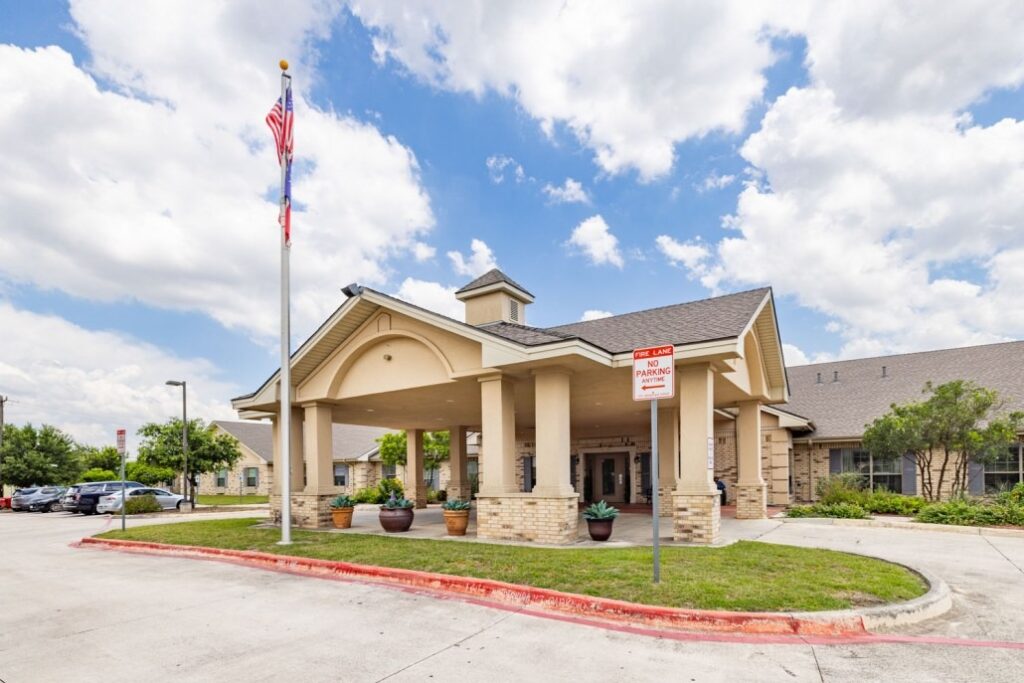 Westover Hills Rehabilitation and Healthcare Center
 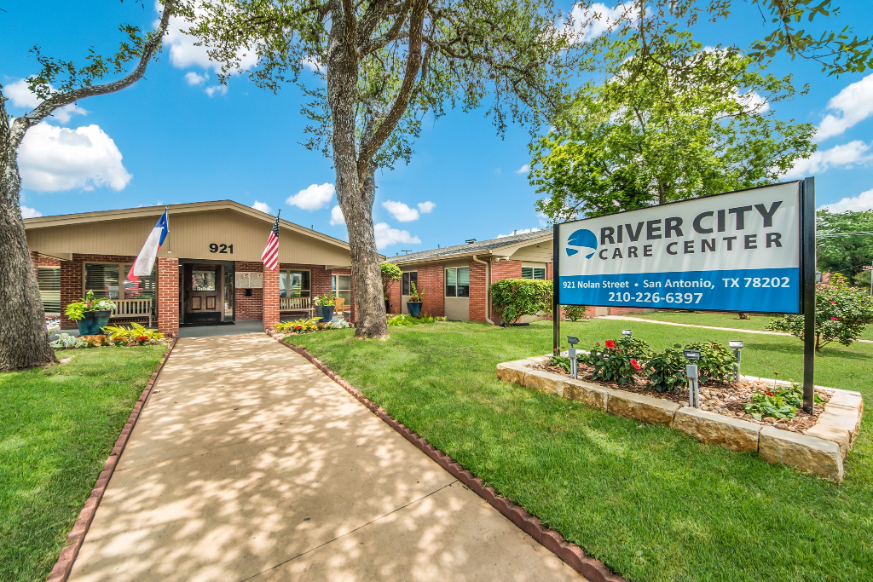 River City Care Center
 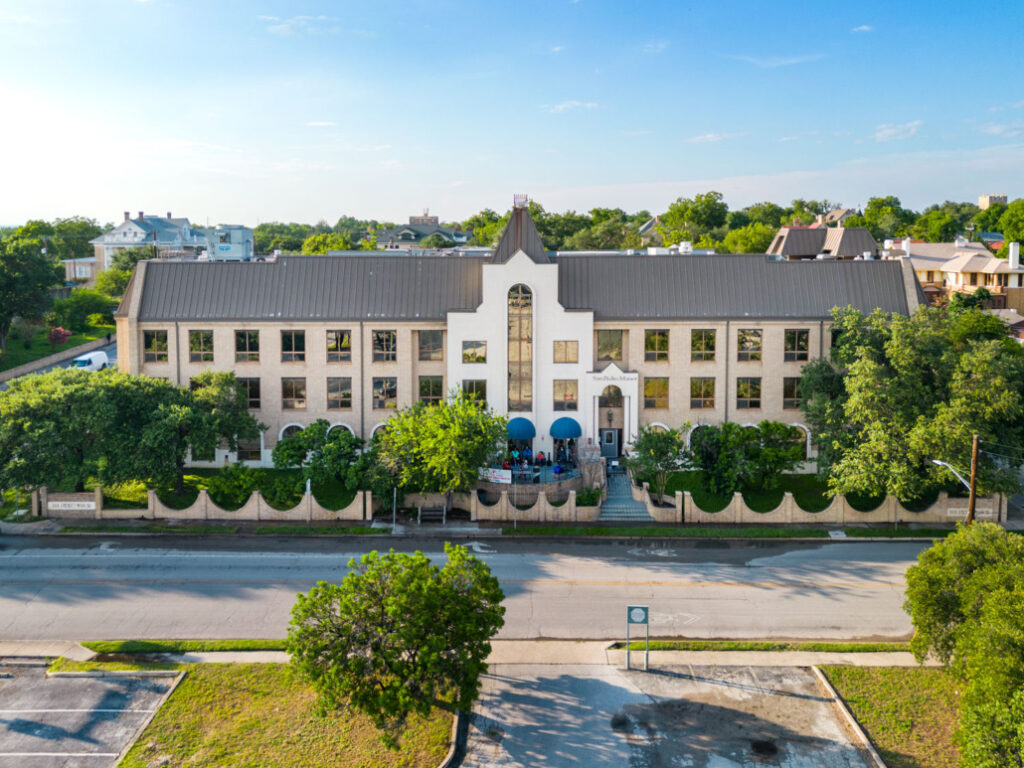 San Pedro Manor
![]() 12 miles from city center
12 miles from city center
![]() 8503 Mystic Park, San Antonio, TX 78254
8503 Mystic Park, San Antonio, TX 78254
Add your location
Source: CMS Payroll-Based Journal (Q2 2025)
| Role ⓘ | Count ⓘ | Avg Shift (hrs) ⓘ | Uses Contractors? ⓘ |
|---|---|---|---|
| Registered Nurse | 12 | 9.3 | No |
| Licensed Practical Nurse | 18 | 7.8 | No |
| Certified Nursing Assistant | 48 | 8.2 | No |
| Role ⓘ | Employees ⓘ | Contractors ⓘ | Total Staff ⓘ | Total Hours ⓘ | Days Worked ⓘ | % of Days ⓘ | Avg Shift (hrs) ⓘ |
|---|---|---|---|---|---|---|---|
| Certified Nursing Assistant | 48 | 0 | 48 | 16,501 | 91 | 100% | 8.2 |
| Licensed Practical Nurse | 18 | 0 | 18 | 4,485 | 91 | 100% | 7.8 |
| Registered Nurse | 12 | 0 | 12 | 4,469 | 91 | 100% | 9.3 |
| RN Director of Nursing | 9 | 0 | 9 | 3,352 | 68 | 75% | 8.9 |
| Speech Language Pathologist | 8 | 0 | 8 | 2,738 | 91 | 100% | 7.1 |
| Medication Aide/Technician | 7 | 0 | 7 | 2,126 | 91 | 100% | 8 |
| Physical Therapy Aide | 11 | 0 | 11 | 2,056 | 90 | 99% | 7.2 |
| Physical Therapy Assistant | 5 | 0 | 5 | 1,911 | 78 | 86% | 8.3 |
| Qualified Social Worker | 7 | 0 | 7 | 1,563 | 76 | 84% | 7.9 |
| Dental Services Staff | 5 | 0 | 5 | 1,491 | 65 | 71% | 7.4 |
| Other Dietary Services Staff | 4 | 0 | 4 | 1,159 | 88 | 97% | 8 |
| Respiratory Therapy Technician | 4 | 0 | 4 | 1,095 | 82 | 90% | 6.3 |
| Nurse Aide in Training | 3 | 0 | 3 | 634 | 45 | 49% | 8.1 |
| Administrator | 1 | 0 | 1 | 520 | 65 | 71% | 8 |
| Nurse Practitioner | 1 | 0 | 1 | 468 | 52 | 57% | 9 |
| Clinical Nurse Specialist | 4 | 0 | 4 | 108 | 13 | 14% | 7.2 |
Texas average 7.4
Last Health inspection on Jan 2025
Health citations are formal notices following inspections when they fail to comply with safety and care standards.
17 of 21 citations resulted from standard inspections; and 4 of 21 resulted from complaint investigations.
Texas average: 2
Texas average: 0.4
Data sourced from CMS Health Deficiencies reports. Citation severity codes range from A (least serious) to L (most serious). Immediate Jeopardy (J-L) citations indicate situations where the facility's noncompliance has placed residents at risk of death or serious harm.
Source: CMS Long-Term Care Facility Characteristics (Data as of Jan 2026)
Active councils help families stay involved in care decisions and facility operations.
These measures show how residents usually do over time at this home, based on health outcomes and preventive care.
Texas average: 8.6
Texas average: 16.0
Texas average: 16.2%
Texas average: 16.2%
Texas average: 15.7%
Texas average: 3.2%
Texas average: 4.4%
Texas average: 0.8%
Texas average: 3.5%
Texas average: 2.9%
Texas average: 97.3%
Texas average: 97.9%
Texas average: 2.13
Texas average: 2.07
Texas average: 90.4%
Texas average: 1.4%
Texas average: 88.0%
Texas average: 25.9%
Texas average: 12.0%
Texas average: 0.8%
Texas average: 53.7%
Texas average: 50.6%
Quality measures are calculated from Minimum Data Set (MDS) assessments. For most measures, lower percentages indicate better care quality.
Federal penalties imposed by CMS for regulatory violations, including civil money penalties (fines) and denials of payment for new Medicare/Medicaid admissions.
Source: CMS Penalties Database (Data as of Jan 2026)
Texas average: $80K
Texas average: 2.5
Texas average: 0.2
Penalties are imposed by CMS for violations of federal nursing home regulations.
Last updated: Jan 2026
Historical financial and operational data for Mystic Park Nursing and Rehabilitation Center based on CMS SNF Cost Reports.
Loading trend charts...
Care Cost Calculator: See Prices in Your Area
Nursing Home Data Explorer
Don’t Wait Too Long: 7 Red Flag Signs Your Parent Needs Assisted Living Now
The True Cost of Assisted Living in 2025 – And How Families Are Paying For It
Understanding Senior Living Costs: Pricing Models, Discounts & Financial Assistance

We help families find affordable senior communities and unlock same day discounts, Medicaid, and Medicare options tailored to your needs.
Contact us Today
Touring a community? Use this expert-backed checklist to stay organized, ask the right questions, and find the perfect fit.
We'll send you a PDF version of the touring checklist.


