Westover Hills Rehabilitation and Healthcare Center

Nursing Home · Bexar County, TX
CMS overall rating Info The Overall CMS Rating is scored from 1 to 5 stars and combines results from health inspections, staffing levels, and quality measures. Health inspections carry the most weight. Staffing and quality scores can increase or decrease the final rating based on performance compared to state and national standards.
Westover Hills Rehabilitation and Healthcare Center

Nursing Home in Bexar County

CMS overall rating Info The Overall CMS Rating is scored from 1 to 5 stars and combines results from health inspections, staffing levels, and quality measures. Health inspections carry the most weight. Staffing and quality scores can increase or decrease the final rating based on performance compared to state and national standards.
Calculator: See prices in your area
Westover Hills Rehabilitation and Healthcare Center accepts Medicare, Medicaid, and private pay.

Overview of Westover Hills Rehabilitation and Healthcare Center

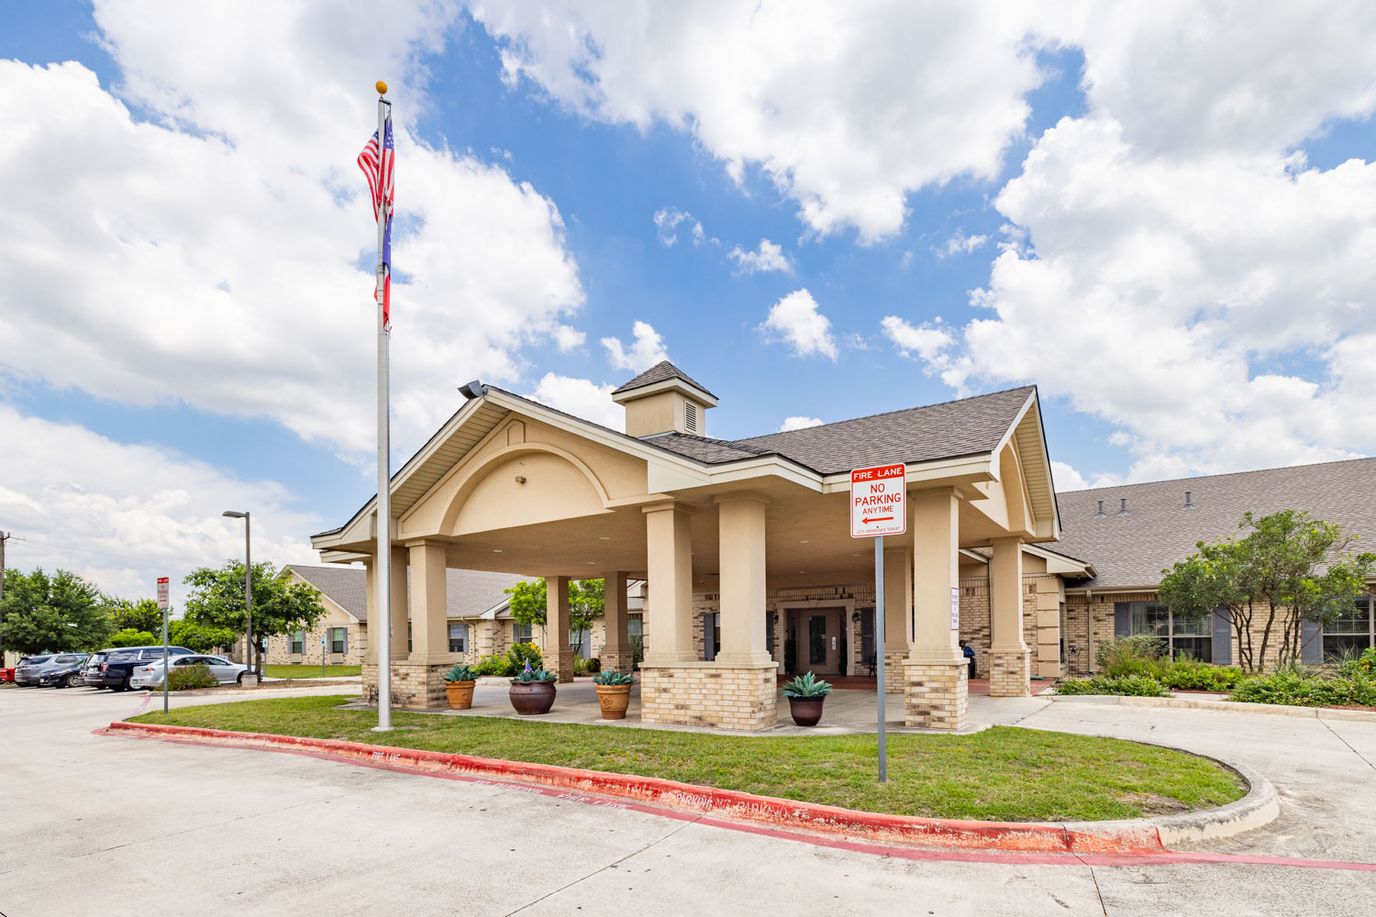
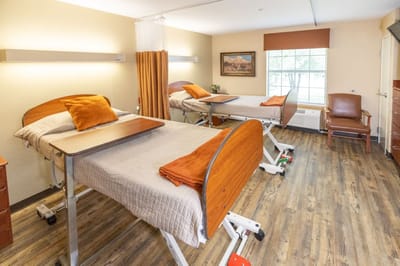
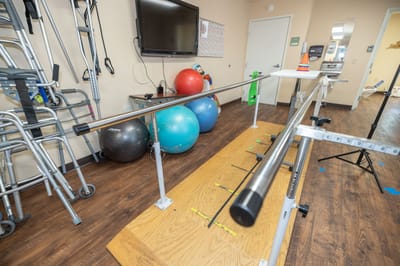
Conveniently nestled in San Antonio, TX, Westover Hills Rehabilitation and Healthcare Center is a warm and dependable community designed to support residents with their recovery. They collaborate closely with residents, their families, and healthcare providers in creating an effective care plan tailored to their needs. The community also features an in-house therapy team that uses advanced therapeutic approaches to help residents regain their strength and overall functionality.

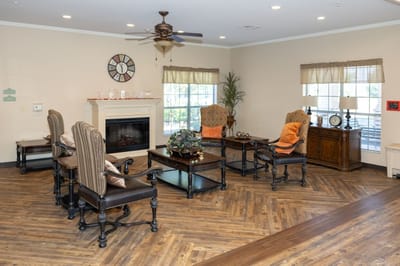
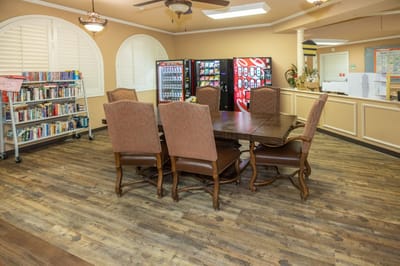
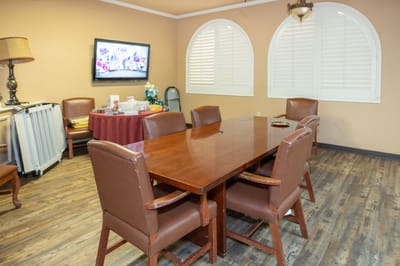
Residents’ schedules are packed with an array of fun and enriching activities tailored to their preferences and skills for an active lifestyle. In addition to nutritionally balanced meals, the community provides the convenience of housekeeping services for residents’ comfort. Here, residents are guaranteed to maintain their highest functionality to continue enjoying life.

Quality ratings

Measured by Centers for Medicare & Medicaid Services (CMS)

Overall rating Info The Overall CMS Rating combines results from health inspections, staffing levels and quality measures. Health inspections carry the most weight. Staffing and quality scores can increase or decrease the final rating based on performance compared to state and national standards.
▼ 28.4% Below TX avg.
Health Inspection Info Based on the results of the facility's three most recent standard inspections and any complaint investigations. CMS reviews the number, scope, and severity of deficiencies, with more recent findings weighted more heavily.
▼ 27.6% Below TX avg.
Staffing Info Measures average nursing staff hours per resident per day, including Registered Nurses (RNs) and total nursing staff. Ratings are adjusted based on the level of care residents require and are compared to state and national benchmarks.
▲ 41.4% Above TX avg.
Quality Measures Info Based on clinical and physical health indicators reported to CMS, such as hospital readmissions, falls, pressure ulcers, and improvements in mobility. These measures reflect how well residents' health needs are being managed.
▲ 6.5% Above TX avg.

Staffing hours breakdown

Info Daily nursing hours per resident by staff type, reported to CMS. Higher is generally better — compare this facility to state and national averages to see where staffing stands.

Hours per resident per day — compared to Texas state averages

Total nursing care / resident Info This home is ranked 72nd out of 240 homes in Texas.

Total adjusted nursing hours per resident per day, combining RN, LPN, and aide time. CMS adjusts this for case-mix so facilities can be fairly compared.
3h 52m per day
Rank #72 / 240Nurse hours — state benchmarkedThis home is ranked 72nd out of 240 homes in Texas.Shows adjusted nurse hours per resident per day benchmarked to the Texas average, with a ranking across 240 Texas SNFs. More hours mean more direct care. The national average is about 3.5 hrs; below 3.0 is a red flag.
This facility Texas avg (3h 38m per day)
vs Texas avg
+7%

1 of 6 metrics below state avg

Standout metric Physical Therapist is +75% above state avg
Staff type Hours / day vs state avg
Registered Nurse (RN) Info RNs hold the highest nursing license and can assess residents, interpret test results, and direct care plans. More RN hours per day often signals stronger clinical oversight and faster response to health changes. 32m per day ▲ 23% State avg: 26m per day · National avg: 41m per day
LPN / LVN Info Licensed Practical Nurses (LPNs) or Licensed Vocational Nurses (LVNs) deliver routine hands-on care — medication administration, wound dressing, and monitoring vital signs. They work under RN supervision and make up a large share of daily bedside care. 1h 1m per day ▲ 7% State avg: 57m per day · National avg: 52m per day
Nurse Aide Info Certified Nurse Aides (CNAs) provide the most direct day-to-day assistance: bathing, dressing, feeding, and mobility. Nurse aide hours are typically the largest staffing category and directly affect residents' quality of life. 1h 53m per day ▼ 7% State avg: 2h 1m per day · National avg: 2h 21m per day
Total Nursing (Weekend) Info Combined nursing hours (RN + LPN + Nurse Aide) per resident per day on weekends. Staffing often drops on weekends — this figure reveals whether the facility maintains adequate coverage outside of weekday hours. 3h 15m per day ▲ 9% State avg: 2h 59m per day · National avg: 3h 26m per day
Physical Therapist Info Hours per resident per day provided by licensed Physical Therapists (PTs) or PT Assistants. PT services help residents recover mobility after injury or illness and are especially important for post-acute (short-stay) rehabilitation. 7m per day ▲ 75% State avg: 4m per day · National avg: 4m per day
RN (Weekend) Info Registered nurse hours specifically on weekends. Facilities sometimes reduce RN presence on Saturdays and Sundays — a low weekend RN figure compared to weekday hours can indicate reduced clinical oversight when most administrative staff are absent. 35m per day ▲ 67% State avg: 21m per day · National avg: 29m per day

Capacity and availability

This home usually has availability

Occupancy lower than 85% suggests more openings may be available.

Higher occupancy than the Texas average: 63.5%
Occupancy rate 81% Rank #59 / 252Occupancy rate — state benchmarkedThis home is ranked 59th out of 252 homes in Texas.Shows this facility's occupancy rate versus the Texas average, with its statewide rank out of 252. Higher occupancy signals strong local demand and financial stability.
Avg. Length of Stay 73 days
Occupancy rate
81% Rank #59 / 252Occupancy rate — state benchmarkedThis home is ranked 59th out of 252 homes in Texas.Shows this facility's occupancy rate versus the Texas average, with its statewide rank out of 252. Higher occupancy signals strong local demand and financial stability.
Avg. Length of Stay
73 days

Who this home usually serves

TYPE OF STAY

Primarily short stays

Residents typically stay for brief periods, with frequent admissions and discharges throughout the year.

Breakdown by payment type

Medicare

19% of new residents, usually for short-term rehab.

Typical stay 27 days

Private pay

75% of new residents, often for short stays.

Typical stay 1 - 2 months

Medicaid

5% of new residents, often for long-term daily care.

Typical stay 1 - 2 years

Finances and operations

Privately-owned community
Operated by a business corporation.
Home revenue
$15.3M
Profit
$1.2M
Privately-owned community Operated by a business corporation.
Home revenue
$15.3M Rank #35 / 252Revenue — state benchmarkedThis home is ranked 35th out of 252 homes in Texas.Shows this facility's annual revenue compared to the Texas SNF average. Higher revenue generally means more resources for staffing and capital — read alongside Payroll %.
Profit
$1.2M
Payroll costs Info The portion of the home's budget spent on staff, including nurses, caregivers, and other employees who support care and operations. Rank #40 / 252Payroll — state benchmarkedThis home is ranked 40th out of 252 homes in Texas.Shows total annual staff payroll benchmarked to the Texas average. Higher payroll investment relative to peers often signals better staffing and less reliance on cheaper contract labor.
$7.9M
51.7% of revenue Rank #100 / 230Payroll % — state benchmarkedThis home is ranked 100th out of 230 homes in Texas.Shows payroll as a percentage of revenue versus the Texas average. Well-run SNFs often land around 55–65%. Below 25% may signal understaffing or heavy agency use — read with Staffing ratings.
Other operating costs Info All remaining costs needed to run the home, such as food, utilities, building maintenance, supplies and administrative expenses.
$6.2M
Total costs $14.1M
Walk Score
Walk Score: 32 / 100 Rank #150 / 207Walk Score — state benchmarkedThis home is ranked 150th out of 207 homes in Texas.Shows how walkable this facility's neighborhood is compared to the average Walk Score across Texas SNFs. Higher scores benefit residents, families, and staff.
Somewhat walkable. A few nearby services may be reachable on foot, but most trips require transportation.

About this community

Payment & Insurance

2 services
Accept Medicaid
Accept Medicare

Therapy & Rehabilitation

1 service
Rehabilitation Services

Amenities & Lifestyle

Specific ProgramsIn-house therapy, Activities and excursions, Church services
Religious ServicesYes

What does this home offer?

Housing options icon

Housing Options: Private / Semi-Private Rooms

Building type icon
Building type icon

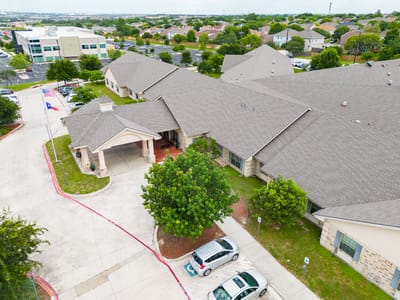
Building Type: Single-story

Dining services icon

Dining Services

Transportation services icon

Transportation Services

Housekeeping icon
Housekeeping icon

Housekeeping Services

Recreational activities icon

Recreational Activities

Exercise program icon

Exercise Programs

Types of Care at Westover Hills Rehabilitation and Healthcare Center

Nursing Home

Contact Westover Hills Rehabilitation and Healthcare Center

Health Inspection History

Inspections
Total health inspections 11

Texas average 7.4


Last Health inspection on Aug 2025

Total health citations
29 Rank #175 / 243Health citations — state benchmarkedThis home is ranked 175th out of 243 homes in Texas.Shows this facility's total health deficiency citations benchmarked to the Texas state average, with a ranking across all 243 TX SNFs. Lower citation counts earn a better rank.

Texas average 25.9

Citations per inspection
2.64 Rank #65 / 243Citations per inspection — state benchmarkedThis home is ranked 65th out of 243 homes in Texas.Shows average deficiency citations per CMS inspection for this facility versus the Texas mean across 243 SNFs with citation data. Lower is better.

Texas average 3.67


Health citations are formal notices following inspections when they fail to comply with safety and care standards.

13 of 29 citations resulted from standard inspections; and 16 of 29 resulted from complaint investigations.

Breakdown of citation severity (last 3 years)
Critical Health citations More info
1
50% better than Texas average

Texas average: 2


Serious Health citations More info 1
150% worse than Texas average

Texas average: 0.4

1 critical citation More info Texas average: 2

1 serious citation More info Texas average: 0.4

27 moderate citations More info Texas average: 23

0 minor citations More info Texas average: 0.4
Citations history (last 3 years)
Care Planning moderate citation Info Issues related to creating and updating personalized care plans for residents based on their needs and conditions. Aug 21, 2025

Care Planning moderate citation Info Issues related to creating and updating personalized care plans for residents based on their needs and conditions. Aug 21, 2025

Pharmacy moderate citation Info Issues related to medication management, including how drugs are stored, administered, and monitored. Apr 25, 2025
Corrected

Pharmacy moderate citation Info Issues related to medication management, including how drugs are stored, administered, and monitored. Feb 14, 2025
Corrected

Financial Assistance for
Nursing Home in Texas

Westover Hills Rehabilitation and Healthcare Center is located in San Antonio, Texas.
Here are the financial assistance programs available to residents in Texas.

Get Financial aid guidance

Community Care for the Aged and Disabled (CCAD)

TX Medicaid CCAD

Age 65+ or disabled
General Texas resident, Medicaid-eligible, care need (not always nursing home level).
Income Limits (2025) ~$2,829/month 300% FBR, individual
Asset Limits $2,000 (individual), $3,000 (couple).
TX

Large state; rural access challenges.

Benefits
Personal care (5-7 hours/day) Respite (240 hours/year) Adult day care (~$60/day) Home aides

Texas Community Care Services

TX CCS

Age 60+
General Texas resident, at risk of decline.
Income Limits ~$2,000/month individual, varies
Asset Limits $5,000 individual
TX

Limited funding; high demand in urban areas.

Benefits
In-home care (3-5 hours/week) Respite (up to 10 days/year) Transportation (~5 trips/month)

Area Agency on Aging (AAA) Services

Texas AAA Services

Age 60+
General TX resident; no income/asset limits.
Income Limits (2025) None; donations encouraged.
Asset Limits Not assessed.
TX

28 AAAs; includes Meals on Wheels in some areas.

Benefits
Meals (~$5-$7/meal) Transportation Homemaker services (~4 hours/week) Respite (~5 days/year) Legal aid

Medicare Savings Program (MSP)

Texas Medicare Savings Program

Age 65+ or disabled
General TX resident, Medicare Part A/B.
Income Limits (2025) ~$2,510/month (QMB), ~$3,380/month (SLMB), ~$3,598/month (QI)—individual.
Asset Limits $9,430 (individual), $14,130 (couple).
TX

Includes Extra Help for Part D; no waitlist.

Benefits
Covers Part B premiums ($174.70/month) Deductibles ($240/year) Copays (~20%)

Low-Income Home Energy Assistance Program (LIHEAP)

Texas Comprehensive Energy Assistance Program (CEAP)

Age 60+ prioritized
General TX resident, low-income.
Income Limits (2025) ~$3,970/month 185% FPL
Asset Limits Not assessed.
TX

Priority for elderly/disabled; covers gas, electric, propane.

Benefits
Heating/cooling aid ($300-$1,000/season) Emergency aid ($500 max)

Family Caregiver Support Program (FCSP)

Texas Family Caregiver Support Program

Age
General Caregivers of 60+ needing care or 55+ caregivers of others; TX resident; 2+ ADLs.
Income Limits (2025) No strict cap; prioritizes low-income ~$24,980/year
Asset Limits Not assessed.
TX

High rural demand; includes grandparent caregivers.

Benefits
Respite (4-6 hours/week or 5 days/year) Adult day care ($60/day) Training Supplies (~$500/year)

Senior Community Service Employment Program (SCSEP)

Texas SCSEP

Age 55+
General unemployed, low-income, TX resident.
Income Limits (2025) ~$1,983/month 125% FPL
Asset Limits Not specified.
TX

Priority for veterans, rural residents; AARP partnership.

Benefits
Paid training (~20 hours/week at ~$7.25/hour) Job placement

VA Aid and Attendance (A&A) and Housebound Benefits

Texas VA Aid and Attendance/Housebound

Age 65+ or disabled veteran/spouse
General TX resident, wartime service, ADL help (A&A) or homebound.
Income Limits (2025) Net income < ~$1,984/month (veteran with dependent, A&A); pension offsets income.
Asset Limits ~$155,356 net worth
TX

High veteran population; supports rural/urban needs.

Benefits
Cash (~$1,433-$2,642/month veteran, ~$951-$1,318 spouse) for care costs

Property Tax Exemption for Seniors

Texas Senior Property Tax Exemption

Age 65+
General TX resident, homeowner (homestead).
Income Limits (2025) None; tax-based eligibility.
Asset Limits Not assessed.
TX

$25,000+ exemption; optional freeze in some counties; saves ~$500-$1,000/year.

Benefits
Tax exemption or freeze (~$500-$1,000/year savings)

Senior Farmers’ Market Nutrition Program (SFMNP)

Texas SFMNP

Age 60+
General TX resident, low-income.
Income Limits (2025) ~$2,322/month 185% FPL
Asset Limits Not assessed.
TX

Vouchers (~$50/season); serves ~20,000 via 28 AAAs.

Benefits
Vouchers (~$50/season) for produce at farmers’ markets

Places of interest near Westover Hills Rehabilitation and Healthcare Center

Address 15.1 miles from city center Info Estimated distance in miles from San Antonio's city center to Westover Hills Rehabilitation and Healthcare Center's address, calculated via Google Maps.

Calculate Travel Distance to Westover Hills Rehabilitation and Healthcare Center

Add your location

Address

Staffing Data (Q2 2025)

This data corresponds to Q2 2025 and is based on CMS Payroll-Based Journal.

Total staff 159
Employees 158
Contractors 1
Staff to resident ratio 1.50:1
0% compared with Texas average

Texas average ratio: 1.51:1

Avg staff/day 65
Average shift 8.2 hours
0% compared with Texas average

Texas average: 8.1 hours

Total staff hours (quarter) 48,719
Nursing staff breakdown
Registered Nurse

Manages medical care and health needs.

Total count 9
Average shift length Info Average shift length. Calculated as total hours divided by days worked and average staff per day. 9.9 hours

No contractors work on this role.

Licensed Practical Nurse

Assists with medical care and medications.

Total count 24
Average shift length Info Average shift length. Calculated as total hours divided by days worked and average staff per day. 8.8 hours

No contractors work on this role.

Certified Nursing Assistant

Helps with daily care and mobility.

Total count 44
Average shift length Info Average shift length. Calculated as total hours divided by days worked and average staff per day. 8.3 hours

This role is partially covered by contractors.

Contractor staffing

Total hours from contractors

0%

8 contractor hours this quarter

Certified Nursing Assistant: 1
Staff by category
Certified Nursing Assistant 43 1 44 16,807 91 100% 8.3
Licensed Practical Nurse 24 0 24 8,147 91 100% 8.8
Speech Language Pathologist 15 0 15 3,664 90 99% 7
Registered Nurse 9 0 9 3,654 91 100% 9.9
RN Director of Nursing 10 0 10 2,635 78 86% 8.9
Medication Aide/Technician 6 0 6 2,462 73 80% 9.2
Physical Therapy Aide 12 0 12 2,418 90 99% 6.5
Qualified Social Worker 10 0 10 2,082 68 75% 7.4
Physical Therapy Assistant 5 0 5 1,291 80 88% 7.3
Respiratory Therapy Technician 7 0 7 989 82 90% 7.6
Dental Services Staff 3 0 3 918 66 73% 7.6
Clinical Nurse Specialist 6 0 6 790 63 69% 8.7
Nurse Practitioner 1 0 1 558 62 68% 9
Administrator 1 0 1 520 65 71% 8
Dietitian 1 0 1 520 65 71% 8
Mental Health Service Worker 1 0 1 496 62 68% 8
Therapeutic Recreation Specialist 1 0 1 490 62 68% 7.9
Other Dietary Services Staff 2 0 2 145 26 29% 5.6
Nurse Aide in Training 1 0 1 135 21 23% 6.4
44 Certified Nursing Assistant
% of Days 100%
24 Licensed Practical Nurse
% of Days 100%
15 Speech Language Pathologist
% of Days 99%
9 Registered Nurse
% of Days 100%
10 RN Director of Nursing
% of Days 86%
6 Medication Aide/Technician
% of Days 80%
12 Physical Therapy Aide
% of Days 99%
10 Qualified Social Worker
% of Days 75%
5 Physical Therapy Assistant
% of Days 88%
7 Respiratory Therapy Technician
% of Days 90%
3 Dental Services Staff
% of Days 73%
6 Clinical Nurse Specialist
% of Days 69%
1 Nurse Practitioner
% of Days 68%
1 Administrator
% of Days 71%
1 Dietitian
% of Days 71%
1 Mental Health Service Worker
% of Days 68%
1 Therapeutic Recreation Specialist
% of Days 68%
2 Other Dietary Services Staff
% of Days 29%
1 Nurse Aide in Training
% of Days 23%

Facility Characteristics

Source: CMS Long-Term Care Facility Characteristics (Data as of Jan 2026)

Total residents 106
Medicare
28
26.4% of residents
Medicaid
73
68.9% of residents
Private pay or other
5
4.7% of residents
Programs & Services
Residents Group

Residents meet regularly to discuss policies, care quality, and activities

Active Resident Council

Organized group of residents that meets regularly to discuss facility policies, quality of life, and activities.

Quality of care over time

These measures show how residents usually do over time at this home, based on health outcomes and preventive care.

High-risk clinical events score Info A composite score based on pressure ulcers, falls with injury, weight loss, walking ability decline, and activities of daily living decline. 5.7
33% better than Texas average

Texas average: 8.6

Functional decline score Info A composite score based on activities of daily living decline, walking ability decline, and incontinence. 13.1
19% better than Texas average

Texas average: 16.0

Long-stay resident measures
Significantly above average Texas avg: 4.1 Info CMS star rating based on long-stay quality measure performance. 5 stars = significantly above average, 1 star = significantly below average.
Need for Help with Daily Activities Increased Info Percent of long-stay residents whose need for help with daily activities has increased 13.9%
14% better than Texas average

Texas average: 16.2%

Walking Ability Worsened Info Percent of long-stay residents whose ability to move independently worsened 5.4%
67% better than Texas average

Texas average: 16.2%

Low Risk Residents with Bowel/Bladder Incontinence Info Percent of low risk long-stay residents who lose control of their bowels or bladder 20.0%
27% worse than Texas average

Texas average: 15.7%

Falls with Major Injury Info Percent of long-stay residents experiencing one or more falls with major injury 3.8%
17% worse than Texas average

Texas average: 3.2%

High Risk Residents with Pressure Ulcers Info Percent of long-stay high risk residents with pressure ulcers 2.9%
36% better than Texas average

Texas average: 4.4%

Urinary Tract Infection Info Percent of long-stay residents with a urinary tract infection 0.7%
11% better than Texas average

Texas average: 0.8%

Lost Too Much Weight Info Percent of long-stay residents who lose too much weight 2.8%
19% better than Texas average

Texas average: 3.5%

Depressive Symptoms Info Percent of long-stay residents who have depressive symptoms 0.4%
87% better than Texas average

Texas average: 2.9%

Antipsychotic Use Info Percent of long-stay residents who received an antipsychotic medication 0.7%
91% better than Texas average

Texas average: 7.9%

Pneumococcal Vaccine Info Percent of long-stay residents assessed and appropriately given the pneumococcal vaccine 100.0%
In line with Texas average

Texas average: 97.3%

Influenza Vaccine Info Percent of long-stay residents assessed and appropriately given the seasonal influenza vaccine 98.7%
In line with Texas average

Texas average: 97.9%

Hospitalizations per 1,000 days Info Number of hospitalizations per 1,000 long-stay resident days. 1.68
21% better than Texas average

Texas average: 2.13

ED visits per 1,000 days Info Number of outpatient emergency department visits per 1,000 long-stay resident days. 1.39
33% better than Texas average

Texas average: 2.07

Short-stay resident measures
Above average Texas avg: 3.1 Info CMS star rating based on short-stay quality measure performance. 5 stars = much above average, 1 star = much below average.
Pneumococcal Vaccine Info Percent of short-stay residents assessed and appropriately given the pneumococcal vaccine 99.3%
10% better than Texas average

Texas average: 90.4%

Antipsychotic medication increase Info Percent of short-stay residents who newly received an antipsychotic medication 0.5%
68% better than Texas average

Texas average: 1.4%

Influenza Vaccine Info Percent of short-stay residents assessed and appropriately given the seasonal influenza vaccine 95.6%
9% better than Texas average

Texas average: 88.0%

Re-hospitalized after SNF stay Info Percentage of short-stay residents who were re-hospitalized after their nursing home admission. 27.7%
7% worse than Texas average

Texas average: 25.9%

Emergency department visits Info Percentage of short-stay residents who had an outpatient emergency department visit. 13.2%
10% worse than Texas average

Texas average: 12.0%

Falls with major injury Info Percentage of SNF residents who experience falls with major injury during their stay. 0.0%
100% better than Texas average

Texas average: 0.8%

Ability to care for self at discharge Info Percentage of residents at or above expected ability to care for themselves at discharge. 57.9%
8% better than Texas average

Texas average: 53.7%

Successful return to home or community Info Rate of successful return to home or community from a skilled nursing facility. 53.7%
6% better than Texas average

Texas average: 50.6%

Penalties and fines

Federal penalties imposed by CMS for regulatory violations, including civil money penalties (fines) and denials of payment for new Medicare/Medicaid admissions.

Source: CMS Penalties Database (Data as of Jan 2026)

Total fines amount $36K
55% lower than Texas average

Texas average: $80K

Number of fines 3
21% more fines than Texas average

Texas average: 2.5

Payment Denials Info Serious action where Medicare and/or Medicaid temporarily stops payments for new residents until issues are fixed. 1
354% more payment denials than Texas average

Texas average: 0.2

Fines amount comparison
This facility $36K
Texas average $80K
Penalty History

Penalties are imposed by CMS for violations of federal nursing home regulations.

3 penalties in the past 3 years

Multiple penalties were reported in the last 3 years.

Civil Money Penalty Info Fines imposed for noncompliance, which can be assessed per day or per instance of violation. Nov 8, 2024
$13K
Payment Denial Info Serious action where Medicare and/or Medicaid temporarily stops payments for new residents until issues are fixed. Nov 8, 2024
1 days
Civil Money Penalty Info Fines imposed for noncompliance, which can be assessed per day or per instance of violation. Nov 10, 2023
$8K

Last updated: Jan 2026

Compare Nursing Home around Bexar County The information below is reported by the Texas Health and Human Services Commission.

5 facilities compared · CMS & TX Dept. of Health data · Updated May 2026

Filter by care type
Mystic Park Nursing and Rehabilitation Center
NH

Nursing Home Licensed facility providing 24/7 skilled nursing care for residents with complex, ongoing medical needs. Staffed by RNs, LPNs, and CNAs. Inspected and star-rated annually by CMS. Accepts Medicare (short-term rehab) and Medicaid (long-term care).

San Antonio (Far West Side) 119 81.8% +29% 3.50 +9% -4% 1 21 4.2 2 107 A+ 59 Fox Sparrow Healthcare, Inc. $14.5M $5.9M 40.8% 676012
Buena Vida Nursing and Rehab Center San Antonio
NH

Nursing Home Licensed facility providing 24/7 skilled nursing care for residents with complex, ongoing medical needs. Staffed by RNs, LPNs, and CNAs. Inspected and star-rated annually by CMS. Accepts Medicare (short-term rehab) and Medicaid (long-term care).

HC

Home Care Professional care delivered in the person's own home — from companionship and errands to skilled nursing and therapy. Allows seniors to age in place. Medicare covers skilled home health when medically necessary.

RC

Respite Care Short-term temporary care — days to weeks — to give family caregivers a break. Full care provided during the stay. Often used after hospitalization or to trial a facility before a permanent placement decision.

San Antonio (East Side) 222 27.6% -57% 3.48 +20% -4% 1 44 4.4 3 66 A+ 26 West Wharton County Hospital District $6.7M $2.9M 43.3% 455390
Westover Hills Rehabilitation and Healthcare Center
NH

Nursing Home Licensed facility providing 24/7 skilled nursing care for residents with complex, ongoing medical needs. Staffed by RNs, LPNs, and CNAs. Inspected and star-rated annually by CMS. Accepts Medicare (short-term rehab) and Medicaid (long-term care).

San Antonio (Far West Side) 124 81.0% +28% 3.87 -24% +7% 3 29 2.6 2 107 - 32 Sage Terrace Healthcare Llc $15.3M $6.9M 45.2% 676281
River City Care Center
NH

Nursing Home Licensed facility providing 24/7 skilled nursing care for residents with complex, ongoing medical needs. Staffed by RNs, LPNs, and CNAs. Inspected and star-rated annually by CMS. Accepts Medicare (short-term rehab) and Medicaid (long-term care).

HC

Home Care Professional care delivered in the person's own home — from companionship and errands to skilled nursing and therapy. Allows seniors to age in place. Medicare covers skilled home health when medically necessary.

RC

Respite Care Short-term temporary care — days to weeks — to give family caregivers a break. Full care provided during the stay. Often used after hospitalization or to trial a facility before a permanent placement decision.

San Antonio (Eastside Promise Neighborhood) 92 40.2% -37% 3.63 +91% 0% 2 32 5.3 2 41 - 68 - $4.4M $1.9M 43% 675896
San Pedro Manor
NH

Nursing Home Licensed facility providing 24/7 skilled nursing care for residents with complex, ongoing medical needs. Staffed by RNs, LPNs, and CNAs. Inspected and star-rated annually by CMS. Accepts Medicare (short-term rehab) and Medicaid (long-term care).

San Antonio (Monte Vista) 150 54.9% -13% 3.63 +20% 0% 5 43 3.9 5 94 A+ 79 West Ashby Healthcare, Inc. $12.1M $5.4M 44.7% 455689

Guides for Better Senior Living

Care Cost Calculator: See Prices in Your Area

Nursing Home Data Explorer

Don’t Wait Too Long: 7 Red Flag Signs Your Parent Needs Assisted Living Now

The True Cost of Assisted Living in 2025 – And How Families Are Paying For It

Understanding Senior Living Costs: Pricing Models, Discounts & Financial Assistance

Frequently Asked Questions about Westover Hills Rehabilitation and Healthcare Center

What neighborhood is Westover Hills Rehabilitation and Healthcare Center in?

Westover Hills Rehabilitation and Healthcare Center is in the Far West Side neighborhood.

Is Westover Hills Rehabilitation and Healthcare Center in a walkable area?

Westover Hills Rehabilitation and Healthcare Center has a walk score of 32. Somewhat walkable. A few nearby services may be reachable on foot, but most trips require transportation.

Are there photos of Westover Hills Rehabilitation and Healthcare Center?

Yes — there are 11 photos of Westover Hills Rehabilitation and Healthcare Center in the photo gallery on this page.

What is the address of Westover Hills Rehabilitation and Healthcare Center?

Westover Hills Rehabilitation and Healthcare Center is located at 9922 TX-151, San Antonio, TX 78251, United States.

What is the phone number of Westover Hills Rehabilitation and Healthcare Center?

(210) 546-2273 will put you in contact with the team at Westover Hills Rehabilitation and Healthcare Center.

Is Westover Hills Rehabilitation and Healthcare Center Medicare or Medicaid certified?

Yes — Westover Hills Rehabilitation and Healthcare Center is a CMS-certified provider of Medicare and Medicaid.

Explore Open Rooms
1 Contact details
2 What type of senior care service are you looking for?
3 What budget do you have in mind for senior care?
4 How soon do you need to find care?
5 Additional details

Thank you for your interest!

Our team will be in touch shortly to help with next steps.