New Castle Health & Rehabilitation Center
CMS overall rating Info CMS (the Centers for Medicare & Medicaid Services) is the federal agency that rates nursing home quality. Its Overall Rating runs from 1 to 5 stars, combining health inspections, staffing, and quality measures, with inspections weighted most heavily.

New Castle Health & Rehabilitation Center

CMS overall rating Info CMS (the Centers for Medicare & Medicaid Services) is the federal agency that rates nursing home quality. Its Overall Rating runs from 1 to 5 stars, combining health inspections, staffing, and quality measures, with inspections weighted most heavily.
Calculator: See prices in your area
New Castle Health & Rehabilitation Center accepts Medicare, Medicaid, and private pay.

Overview of New Castle Health & Rehabilitation Center

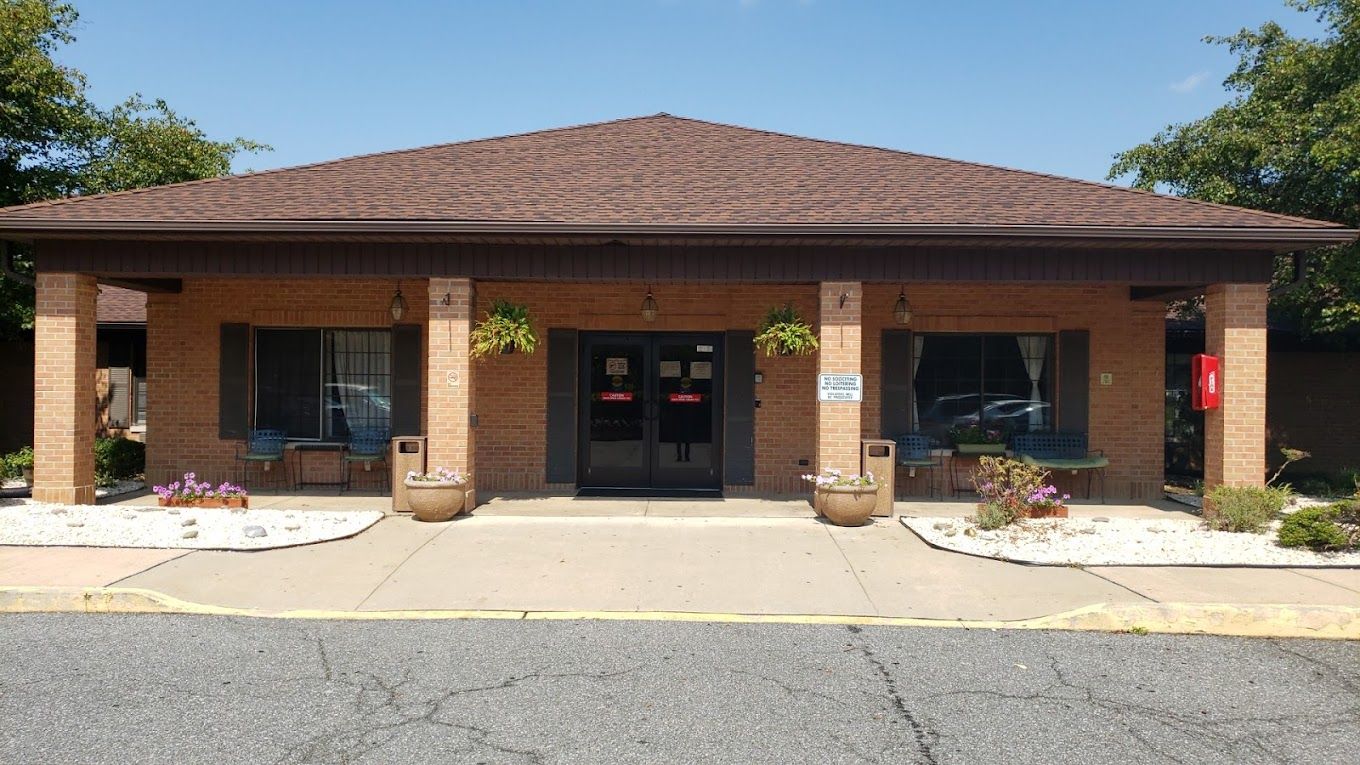
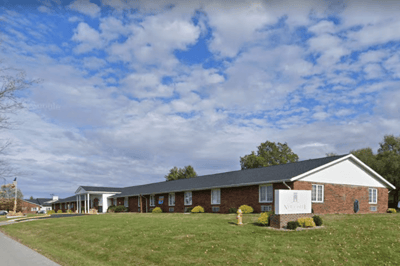
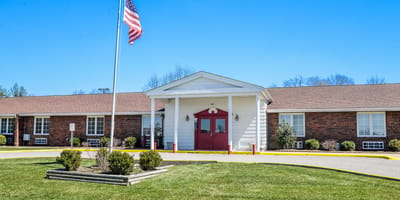
New Castle Health & Rehabilitation Center is a nursing home that not only meets but exceeds the expectations of families who place their trust in its care. With a person-centered approach, this center is wholeheartedly committed to supporting the wellness goals of seniors, ensuring they receive the highest standard of care. Offering skilled nursing services, senior rehabilitation, and long-term care, each aspect is thoughtfully customized to cater to the unique needs of every individual resident.

Beyond providing exceptional care, this home in Delaware also offers a plethora of opportunities for new experiences and skill development, empowering seniors to embrace life to the fullest. Families can rest assured that their loved ones are in reliable and caring hands, making this center a place they can truly count on for providing compassionate and top-tier care to the seniors who call it home.

(302) 328-2580

Quality ratings

Measured by Centers for Medicare & Medicaid Services (CMS)

Overall rating Info The Overall CMS Rating combines results from health inspections, staffing levels and quality measures. Health inspections carry the most weight. Staffing and quality scores can increase or decrease the final rating based on performance compared to state and national standards.
▼ 39.0% Below DE avg. ▼ 39.0% Below DE avg.DE average: 3.3Click the badge to see the full State ranking.Click here to see the full State ranking.
Health Inspection Info Based on the results of the facility's three most recent standard inspections and any complaint investigations. CMS reviews the number, scope, and severity of deficiencies, with more recent findings weighted more heavily.
▼ 63.9% Below DE avg. ▼ 63.9% Below DE avg.DE average: 2.8Click the badge to see the full State ranking.Click here to see the full State ranking.
Staffing Info Measures average nursing staff hours per resident per day, including Registered Nurses (RNs) and total nursing staff. Ratings are adjusted based on the level of care residents require and are compared to state and national benchmarks.
At DE avg. At DE avg.DE average: 4.0Click the badge to see the full State ranking.Click here to see the full State ranking.
Quality Measures Info Based on clinical and physical health indicators reported to CMS, such as hospital readmissions, falls, pressure ulcers, and improvements in mobility. These measures reflect how well residents' health needs are being managed.
▲ 23.6% Above DE avg. ▲ 23.6% Above DE avg.DE average: 4.0Click the badge to see the full State ranking.Click here to see the full State ranking.

Staffing hours breakdown

Info Daily nursing hours per resident by staff type, reported to CMS. Higher is generally better — compare this facility to state and national averages to see where staffing stands.

Hours per resident per day — compared to Delaware state averages

Total nursing care / resident Info This home is ranked 24th out of 40 homes in Delaware for nurse hours. Total adjusted nursing hours per resident per day, combining RN, LPN, and aide time. CMS adjusts this for case-mix so facilities can be fairly compared.
4h 6m per day
Rank #24 / 40Nurse hours — State benchmarkedThis home is ranked 24th out of 40 homes in Delaware. Shows adjusted nurse hours per resident per day benchmarked to the Delaware average, with a ranking across 40 Delaware facilities. More hours mean more direct care. The national average is about 3.5 hrs; below 3.0 is a red flag.Rankings are based only on facilities in Delaware that report data for that category. Facilities without available data are excluded from the ranking.Click the rank badge to see the full State ranking.Click here to see the full State ranking.
This facility Delaware avg (4h 39m per day)
vs Delaware avg
-12%

6 of 6 metrics below state avg

Staff typeHours / Day / Residentvs state avg
Registered Nurse (RN) Info RNs hold the highest nursing license and can assess residents, interpret test results, and direct care plans. More RN hours per day often signals stronger clinical oversight and faster response to health changes. 51m per day ▼ 19% State avg: 1h 2m per day · National avg: 41m per day
LPN / LVN Info Licensed Practical Nurses (LPNs) or Licensed Vocational Nurses (LVNs) deliver routine hands-on care — medication administration, wound dressing, and monitoring vital signs. They work under RN supervision and make up a large share of daily bedside care. 47m per day ▼ 23% State avg: 1h 1m per day · National avg: 52m per day
Nurse Aide Info Certified Nurse Aides (CNAs) provide the most direct day-to-day assistance: bathing, dressing, feeding, and mobility. Nurse aide hours are typically the largest staffing category and directly affect residents' quality of life. 2h 10m per day ▼ 12% State avg: 2h 28m per day · National avg: 2h 21m per day
Weekend Total Nursing Info Combined nursing hours (RN + LPN + Nurse Aide) per resident per day on weekends. Staffing often drops on weekends — this figure reveals whether the facility maintains adequate coverage outside of weekday hours. 3h 24m per day ▼ 16% State avg: 4h 2m per day · National avg: 3h 26m per day
Physical Therapist Info Hours per resident per day provided by licensed Physical Therapists (PTs) or PT Assistants. PT services help residents recover mobility after injury or illness and are especially important for post-acute (short-stay) rehabilitation. 3m per day ▼ 68% State avg: 9m per day · National avg: 4m per day
Weekend RN Info Registered nurse hours specifically on weekends. Facilities sometimes reduce RN presence on Saturdays and Sundays — a low weekend RN figure compared to weekday hours can indicate reduced clinical oversight when most administrative staff are absent. 37m per day ▼ 15% State avg: 43m per day · National avg: 29m per day

Capacity and availability

This home is often near full

Higher occupancy than the Delaware average: 80.7%
Occupancy rate
95.3% Rank #3 / 44Occupancy rate — State benchmarkedThis home is ranked 3rd out of 44 homes in Delaware. Shows this facility's occupancy rate versus the Delaware average, with its Statewide rank out of 44. Higher occupancy signals strong local demand and financial stability.Rankings are based only on facilities in Delaware that report data for that category. Facilities without available data are excluded from the ranking.Click the rank badge to see the full State ranking.Click here to see the full State ranking.
Avg. Length of Stay
125 days
Bed community size
120-bed community Rank #25 / 73Bed count — State benchmarkedThis home is ranked 25th out of 73 homes in Delaware. Shows this facility's certified or reported bed count compared to other Delaware facilities. Larger communities may offer more amenities, programs, and on-site services for residents and families.Rankings are based only on facilities in Delaware that report data for that category. Facilities without available data are excluded from the ranking.Click the rank badge to see the full State ranking.Click here to see the full State ranking.
A larger shared setting that may offer more common spaces and organized community services.
Walk Score
Walk Score: 21 / 100 Rank #81 / 110Walk Score — State benchmarkedThis home is ranked 81st out of 110 homes in Delaware. Shows how walkable this facility's neighborhood is compared to the average Walk Score across Delaware facilities. Higher scores benefit residents, families, and staff.Rankings are based only on facilities in Delaware that report data for that category. Facilities without available data are excluded from the ranking.Click the rank badge to see the full State ranking.Click here to see the full State ranking.
Car-dependent. Most errands require a car, with limited nearby walkable options.

About this community

Payment & Insurance

2 services
Accept Medicaid
Accept Medicare

Therapy & Rehabilitation

2 services
Rehabilitation Services
Short-Term Rehab

Staffing & Medical

2 services
Doctor on Staff
24-Hour Staffing

Contact New Castle Health & Rehabilitation Center

Staffing Data

Reporting period: October 1 – December 31, 2025 (Q4 2025). Source: CMS Payroll-Based Journal report.

Total staff 122
Employees 104
Contractors 18
Staff to resident ratio 1.06 : 1
35% fewer staff per resident than Delaware average
Delaware average ratio: 1.63 : 1 Delaware average ratio: 1.63 : 1See full Delaware ranking
Avg staff/day 63
Average shift 7.9 hours
0% compared with Delaware average
Delaware average: 7.6 hours Delaware average shift: 7.6 hoursSee full Delaware ranking
Total staff hours (quarter) 45,525

Nursing staff breakdown

Q4 2025 · Oct 1 – Dec 31 More info This data comes from the CMS Payroll-Based Journal report covering October 1 – December 31, 2025.
Registered Nurse

Manages medical care and health needs.

RN Staff Info All 17 RN Staff are full-time employees. No contractors work on this role. 17
Average shift length Info Average shift length. Calculated as total hours divided by days worked and average staff per day. 8.3 hours
Licensed Practical Nurse

Assists with medical care and medications.

LPN Staff Info All 16 LPN Staff are full-time employees. No contractors work on this role. 16
Average shift length Info Average shift length. Calculated as total hours divided by days worked and average staff per day. 8.2 hours
Certified Nursing Assistant

Helps with daily care and mobility.

CNA Staff Info All 59 CNA Staff are full-time employees. No contractors work on this role. 59
Average shift length Info Average shift length. Calculated as total hours divided by days worked and average staff per day. 8.3 hours

Contractor staffing

Q4 2025 · Oct 1 – Dec 31 More info This data comes from the CMS Payroll-Based Journal report covering October 1 – December 31, 2025.

Total hours from contractors

6.6%

2,986 contractor hours this quarter

Occupational Therapy Assistant: 4 Respiratory Therapy Technician: 3 Physical Therapy Aide: 2 Physical Therapy Assistant: 2 Clinical Nurse Specialist: 2 Speech Language Pathologist: 2 Qualified Social Worker: 2 Medical Director: 1

Staff by category

Q4 2025 · Oct 1 – Dec 31 More info This data comes from the CMS Payroll-Based Journal report covering October 1 – December 31, 2025.
Certified Nursing Assistant5905922,78192100%8.3
Licensed Practical Nurse160167,82792100%8.2
Registered Nurse170176,77292100%8.3
Clinical Nurse Specialist3251,6236773%8.2
Other Dietary Services Staff2029348997%7.6
Speech Language Pathologist0229296672%7.2
Physical Therapy Assistant0228767480%6.9
Mental Health Service Worker1015356470%8.4
Administrator1015126470%8
Respiratory Therapy Technician0335057278%6.1
Dietitian1014886470%7.6
Nurse Practitioner1014565762%8
RN Director of Nursing1014415459%8.2
Physical Therapy Aide0224016470%6.1
Occupational Therapy Aide1011922426%8
Dental Services Staff101741011%7.4
Medical Director0116392100%0.7
Qualified Social Worker022602224%2.7
Occupational Therapy Assistant044584650%1.2
59 Certified Nursing Assistant
% of Days 100%
16 Licensed Practical Nurse
% of Days 100%
17 Registered Nurse
% of Days 100%
5 Clinical Nurse Specialist
% of Days 73%
2 Other Dietary Services Staff
% of Days 97%
2 Speech Language Pathologist
% of Days 72%
2 Physical Therapy Assistant
% of Days 80%
1 Mental Health Service Worker
% of Days 70%
1 Administrator
% of Days 70%
3 Respiratory Therapy Technician
% of Days 78%
1 Dietitian
% of Days 70%
1 Nurse Practitioner
% of Days 62%
1 RN Director of Nursing
% of Days 59%
2 Physical Therapy Aide
% of Days 70%
1 Occupational Therapy Aide
% of Days 26%
1 Dental Services Staff
% of Days 11%
1 Medical Director
% of Days 100%
2 Qualified Social Worker
% of Days 24%
4 Occupational Therapy Assistant
% of Days 50%

Penalties and fines

Federal penalties imposed by CMS for regulatory violations, including civil money penalties (fines) and denials of payment for new Medicare/Medicaid admissions.

Source: CMS Penalties Database

No penalties in the past 3 years

No civil money penalties or payment denials were reported in the last 3 years.

Quality of care over time

These measures show how residents usually do over time at this home, based on health outcomes and preventive care.

High-risk clinical events score Info A composite score based on pressure ulcers, falls with injury, weight loss, walking ability decline, and activities of daily living decline. 9.8
In line with Delaware average

Delaware average: 9.6

Functional decline score Info A composite score based on activities of daily living decline, walking ability decline, and incontinence. 14.8
22% better than Delaware average

Delaware average: 19.0

Long-stay resident measures
Above average Info CMS star rating based on long-stay quality measure performance. 5 stars = significantly above average, 1 star = significantly below average.
Need for Help with Daily Activities Increased Info Percent of long-stay residents whose need for help with daily activities has increased 12.8%
17% better than Delaware average

Delaware average: 15.4%

Walking Ability Worsened Info Percent of long-stay residents whose ability to move independently worsened 21.6%
9% worse than Delaware average

Delaware average: 19.8%

Low Risk Residents with Bowel/Bladder Incontinence Info Percent of low risk long-stay residents who lose control of their bowels or bladder 10.0%
55% better than Delaware average

Delaware average: 22.1%

Falls with Major Injury Info Percent of long-stay residents experiencing one or more falls with major injury 4.3%
44% worse than Delaware average

Delaware average: 3.0%

High Risk Residents with Pressure Ulcers Info Percent of long-stay high risk residents with pressure ulcers 5.1%
16% worse than Delaware average

Delaware average: 4.4%

Urinary Tract Infection Info Percent of long-stay residents with a urinary tract infection 2.1%
In line with Delaware average

Delaware average: 2.1%

Lost Too Much Weight Info Percent of long-stay residents who lose too much weight 5.0%
13% better than Delaware average

Delaware average: 5.8%

Depressive Symptoms Info Percent of long-stay residents who have depressive symptoms 1.8%
70% better than Delaware average

Delaware average: 6.0%

Antipsychotic Use Info Percent of long-stay residents who received an antipsychotic medication 13.6%
24% worse than Delaware average

Delaware average: 11.0%

Pneumococcal Vaccine Info Percent of long-stay residents assessed and appropriately given the pneumococcal vaccine 98.1%
In line with Delaware average

Delaware average: 95.3%

Influenza Vaccine Info Percent of long-stay residents assessed and appropriately given the seasonal influenza vaccine 100.0%
In line with Delaware average

Delaware average: 97.4%

Short-stay resident measures
Significantly above average Info CMS star rating based on short-stay quality measure performance. 5 stars = much above average, 1 star = much below average.
Pneumococcal Vaccine Info Percent of short-stay residents assessed and appropriately given the pneumococcal vaccine 49.3%
40% worse than Delaware average

Delaware average: 82.1%

Antipsychotic medication increase Info Percent of short-stay residents who newly received an antipsychotic medication 1.1%
24% worse than Delaware average

Delaware average: 0.9%

Influenza Vaccine Info Percent of short-stay residents assessed and appropriately given the seasonal influenza vaccine 46.4%
44% worse than Delaware average

Delaware average: 83.1%

Re-hospitalized after SNF stay Info Percentage of short-stay residents who were re-hospitalized after their nursing home admission. 19.8%
8% better than Delaware average

Delaware average: 21.5%

Emergency department visits Info Percentage of short-stay residents who had an outpatient emergency department visit. 5.0%
55% better than Delaware average

Delaware average: 11.2%

Falls with major injury Info Percentage of SNF residents who experience falls with major injury during their stay. 1.6%
104% worse than Delaware average

Delaware average: 0.8%

Ability to care for self at discharge Info Percentage of residents at or above expected ability to care for themselves at discharge. 48.2%
10% worse than Delaware average

Delaware average: 53.7%

Successful return to home or community Info Rate of successful return to home or community from a skilled nursing facility. 59.6%
18% better than Delaware average

Delaware average: 50.6%

Breakdown by payment type

Medicare

42% of new residents, usually for short-term rehab.

Typical stay 23 days

Private pay

50% of new residents, often for short stays.

Typical stay 1 - 2 months

Medicaid

8% of new residents, often for long-term daily care.

Typical stay 3 - 4 years

Facility Characteristics

Source: CMS Long-Term Care Facility Characteristics (Data as of Jan 2026)

Total residents 115
Medicare
14
12.2% of residents
Medicaid
84
73% of residents
Private pay or other
17
14.8% of residents
Programs & Services
Residents Group

Residents meet regularly to discuss policies, care quality, and activities

Active Resident Council

Organized group of residents that meets regularly to discuss facility policies, quality of life, and activities.

Finances and operations

Based on CMS SNF Cost Report for fiscal year ending in 12/2023.

Voluntary non-profit community
Operated by a church.
Net patient revenue Info Net patient revenue — what the home actually collects for resident care, after contractual allowances, bad debt and discounts are subtracted from its gross charges (CMS cost report, Worksheet G-3). It covers resident care only; money the home earns from other sources is shown separately as "Other income."
$14.6M
Net patient income Info Net patient income: net patient revenue minus the home's total operating expenses. A positive figure means it earns more from resident care than it spends to deliver it; a negative figure means the opposite. It excludes non-operating "other income."
-$14.0K
Voluntary non-profit community Operated by a church.
Net patient revenue Info Net patient revenue — what the home actually collects for resident care, after contractual allowances, bad debt and discounts are subtracted from its gross charges (CMS cost report, Worksheet G-3). It covers resident care only; money the home earns from other sources is shown separately as "Other income."
$14.6M Rank #24 / 37Revenue — State benchmarkedThis home is ranked 24th out of 37 homes in Delaware. Shows this facility's annual revenue compared to the Delaware average. Higher revenue generally means more resources for staffing and capital — read alongside Payroll %.Rankings are based only on facilities in Delaware that report data for that category. Facilities without available data are excluded from the ranking.Click the rank badge to see the full State ranking.Click here to see the full State ranking.
Net patient income Info Net patient income: net patient revenue minus the home's total operating expenses. A positive figure means it earns more from resident care than it spends to deliver it; a negative figure means the opposite. It excludes non-operating "other income."
-$14.0K
Other income Info Money the home earns outside of resident care — such as investments, grants, rentals and other non-operating sources (CMS cost report, Worksheet G-3). It is tracked separately from net patient revenue: it is not part of that figure, and it is not included in net patient income.
$2.7K
Payroll costs Info Staff salaries plus wage-related costs — benefits such as payroll taxes, health insurance and retirement — from the home's own accounting records (CMS cost report, Worksheet A). Contract or agency labor is counted separately, under other operating costs. Rank #14 / 37Payroll — State benchmarkedThis home is ranked 14th out of 37 homes in Delaware. Shows total annual staff payroll benchmarked to the Delaware average. Higher payroll investment relative to peers often signals better staffing and less reliance on cheaper contract labor.Rankings are based only on facilities in Delaware that report data for that category. Facilities without available data are excluded from the ranking.Click the rank badge to see the full State ranking.Click here to see the full State ranking.
$8.8M 60.2% of net patient revenue Info Payroll as a share of revenue: staff salaries and wage-related benefits divided by net patient revenue. A higher figure means more of each revenue dollar goes to staff pay. Rank #8 / 37Payroll % — State benchmarkedThis home is ranked 8th out of 37 homes in Delaware. Shows payroll as a percentage of revenue versus the Delaware average. Well-run Delaware facilities typically land around 52–60% — the top third Statewide. Below 25% may signal understaffing or heavy agency use — read with Staffing ratings.Rankings are based only on facilities in Delaware that report data for that category. Facilities without available data are excluded from the ranking.Click the rank badge to see the full State ranking.Click here to see the full State ranking.
Other operating costs Info Everything it costs to run the home apart from payroll — food, utilities, supplies, maintenance, contract labor and administration. Calculated as total operating expense minus payroll (staff salaries and wage-related benefits).
$5.8M
Total costs Info The home's total operating expense for the year — all the costs of running it, salaries included (CMS cost report, Worksheet G-3).
$14.6M

What does this home offer?

Housing options icon

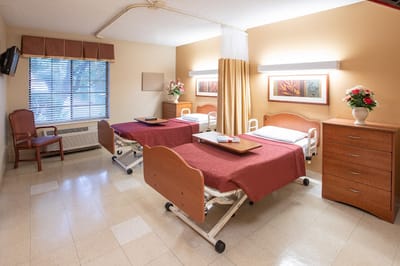
Housing Options: Private / Companionship Suite

Building type icon
Building type icon

Building Type: Single-story

Personal care icon
Personal care icon

Personal Care Assistance

Rehabilitative support icon

Rehabilitative Support

On-site medical care and health services icon

On-site Medical Care and Health Services

Who this home usually serves

TYPE OF STAY

Mix of rehab and long-term care

This home supports both short-term rehab and long-term care, with residents staying for a wide range of durations.

Most new residents arrive under private pay (50% of admissions), and a typical private pay stay runs around 1 - 2 months.

Admissions
341 total

Coverage residents most often arrive under.

Medicare 42%
Private pay 50%
Medicaid 8%
Discharges
334 total

Coverage residents most often leave under.

Medicare 32%
Private pay 50%
Medicaid 18%

Managed by Nha Mike Meumann

Administrator

Mike Meumann, NHA, serves as the Administrator at New Castle Health & Rehabilitation Center. He leads the community with a focus on providing quality care and support to residents, ensuring a warm and professional environment.

Places of interest near New Castle Health & Rehabilitation Center

Address 4.6 miles from city center Info Estimated distance in miles from New Castle's city center to New Castle Health & Rehabilitation Center's address, calculated via Google Maps. — 7.01 miles to nearest hospital (VA Medical Center- Wilmington)

Calculate Travel Distance to New Castle Health & Rehabilitation Center

Add your location

Address

Financial Assistance for
Nursing Home in Delaware

New Castle Health & Rehabilitation Center is located in New Castle, Delaware.
Here are the financial assistance programs available to residents in Delaware.

Get Financial aid guidance

Elderly and Disabled Waiver

Delaware Medicaid E&D Waiver

Age 65+ or disabled
General Delaware resident, Medicaid- eligible, nursing home-level care need.
Income Limits (2025) ~$2,829/month 300% FBR, individual
Asset Limits $2,000 (individual), $3,000 (couple).
DE

Small state, faster processing in some areas.

Benefits
Personal care (5-7 hours/day) Respite (240 hours/year) Adult day care (~$60/day) Home modifications

Delaware Caregiver Support Program

DE Caregiver Support (NFCSP)

Age Caregiver of someone 60+
General Delaware resident.
Income Limits No strict limit; prioritizes low-income.
Asset Limits Not applicable.
DE

Limited slots; rural focus.

Benefits
In-home respite (4-6 hours/day) Adult day care (~$60/day) Short-term facility care (up to 5 days)

Program of All-Inclusive Care for the Elderly (PACE)

Delaware Medicaid PACE

Age 55+
General Delaware resident, nursing home-level care need, safe with PACE support.
Income Limits (2025) ~$2,829/month 300% FBR
Asset Limits $2,000 (individual), $3,000 (couple).
DE

Limited to specific areas (e.g., New Castle County); few providers.

Benefits
Personal care (5-7 hours/day) Medical care Meals Transportation Therapy

Medicare Savings Program (MSP)

Delaware Medicare Savings Program

Age 65+ or disabled
General Delaware resident, enrolled in Medicare Part A/B.
Income Limits (2025) ~$2,510/month (QMB), ~$3,380/month (SLMB), ~$3,598/month (QI)—individual, adjusted annually.
Asset Limits $9,430 (individual), $14,130 (couple).
DE

Three tiers; broader limits than some states.

Benefits
Covers Medicare Part B premiums ($174.70/month) Deductibles ($240/year) Copays (~20% of services)

Frequently Asked Questions about New Castle Health & Rehabilitation Center

What neighborhood is New Castle Health & Rehabilitation Center in?

New Castle Health & Rehabilitation Center is in the Beaver Brook Apartments neighborhood.

Is New Castle Health & Rehabilitation Center in a walkable area?

New Castle Health & Rehabilitation Center has a walk score of 21. Car-dependent. Most errands require a car, with limited nearby walkable options.

What is the occupancy rate at New Castle Health & Rehabilitation Center?

New Castle Health & Rehabilitation Center's occupancy is 95.3%.

Are there photos of New Castle Health & Rehabilitation Center?

Yes — there are 8 photos of New Castle Health & Rehabilitation Center in the photo gallery on this page.

What is the address of New Castle Health & Rehabilitation Center?

New Castle Health & Rehabilitation Center is located at 32 Buena Vista Dr, New Castle, DE 19720.

What is the phone number of New Castle Health & Rehabilitation Center?

(302) 328-2580 will put you in contact with the team at New Castle Health & Rehabilitation Center.

Is New Castle Health & Rehabilitation Center Medicare or Medicaid certified?

Yes — New Castle Health & Rehabilitation Center is a CMS-certified provider of Medicare and Medicaid.

Guides for Better Senior Living

Care Cost Calculator: See Prices in Your Area

Nursing Home Data Explorer

Don’t Wait Too Long: 7 Red Flag Signs Your Parent Needs Assisted Living Now

The True Cost of Assisted Living in 2025 – And How Families Are Paying For It

Understanding Senior Living Costs: Pricing Models, Discounts & Financial Assistance