North Shore Health &Amp; Rehab Facility
Nursing Home · Loveland, CO

North Shore Health &Amp; Rehab Facility

Nursing Home · Loveland, CO

Overview of North Shore Health & Rehab Facility

North Shore Health & Rehabilitation is a family-owned healthcare facility in Loveland, Colorado. It has been serving the community since 1970, providing compassionate and personalized healthcare in a warm environment. The facility offers skilled nursing, physical therapy, occupational therapy, speech therapy, and long-term care services.

Staffing hours breakdown

Info Daily nursing hours per resident by staff type, reported to CMS. Higher is generally better — compare this facility to state and national averages to see where staffing stands.

Hours per resident per day — compared to Colorado state averages

Staff typeHours / Day / Residentvs state avg
Registered Nurse (RN) Info RNs hold the highest nursing license and can assess residents, interpret test results, and direct care plans. More RN hours per day often signals stronger clinical oversight and faster response to health changes. 1h 6m per day ▲ 32% State avg: 50m per day · National avg: 41m per day
LPN / LVN Info Licensed Practical Nurses (LPNs) or Licensed Vocational Nurses (LVNs) deliver routine hands-on care — medication administration, wound dressing, and monitoring vital signs. They work under RN supervision and make up a large share of daily bedside care. 42m per day ■ Avg State avg: 41m per day · National avg: 52m per day
Nurse Aide Info Certified Nurse Aides (CNAs) provide the most direct day-to-day assistance: bathing, dressing, feeding, and mobility. Nurse aide hours are typically the largest staffing category and directly affect residents' quality of life. 2h 33m per day ▲ 16% State avg: 2h 12m per day · National avg: 2h 20m per day
Total Nursing (Weekend) Info Combined nursing hours (RN + LPN + Nurse Aide) per resident per day on weekends. Staffing often drops on weekends — this figure reveals whether the facility maintains adequate coverage outside of weekday hours. 3h 47m per day ▲ 16% State avg: 3h 16m per day · National avg: 3h 26m per day
Physical Therapist Info Hours per resident per day provided by licensed Physical Therapists (PTs) or PT Assistants. PT services help residents recover mobility after injury or illness and are especially important for post-acute (short-stay) rehabilitation. 6m per day ▲ 20% State avg: 5m per day · National avg: 4m per day
RN (Weekend) Info Registered nurse hours specifically on weekends. Facilities sometimes reduce RN presence on Saturdays and Sundays — a low weekend RN figure compared to weekday hours can indicate reduced clinical oversight when most administrative staff are absent. 58m per day ▲ 61% State avg: 36m per day · National avg: 28m per day

Finances and operations

Home revenue
$12.5M
Home revenue
$12.5M
Payroll costs Info The portion of the home's budget spent on staff, including nurses, caregivers, and other employees who support care and operations.
$8.1M
64.7% of revenue
Bed community size
120-bed community
A larger shared setting that may offer more common spaces and organized community services.
Walk Score
Walk Score: 88 / 100
Very walkable. Most errands can be accomplished on foot, and many essentials are within a short walk.

About this community

License Details

Facility TypeSnf/nf Dual Certification
StatusActive
CMS Certification Number065129

Ownership & Operating Entity

North Shore Health &Amp; Rehab Facility is administrated by Debra Lynn Majors.

Owner NameNorth Shore Manor, Inc.

Therapy & Rehabilitation

1 service
Rehabilitation Services

Amenities & Lifestyle

Housekeeping
Laundry Services
Complimentary Wifi
Landscaped Gardens
Salon Services
Chapel
Transportation Services
Specific ProgramsPhysical Therapy & Rehabilitation
Religious ServicesYes, chapel available for reflection and worship.

Dining & Nutrition

Food DescriptionCulinary excellence with delicious, nutritious meals prepared by an on-site chef.

Contact North Shore Health &Amp; Rehab Facility

Inspection History

In Colorado, the Department of Public Health and Environment, Health Facilities Division is the regulatory body that performs unannounced surveys and publishes facility inspection findings.

Since 2019 · 7 years of data 25 deficiencies

Inspection Scorecard Info This scorecard compares key inspection, citation, and complaint metrics at this facility against the Colorado state average. Metrics rated ≥15% worse than average are highlighted in red; those ≥15% better are highlighted in green.

Since 2019 vs. Colorado state average
Latest Inspection May 16, 2024 Routine

Deficiencies Info Deficiencies are formal regulatory issues recorded during state inspections.

MetricThis FacilityCO Averagevs. CO Avg
Total deficiencies Info Formal regulatory issues recorded by inspectors across all inspection types. 2530 This facility has 17% fewer total deficiencies than a typical Colorado nursing home (25 vs. CO avg 30). Click this badge to view the full Colorado ranking.↓ 17% better
Deficiencies per year Info Average deficiencies per year since 2019. 3.64.3 This facility has 16% fewer deficiencies per year than a typical Colorado nursing home (3.6 vs. CO avg 4.3). Click this badge to view the full Colorado ranking.↓ 16% better

Inspection Reports Summary Info An editor-reviewed summary of the themes and findings across this facility's recent inspection reports.

North Shore Health & Rehab Facility’s inspection record is mixed, showing persistent issues with infection control, resident care, and food service sanitation despite some improvements. The most recent inspection on May 16, 2024, cited eight deficiencies including poor pressure ulcer treatment, inadequate pain management, improper diet preparation, and lapses in dishwashing and hand hygiene. Previous inspections documented failures in timely call light responses, bathing, abuse reporting, medication storage, and infection prevention, indicating ongoing challenges in several care and safety areas.

Financial Assistance for
Nursing Home in Colorado

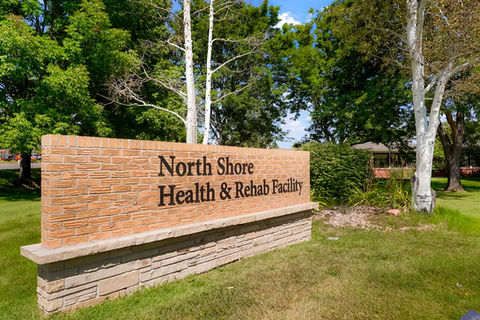
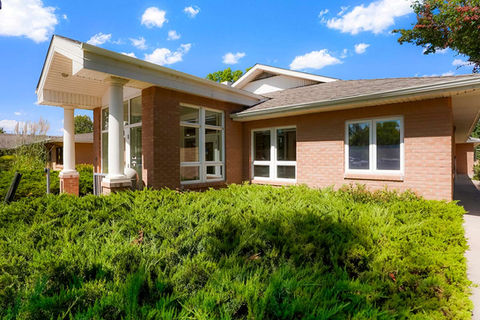
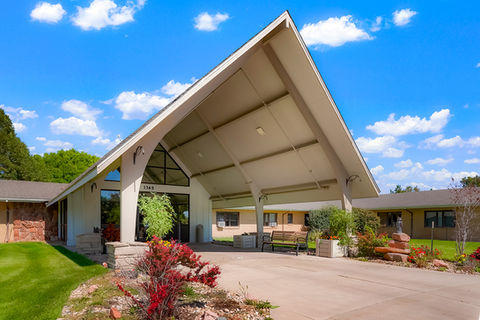
North Shore Health &Amp; Rehab Facility is located in LOVELAND, Colorado.
Here are the financial assistance programs available to residents in Colorado.

Get Financial aid guidance

Elderly, Blind, and Disabled Waiver

Colorado Medicaid EBD Waiver

Age 65+ or disabled
General Colorado resident, Medicaid- eligible, nursing home-level care need.
Income Limits (2025) ~$2,829/month 300% FBR, individual
Asset Limits $2,000 (individual), $3,000 (couple).
CO

Requires level-of-care assessment by case manager.

Benefits
Personal care (5-7 hours/day) Respite care (up to 240 hours/year) Adult day care ($65/day) Home modifications ($1,500 avg.)

Old Age Pension (OAP) Health Care Program

Colorado OAP

Age 60+
General Colorado resident.
Income Limits ~$1,215/month individual
Asset Limits $2,000 individual
CO

Supplements SSI; limited medical coverage.

Benefits
Cash (~$100-$800/month) Limited in-home care (2-3 hours/week) Medical assistance

Program of All-Inclusive Care for the Elderly (PACE)

Colorado Medicaid PACE

Age 55+
General Colorado resident, nursing home-level care need, safe with PACE support.
Income Limits (2025) ~$2,829/month 300% FBR
Asset Limits $2,000 (individual), $3,000 (couple).
CO

Limited to specific regions (e.g., Denver, Pueblo).

Benefits
All-inclusive care—personal care (5-7 hours/day) Meals Transportation Therapy Medical visits

Home Care Allowance (HCA)

Colorado Home Care Allowance (HCA)

Age
General Seniors typically 65+, Age 5+ with disability, Colorado resident, financial/functional need.
Income Limits (2025) ~$1,004/month individual, stricter than waivers
Asset Limits $2,000 (individual), $3,000 (couple).
CO

Must need help with ADLs; not Medicaid-waiver eligible.

Benefits
Personal care (~4-6 hours/day, paid to provider) E.g. Bathing Dressing

Places of interest near North Shore Health &Amp; Rehab Facility

Address 0.0 miles from city center Info Estimated distance in miles from Loveland's city center to North Shore Health &Amp; Rehab Facility's address, calculated via Google Maps.

Calculate Travel Distance to North Shore Health &Amp; Rehab Facility

Add your location

Address

Quality of care over time

These measures show how residents usually do over time at this home, based on health outcomes and preventive care.

Long-stay resident measures
Below average Colorado avg: 3.9 Info CMS star rating based on long-stay quality measure performance. 5 stars = significantly above average, 1 star = significantly below average.
Hospitalizations per 1,000 days Info Number of hospitalizations per 1,000 long-stay resident days. 2.70
108% worse than Colorado average

Colorado average: 1.30

ED visits per 1,000 days Info Number of outpatient emergency department visits per 1,000 long-stay resident days. 2.39
43% worse than Colorado average

Colorado average: 1.67

Short-stay resident measures
Significantly above average Colorado avg: 2.7 Info CMS star rating based on short-stay quality measure performance. 5 stars = much above average, 1 star = much below average.
Re-hospitalized after SNF stay Info Percentage of short-stay residents who were re-hospitalized after their nursing home admission. 12.2%
40% better than Colorado average

Colorado average: 20.3%

Emergency department visits Info Percentage of short-stay residents who had an outpatient emergency department visit. 15.9%
24% worse than Colorado average

Colorado average: 12.8%

Falls with major injury Info Percentage of SNF residents who experience falls with major injury during their stay. 0.0%
100% better than Colorado average

Colorado average: 0.8%

Ability to care for self at discharge Info Percentage of residents at or above expected ability to care for themselves at discharge. 67.6%
26% better than Colorado average

Colorado average: 53.7%

Successful return to home or community Info Rate of successful return to home or community from a skilled nursing facility. 64.3%
27% better than Colorado average

Colorado average: 50.6%

Guides for Better Senior Living

Care Cost Calculator: See Prices in Your Area

Nursing Home Data Explorer

Don’t Wait Too Long: 7 Red Flag Signs Your Parent Needs Assisted Living Now

The True Cost of Assisted Living in 2025 – And How Families Are Paying For It

Understanding Senior Living Costs: Pricing Models, Discounts & Financial Assistance

Frequently Asked Questions about North Shore Health &Amp; Rehab Facility

Who is the owner of North Shore Health &Amp; Rehab Facility?

The legal owner and operator of North Shore Health &Amp; Rehab Facility is North Shore Manor, Inc..

Is North Shore Health &Amp; Rehab Facility in a walkable area?

North Shore Health &Amp; Rehab Facility has a walk score of 88. Very walkable. Most errands can be accomplished on foot, and many essentials are within a short walk.

Who is the administrator of North Shore Health &Amp; Rehab Facility?

Debra Lynn Majors is the administrator of North Shore Health &Amp; Rehab Facility.

How many beds does North Shore Health &Amp; Rehab Facility have?

North Shore Health &Amp; Rehab Facility has 120 beds.

Are there photos of North Shore Health &Amp; Rehab Facility?

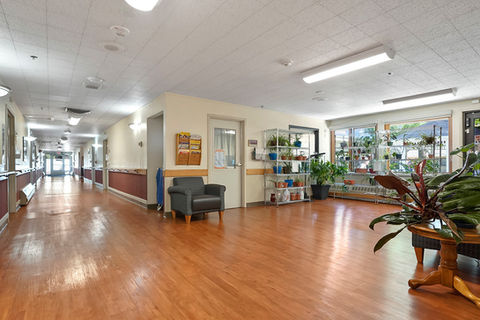
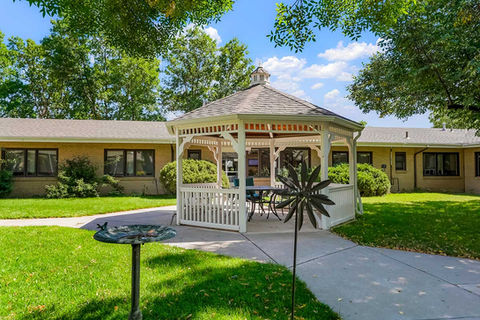
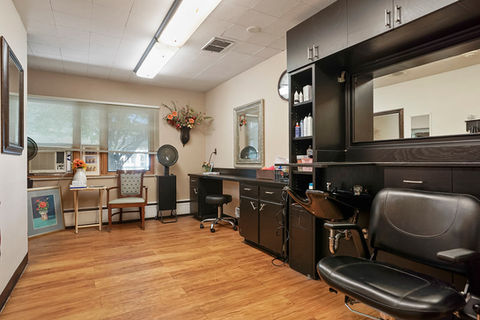
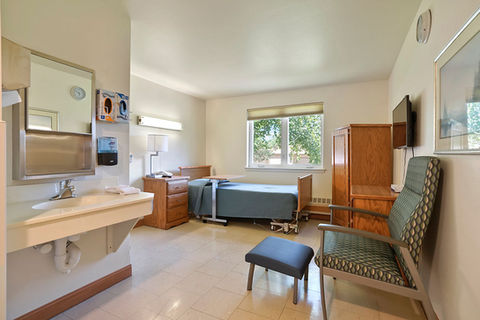
Yes — there are 26 photos of North Shore Health &Amp; Rehab Facility in the photo gallery on this page.

What is the address of North Shore Health &Amp; Rehab Facility?

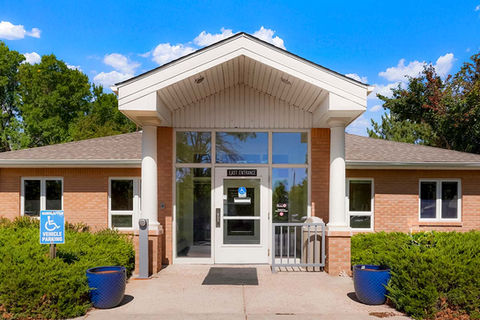
North Shore Health &Amp; Rehab Facility is located at 1365 W 29TH ST.

What is the phone number of North Shore Health &Amp; Rehab Facility?

(970) 667-6111 will put you in contact with the team at North Shore Health &Amp; Rehab Facility.

Explore Open Rooms
1 Contact details
2 What type of senior care service are you looking for?
3 What budget do you have in mind for senior care?
4 How soon do you need to find care?
5 Additional details

Thank you for your interest!

Our team will be in touch shortly to help with next steps.