Explore Open Rooms

1 Contact details
2 What type of senior care service are you looking for?
3 What budget do you have in mind for senior care?
4 How soon do you need to find care?
5 Additional details

Thank you for your interest!

Our team will be in touch shortly to help with next steps.

Nursing Home

Northbridge Health Care Center

Nursing Home

Northbridge Health Care Center

2875 Main St, Bridgeport, CT 06606 View map
Overview of Northbridge Health Care Center

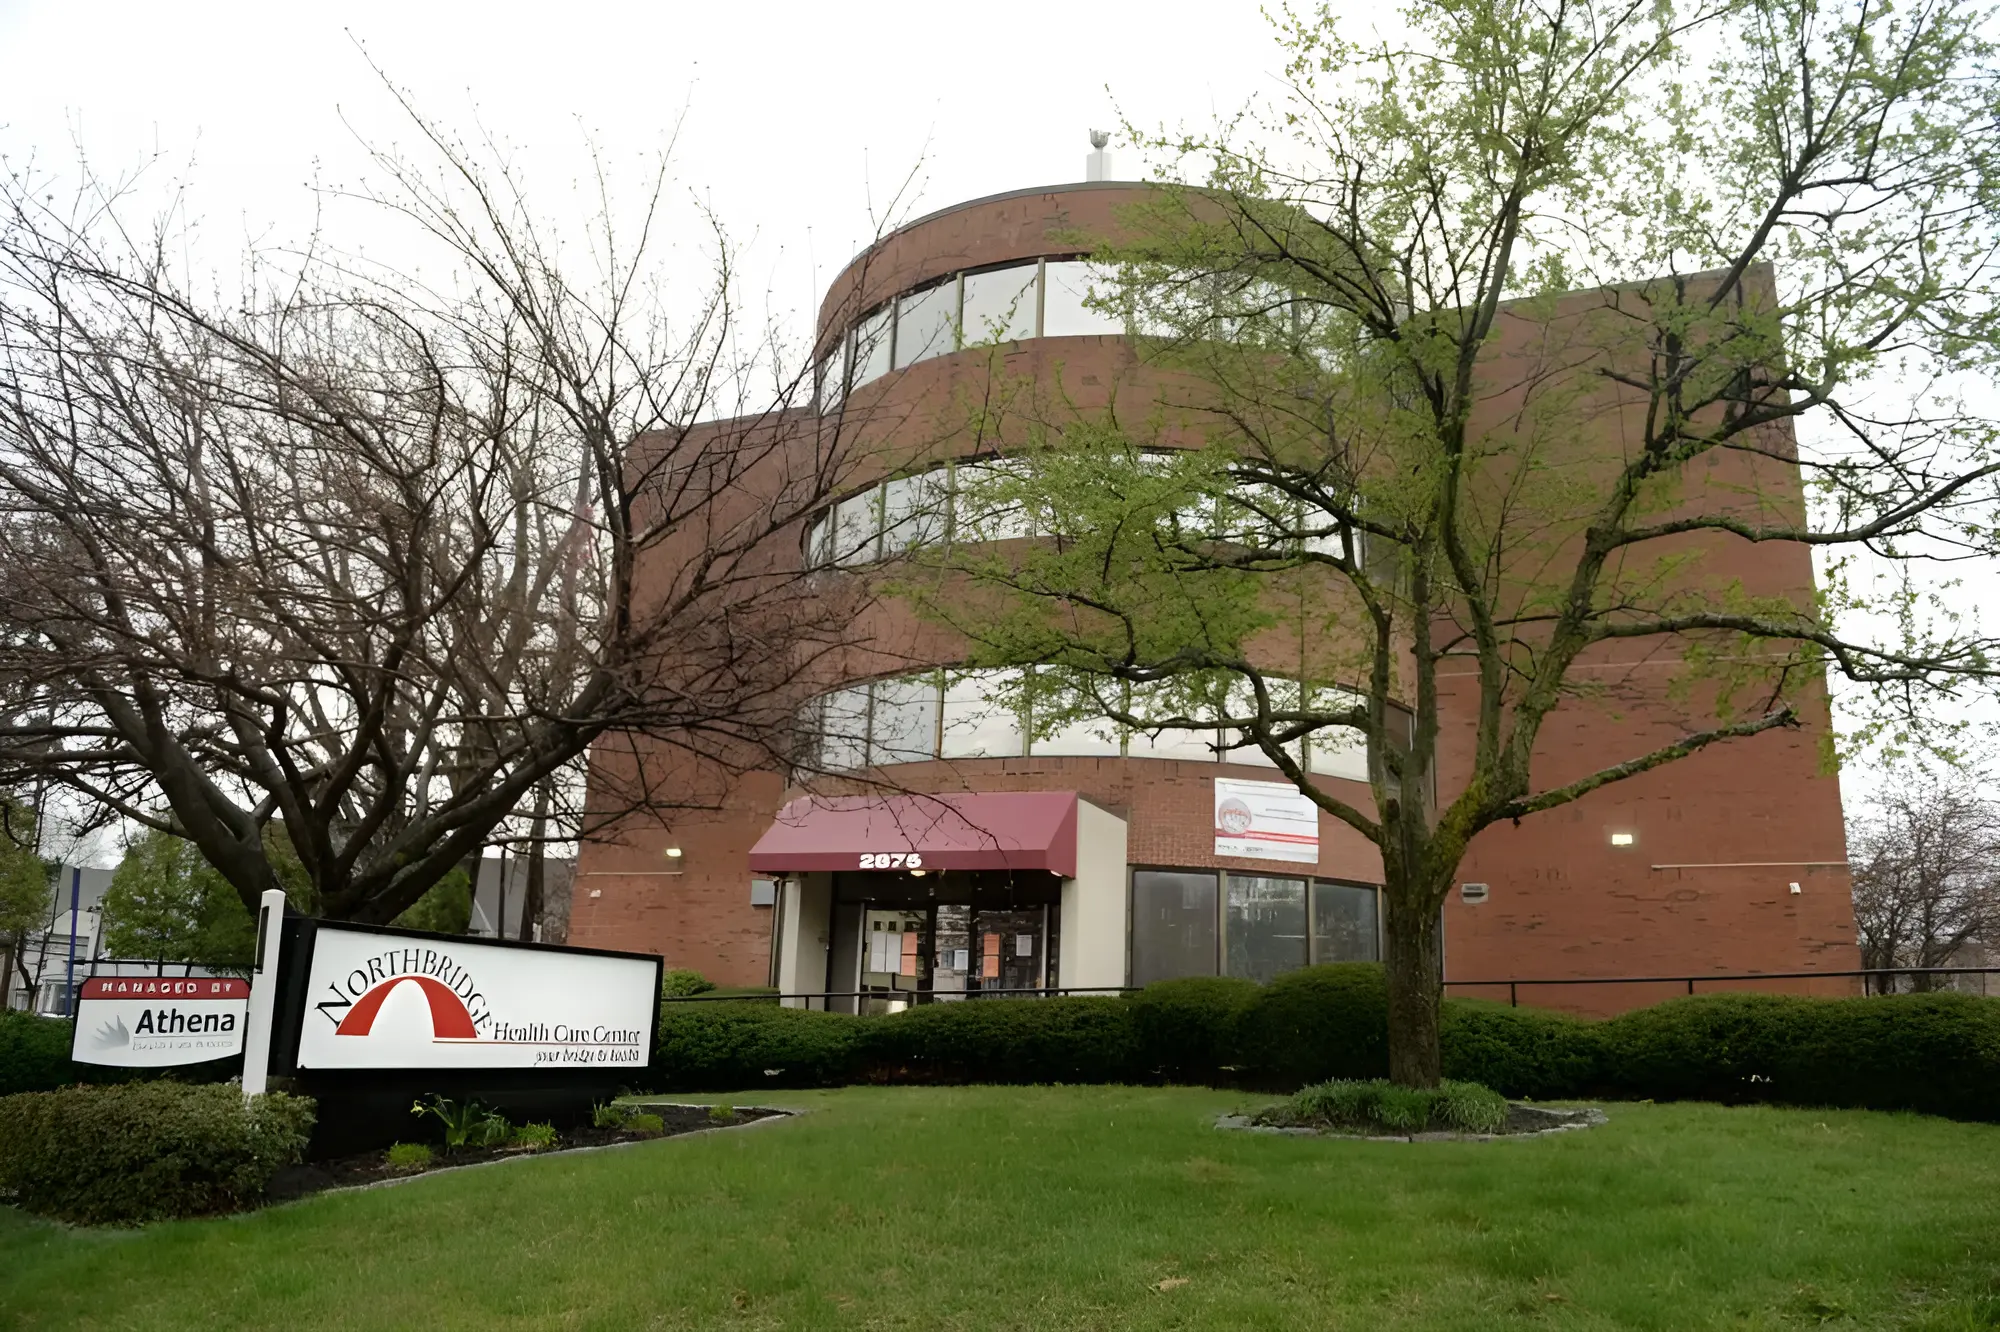
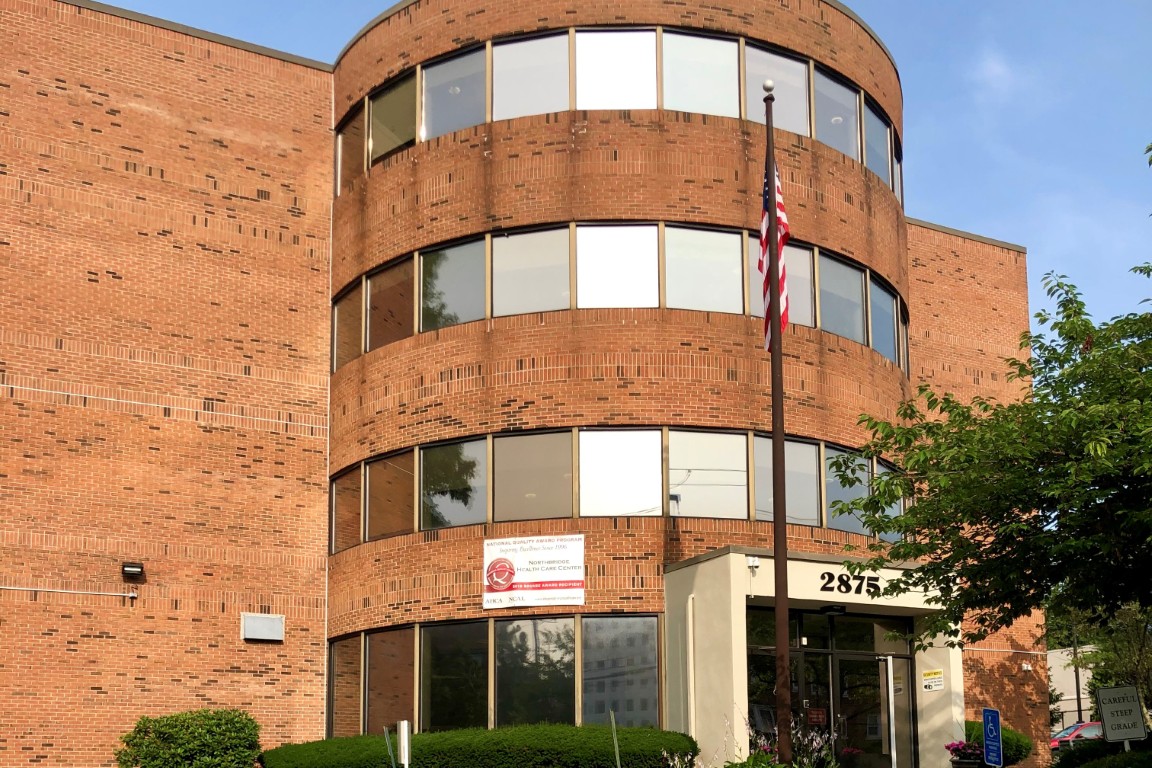
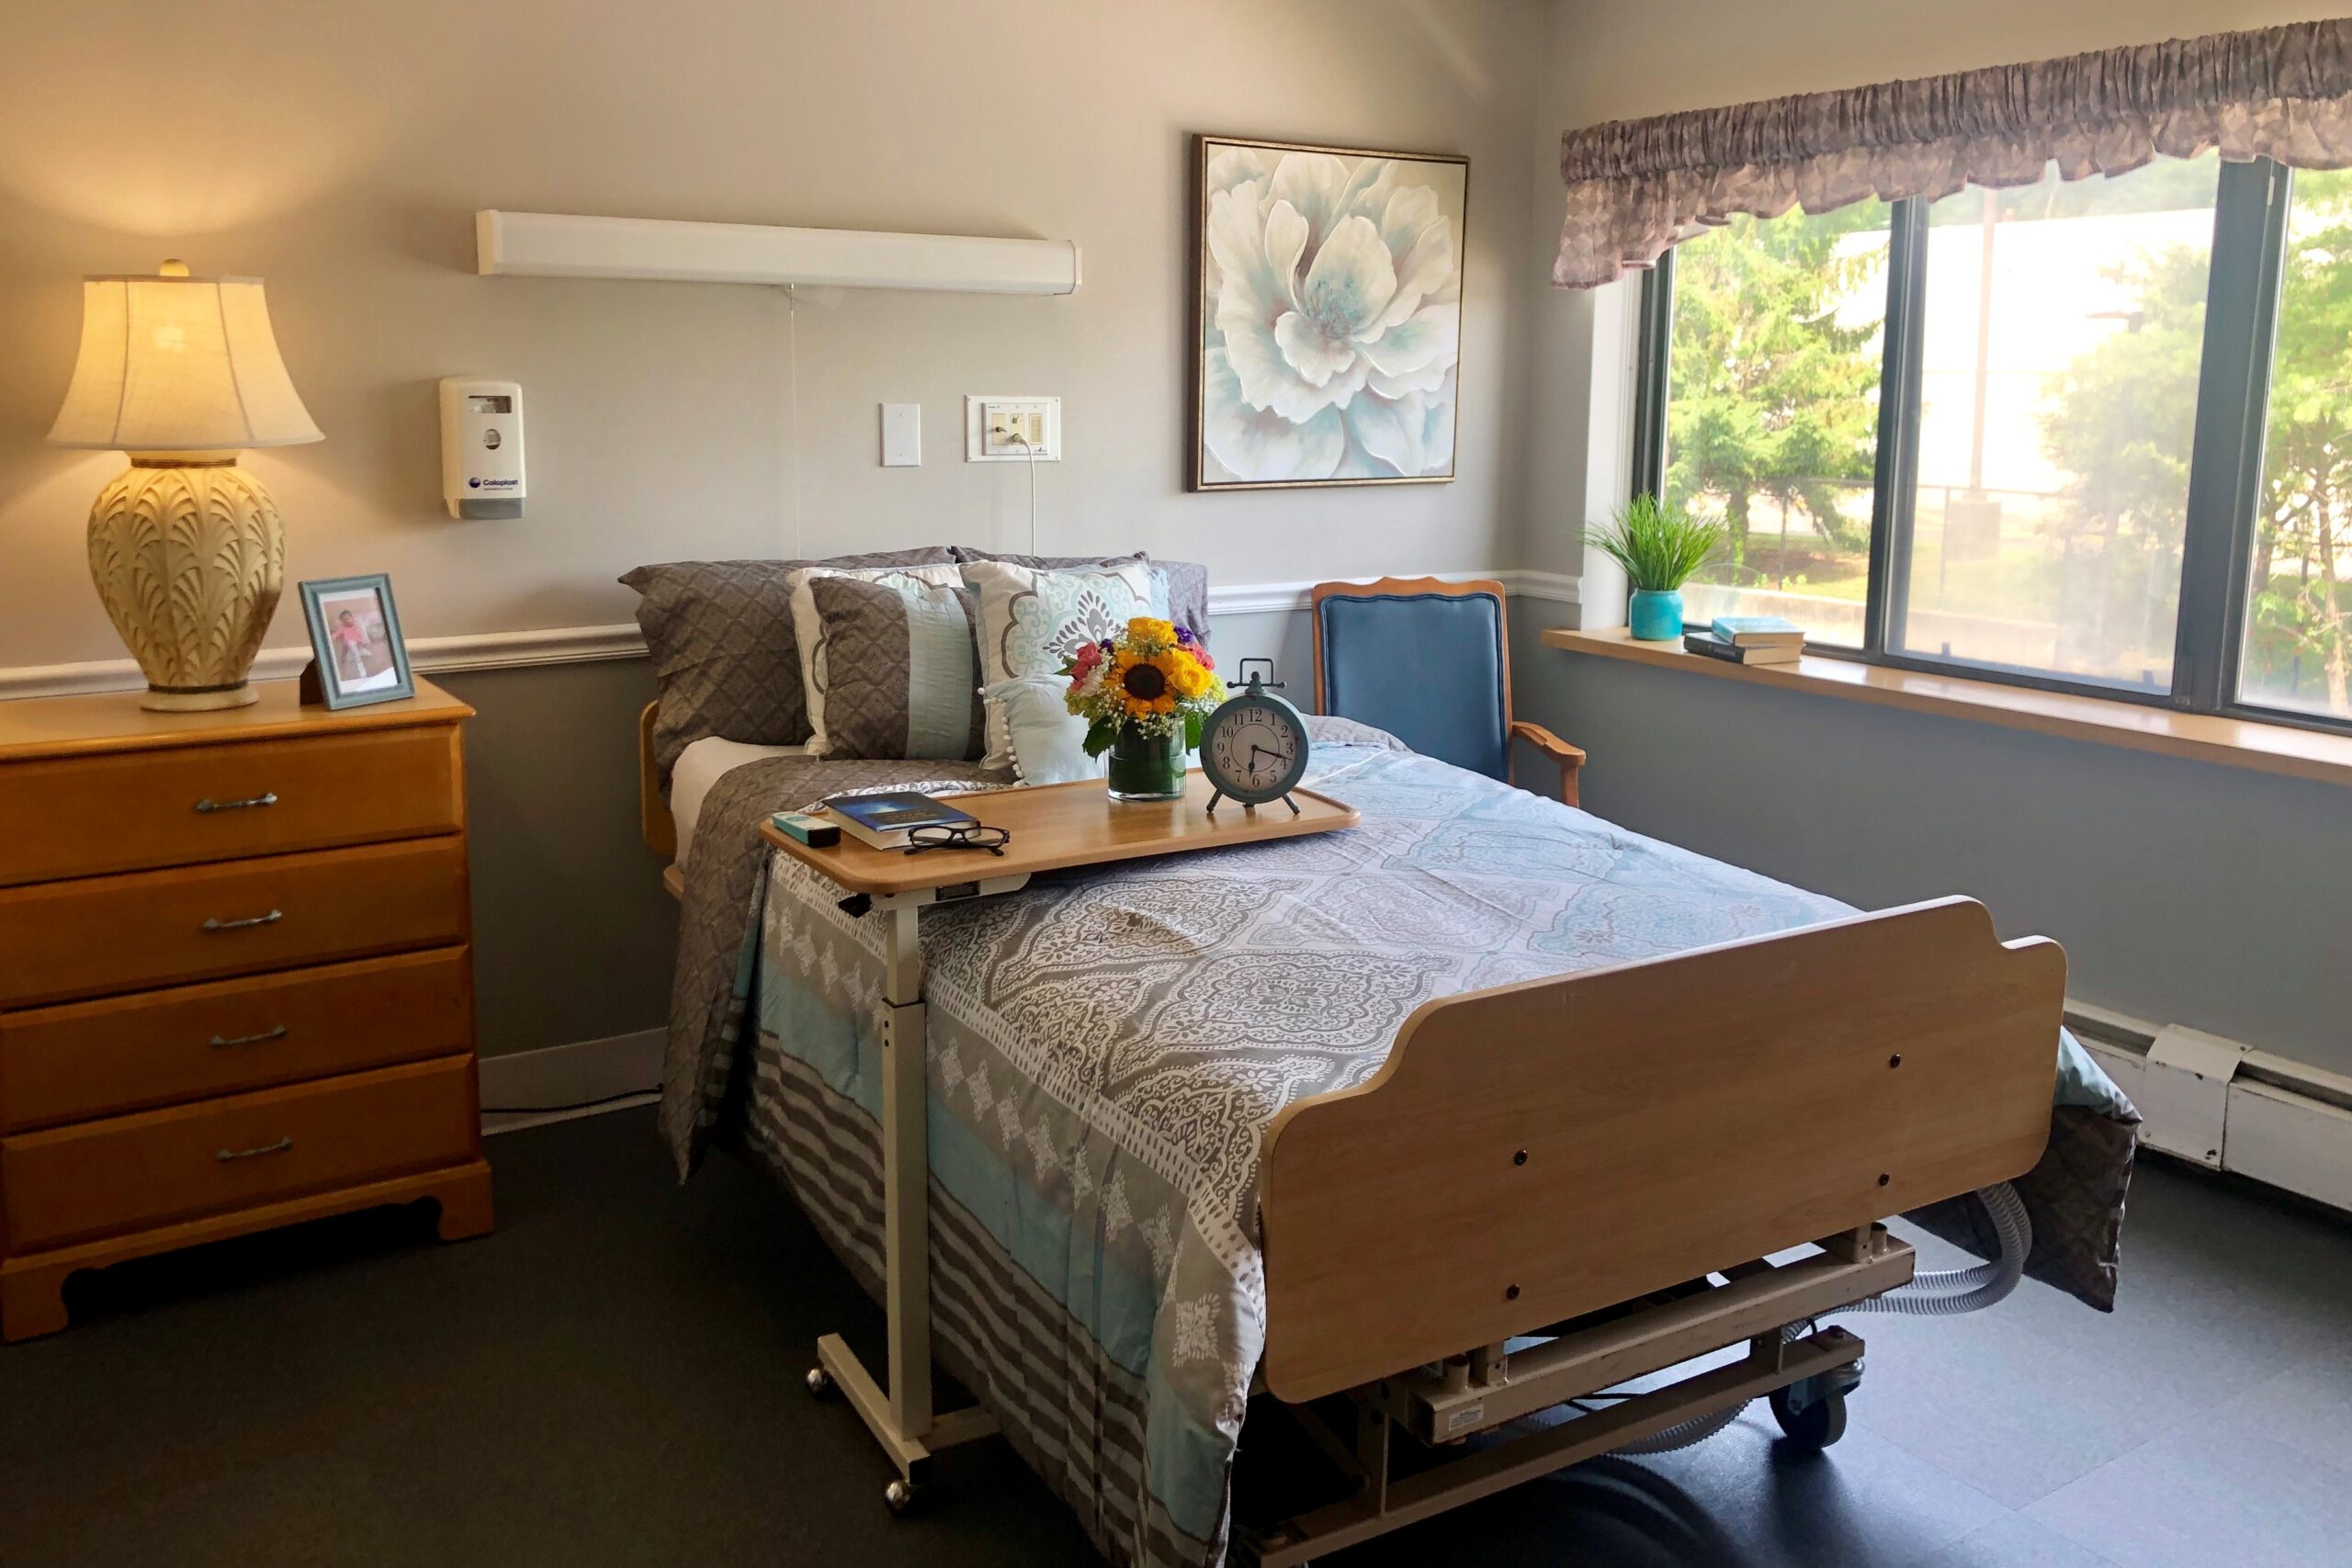
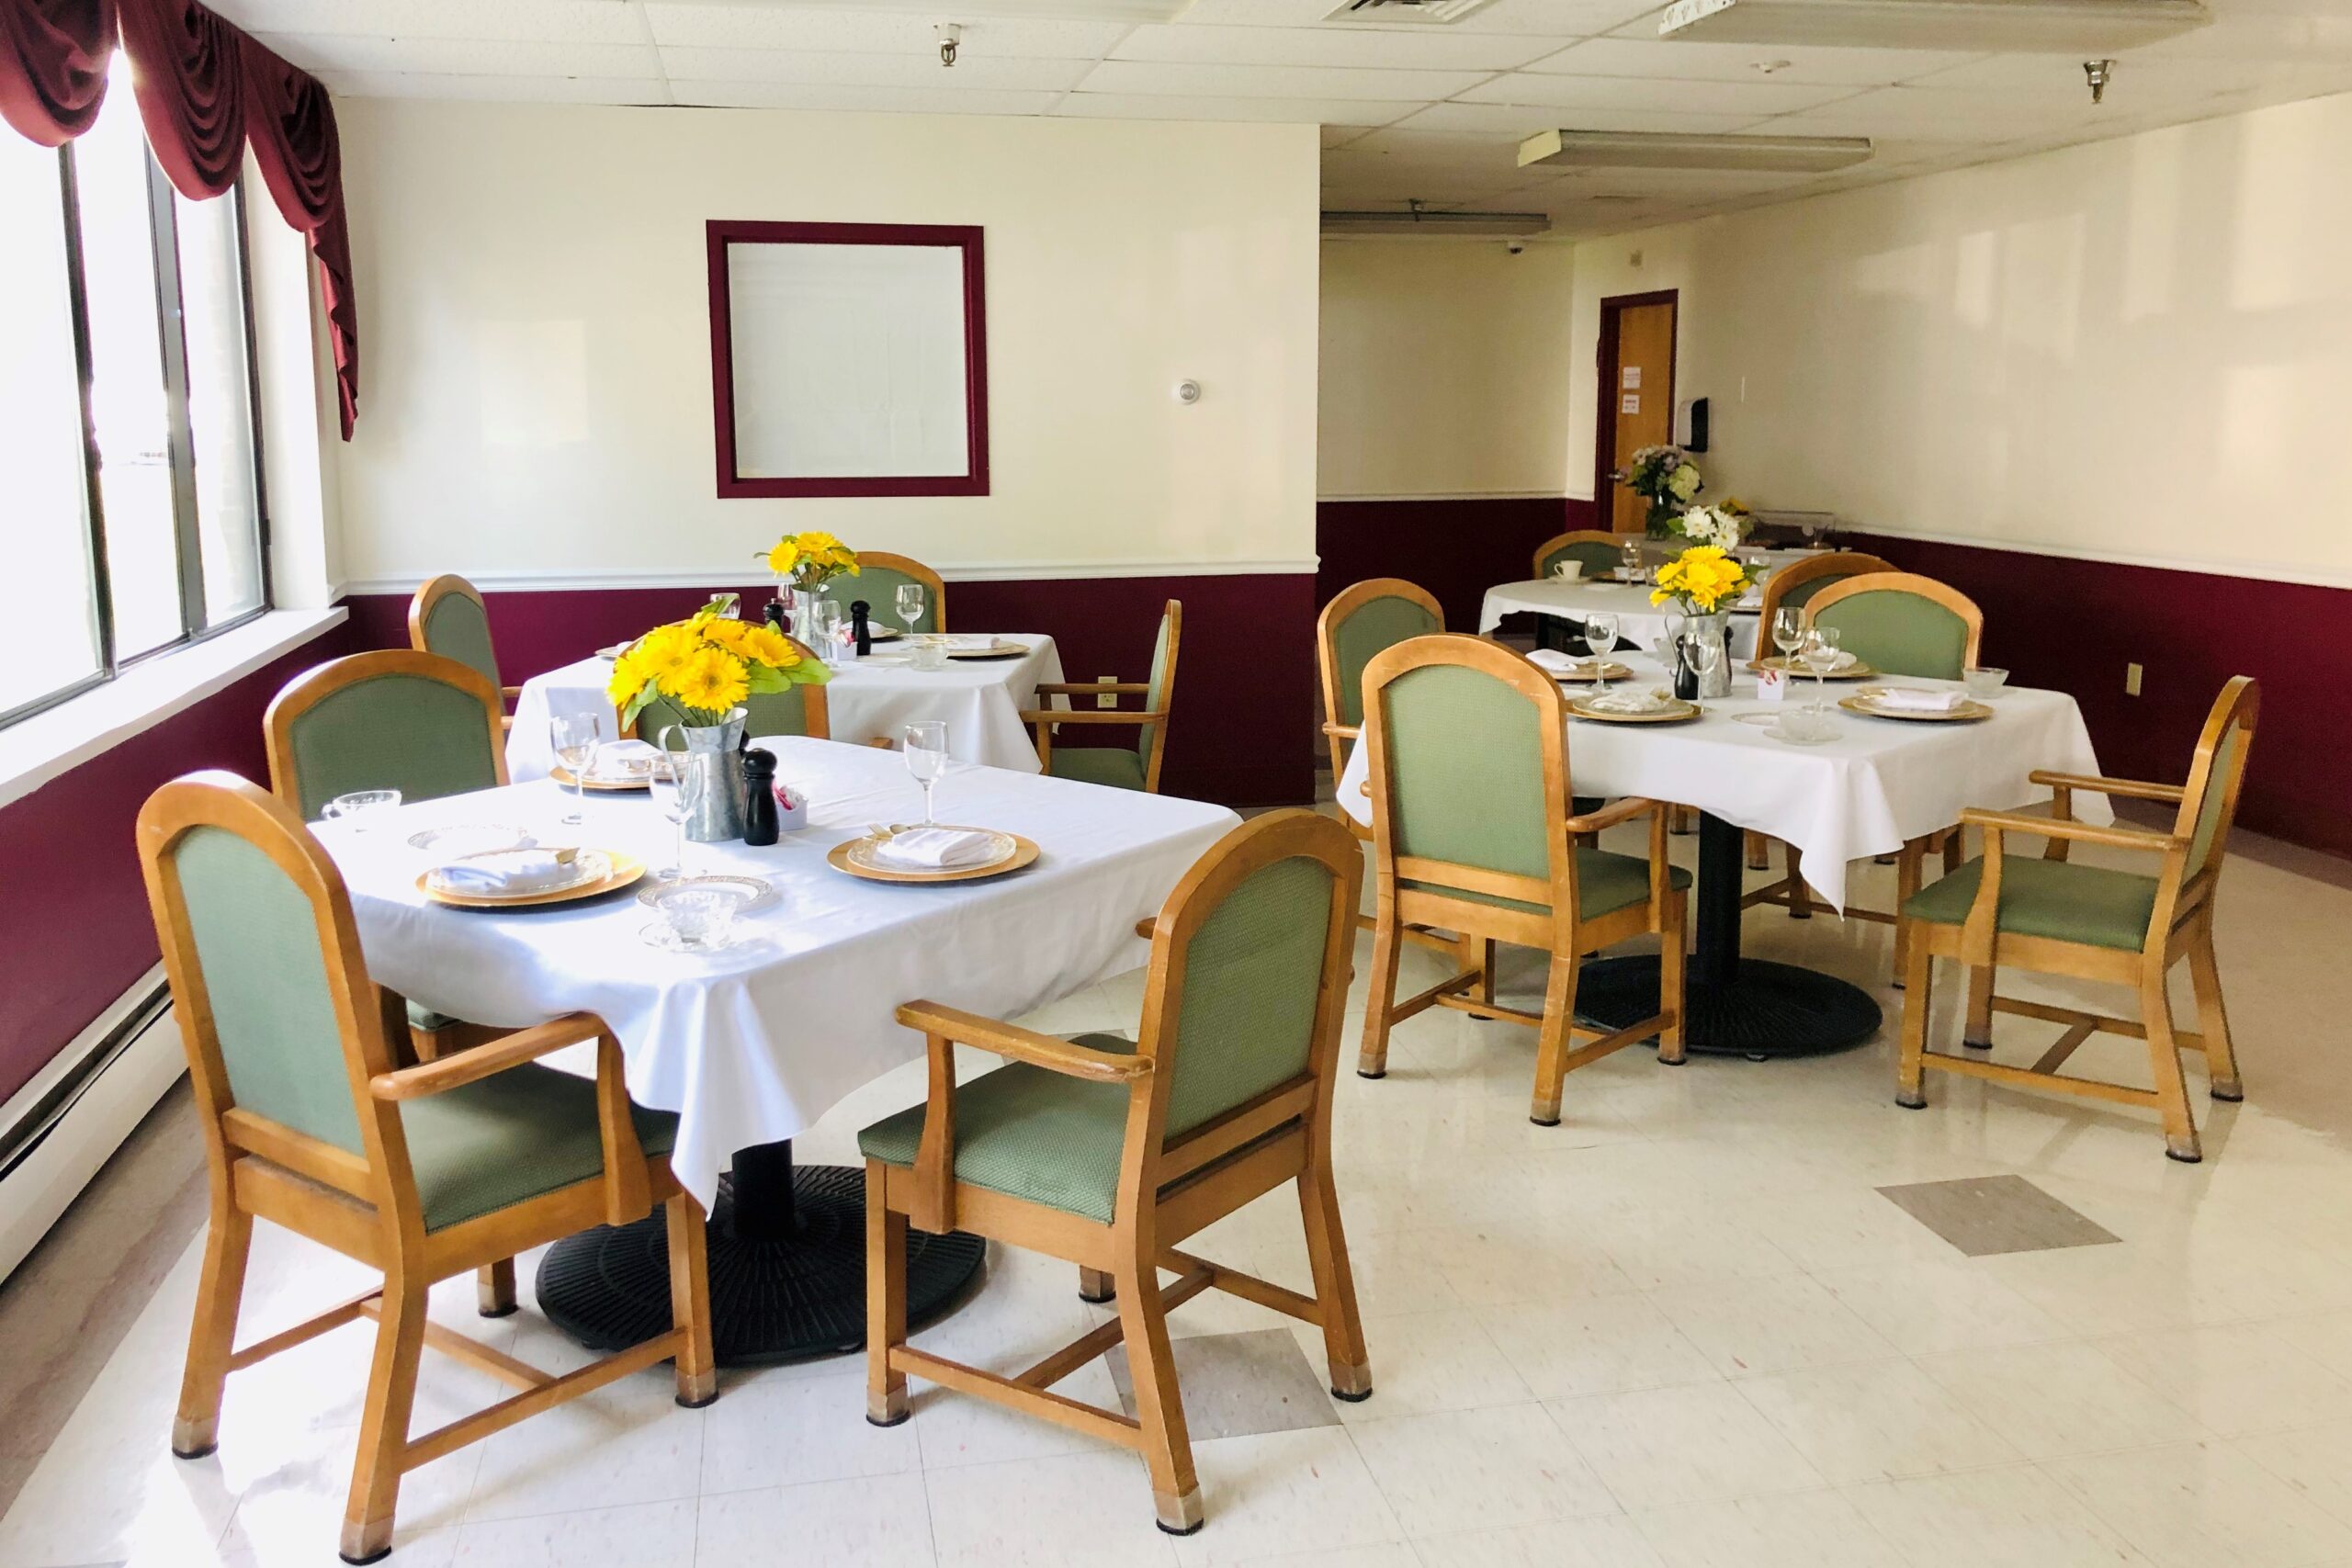
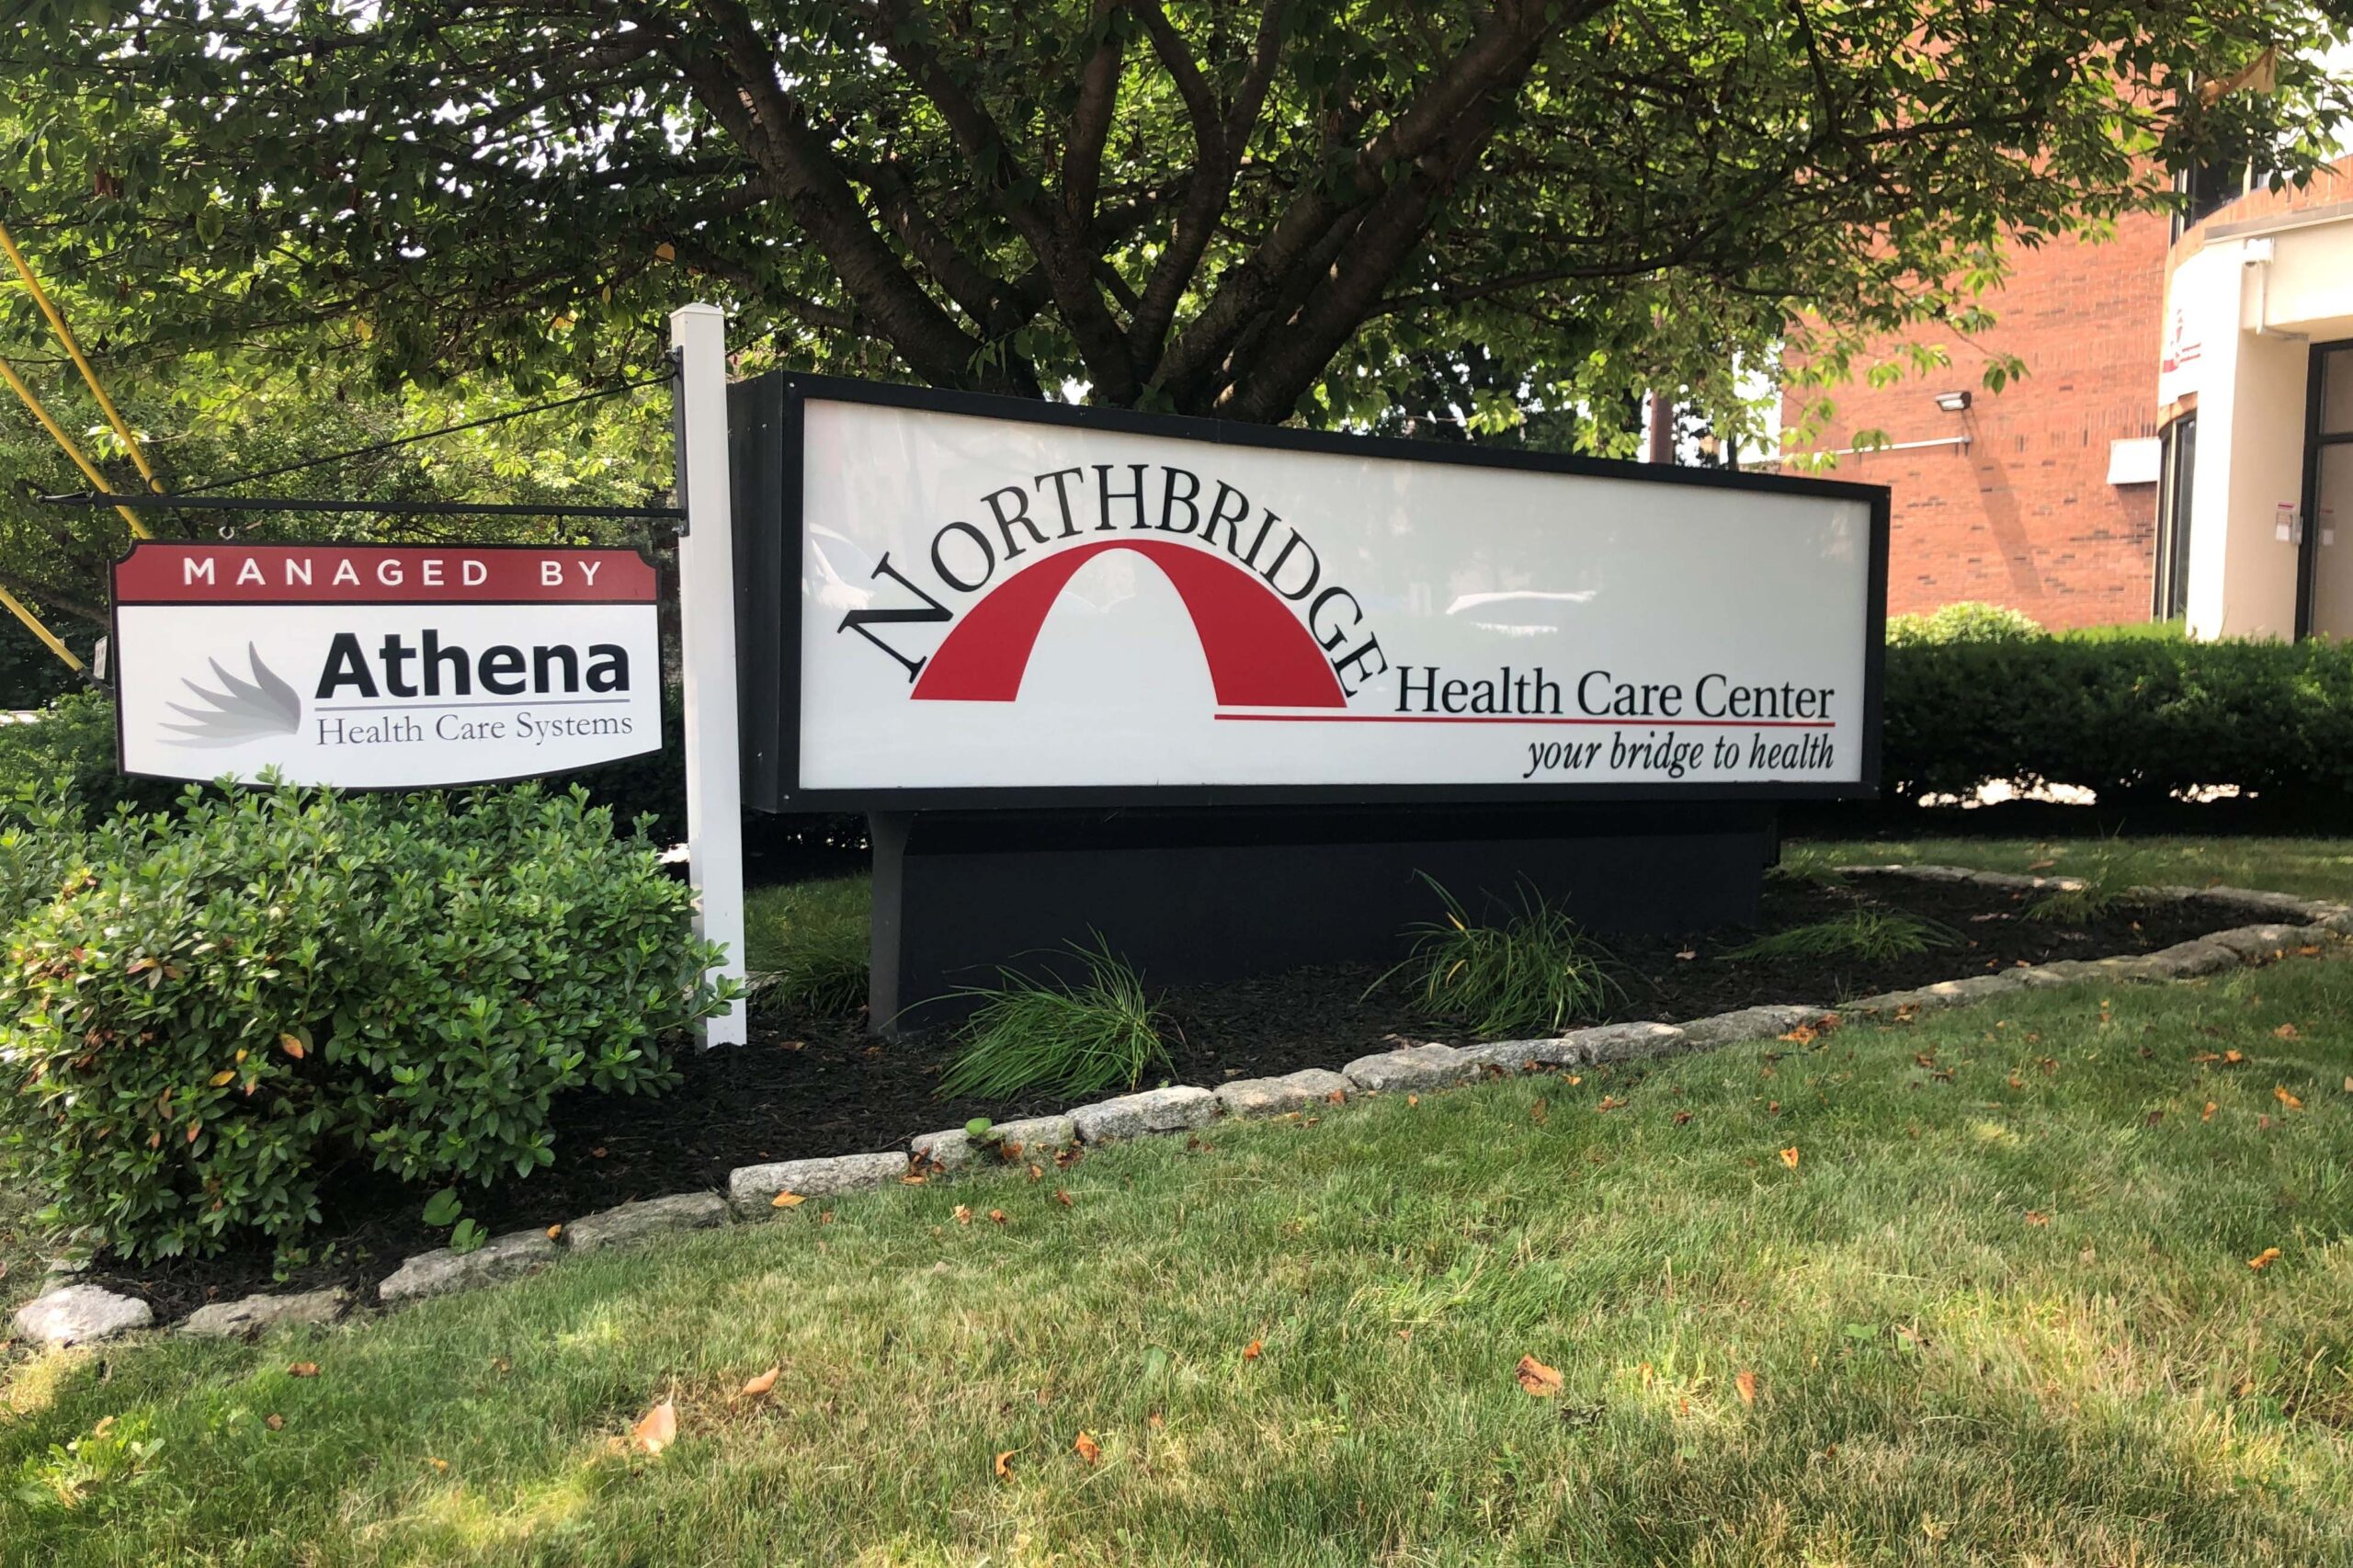
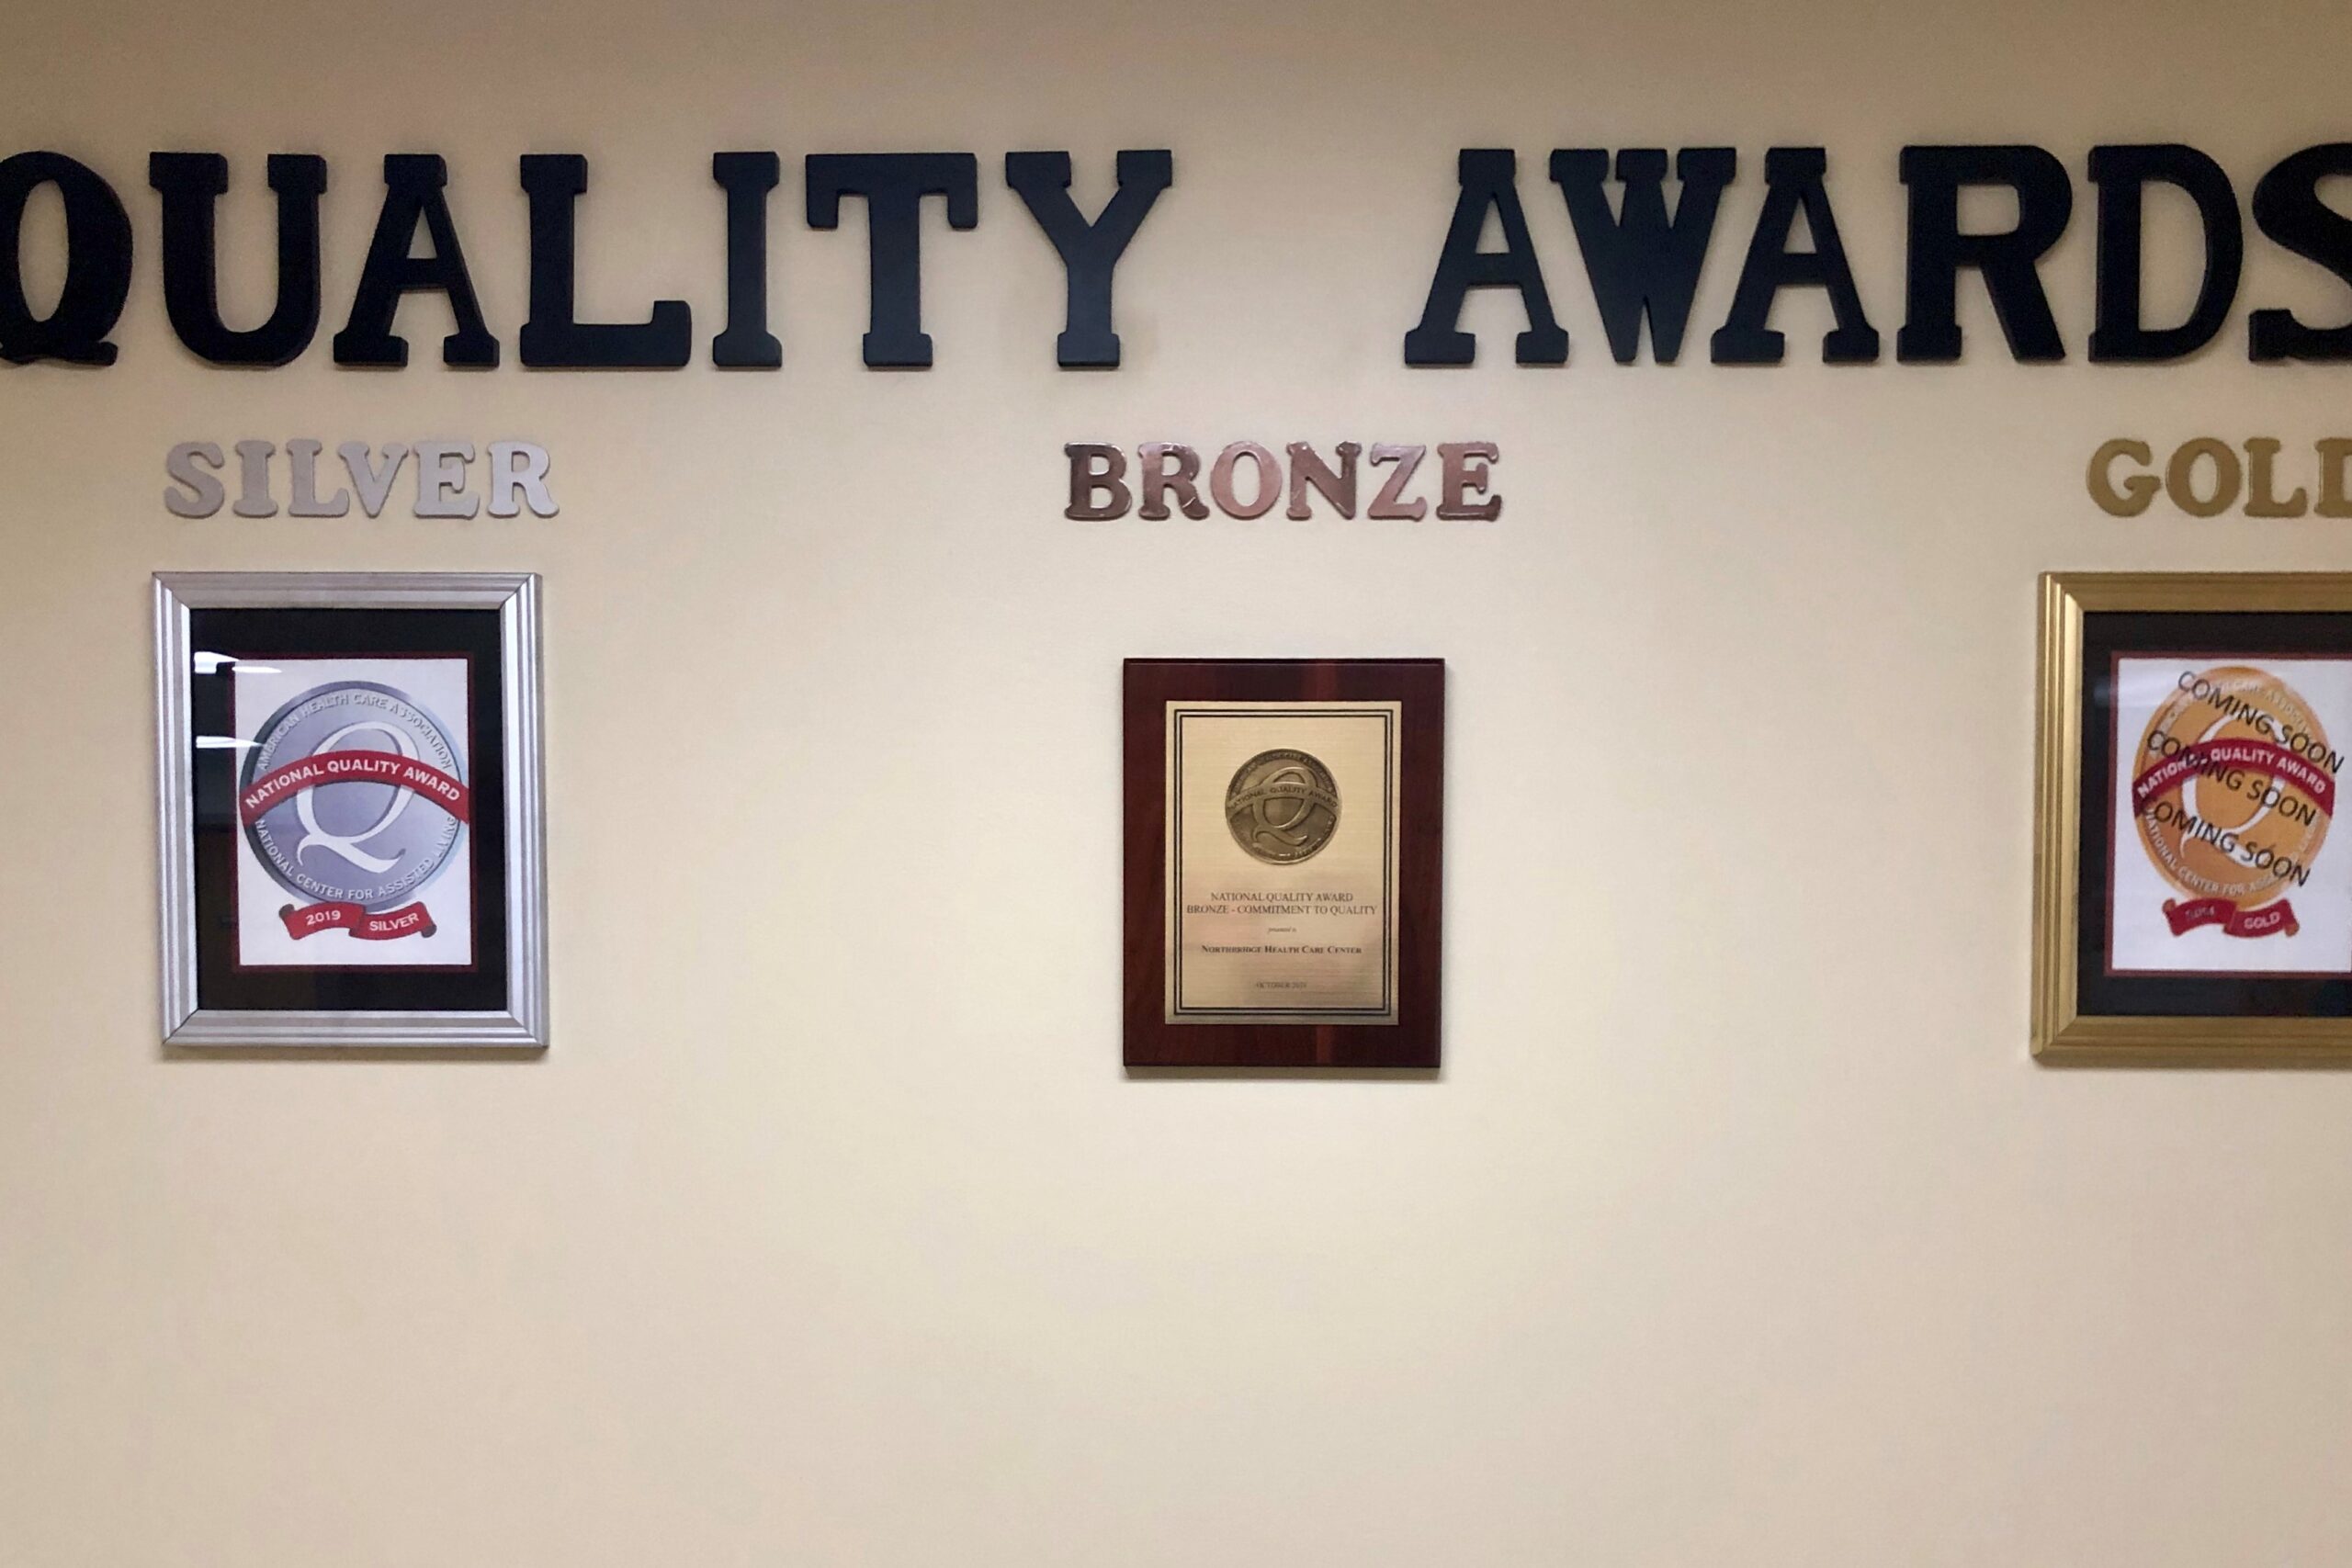
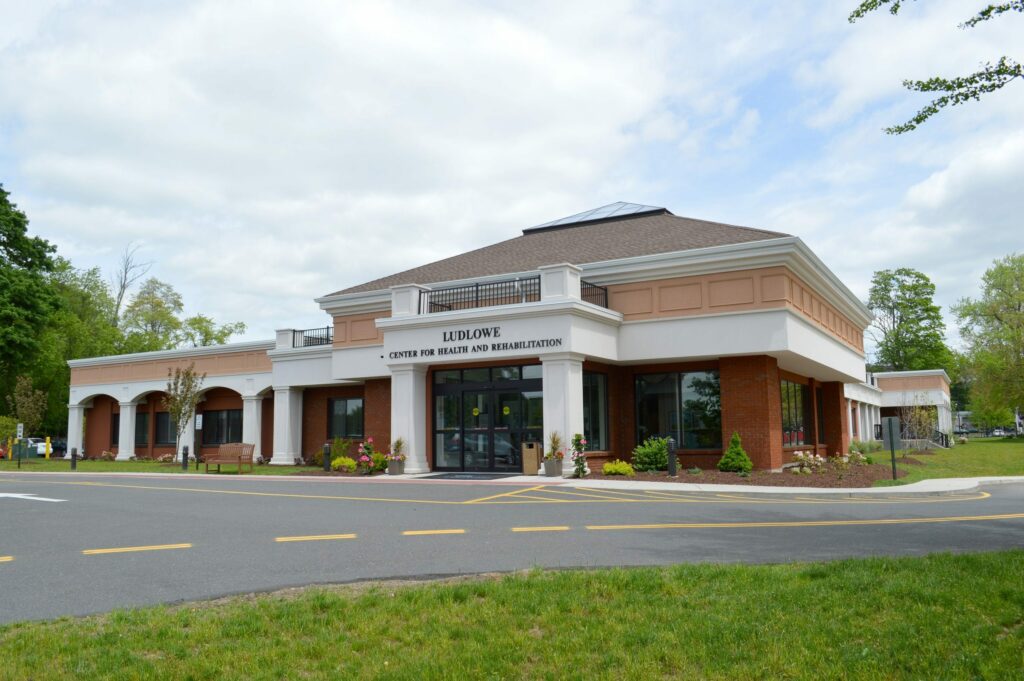
Northbridge Health Care Center is a haven for seniors in Bridgeport, Connecticut. They provide top notch senior living experience through exceptional healthcare, support, and assistance, and they have been recognized with multiple awards and certifications from Medicare and Medicaid. They provide a comprehensive range of senior housing and healthcare options, including skilled nursing care, post-hospital care and recovery, assisted living, and hospice care.

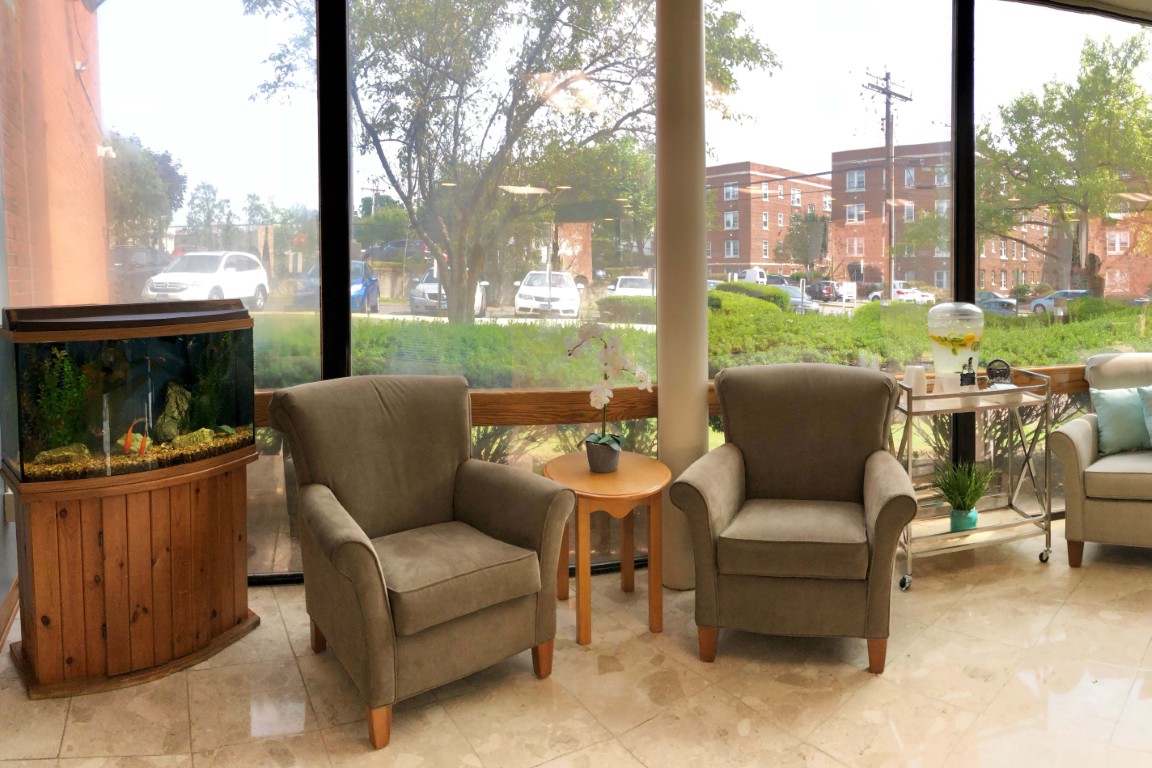
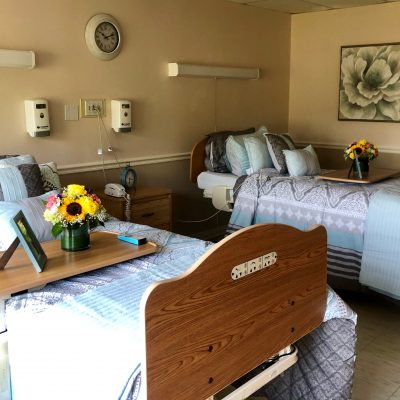
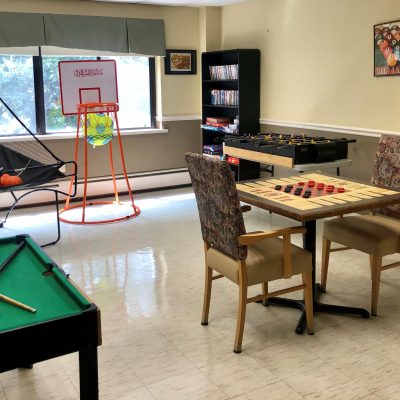
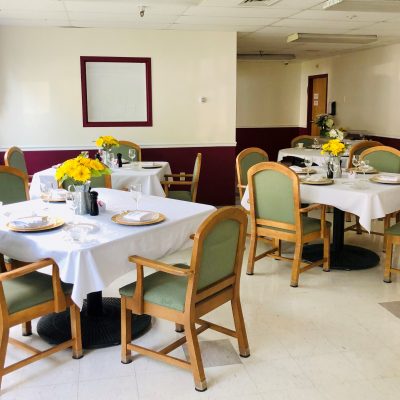
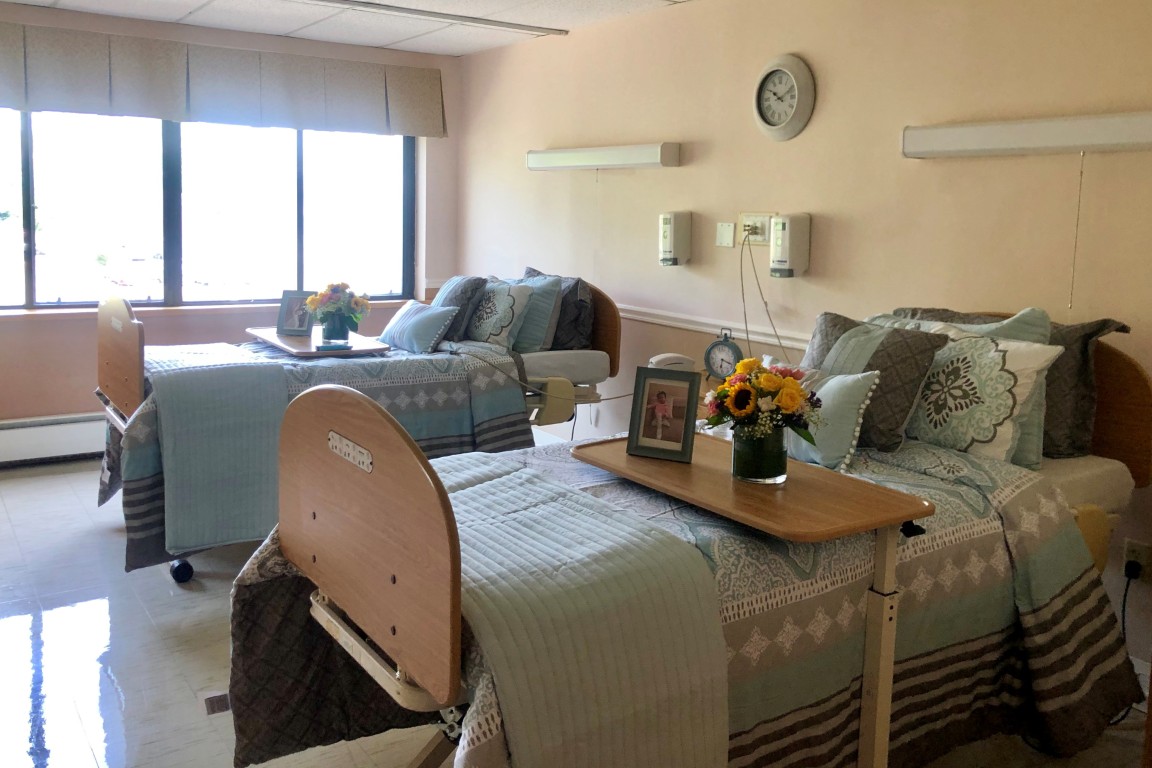
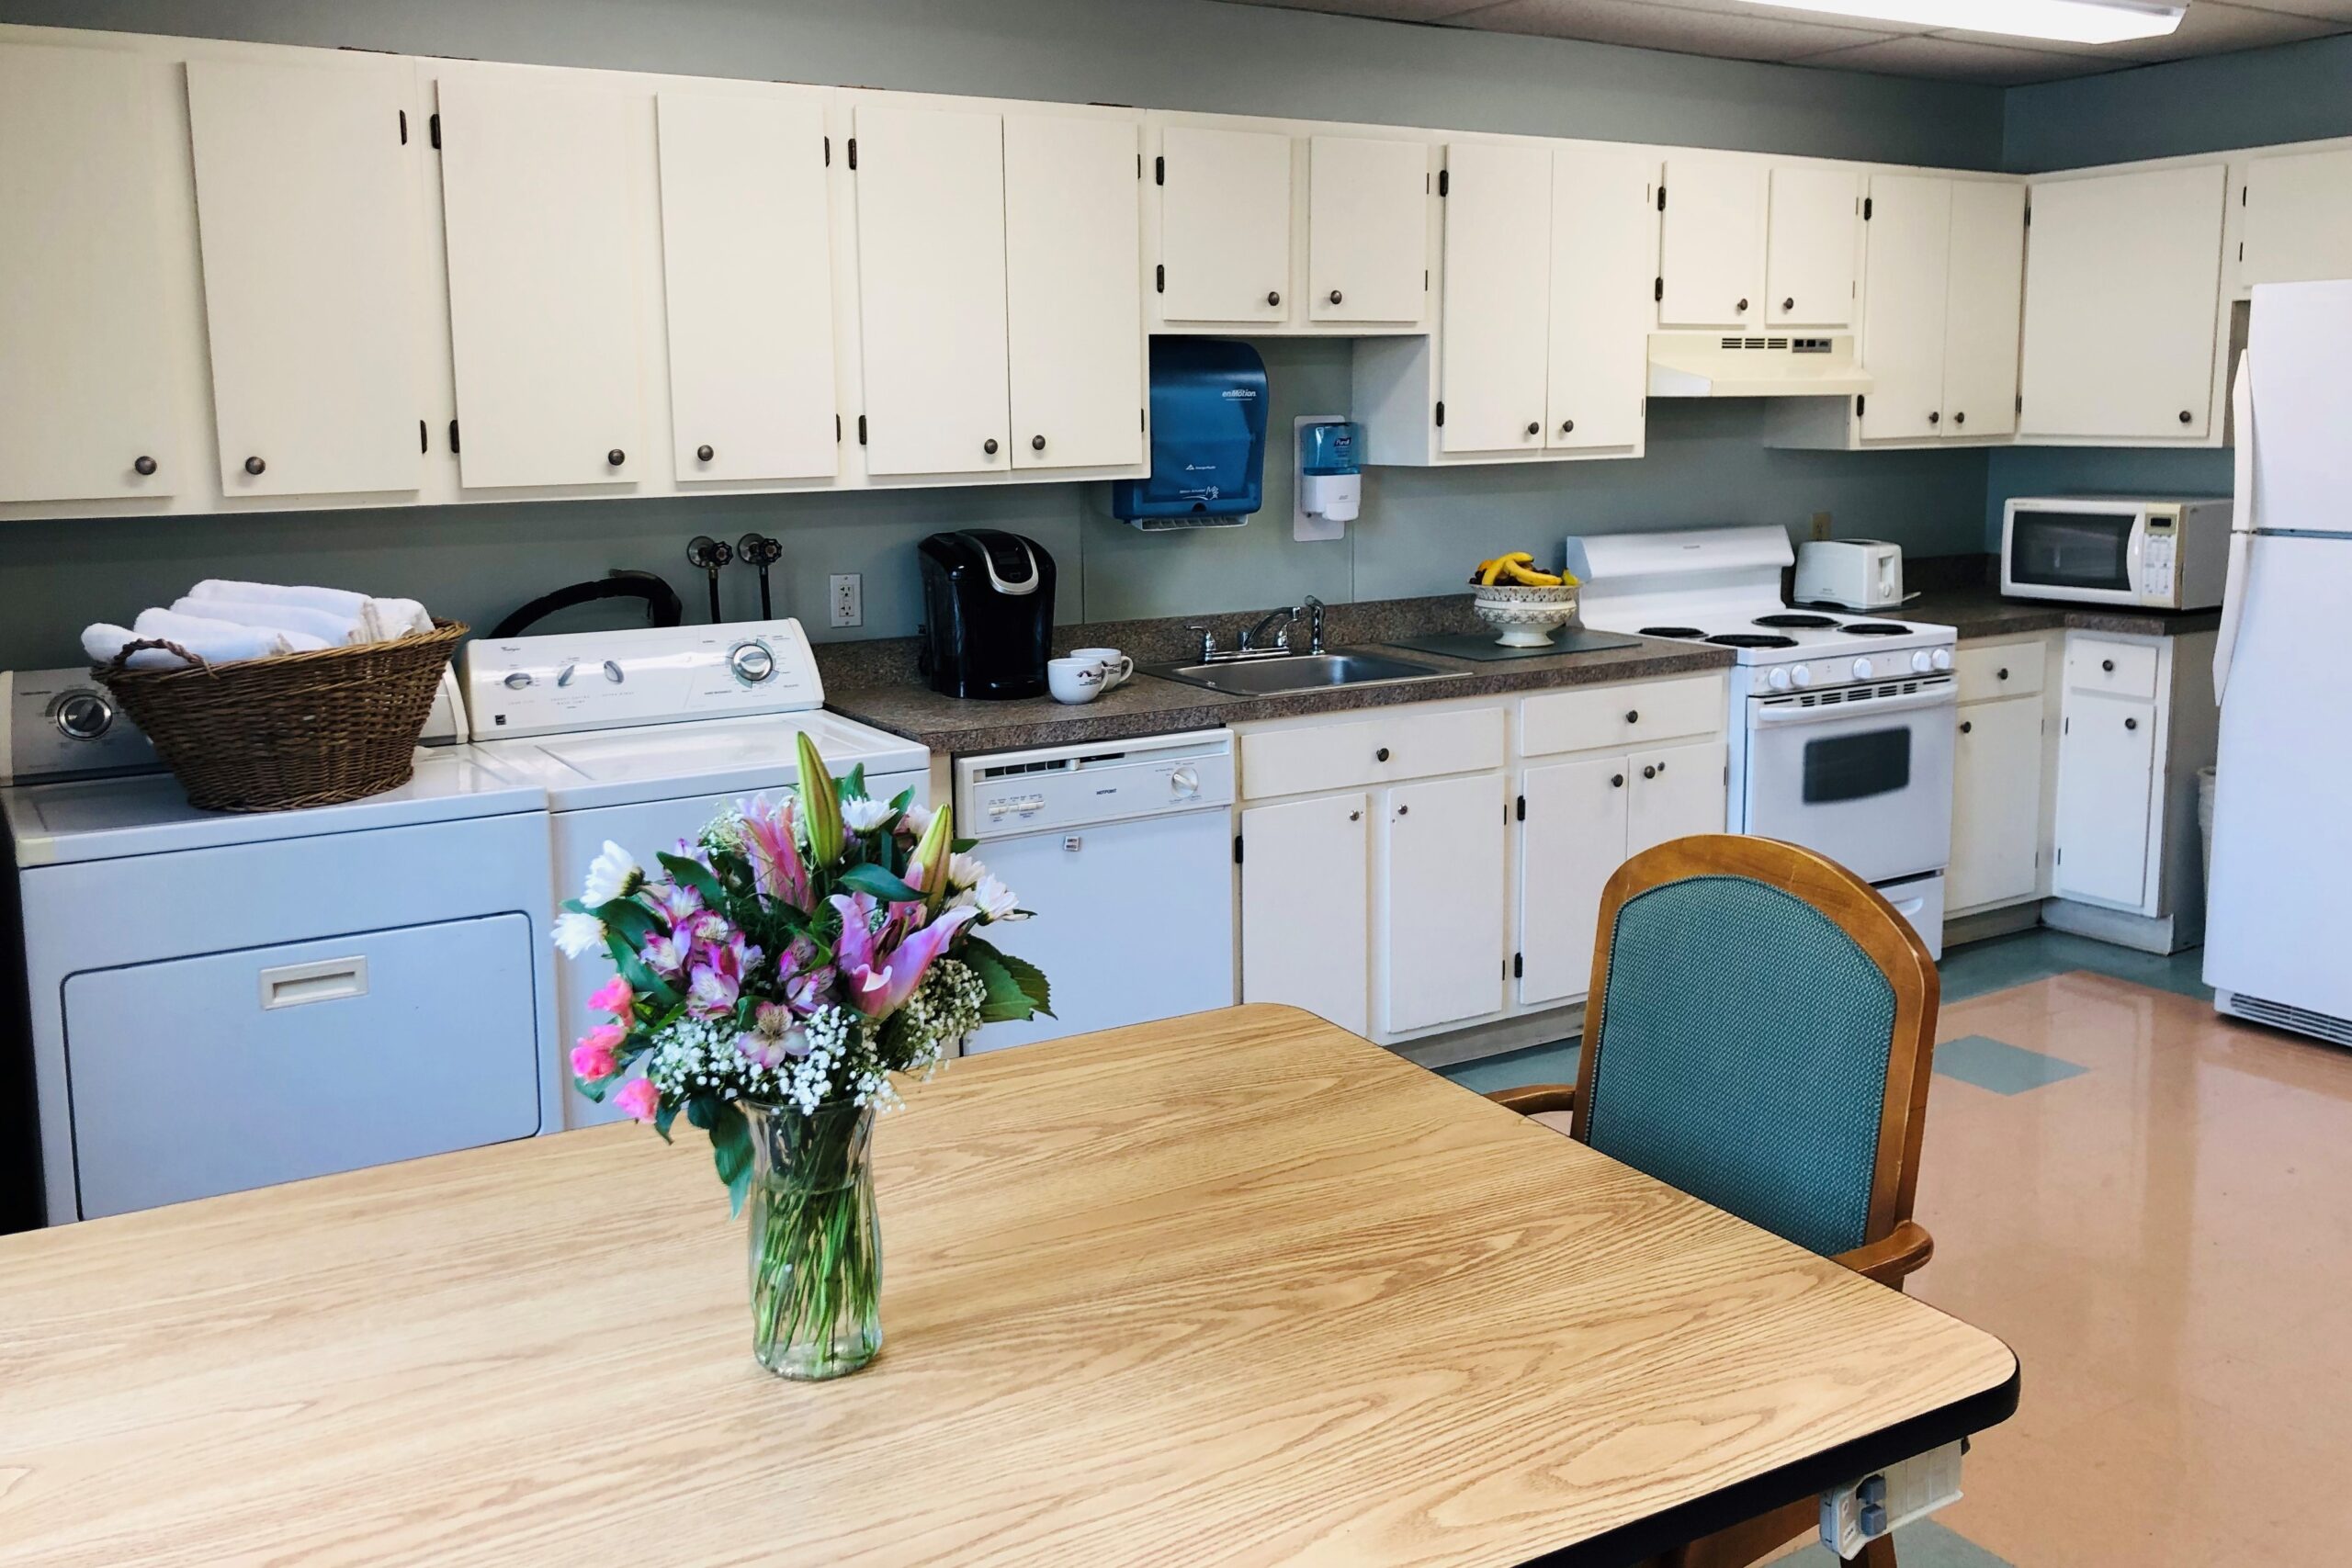
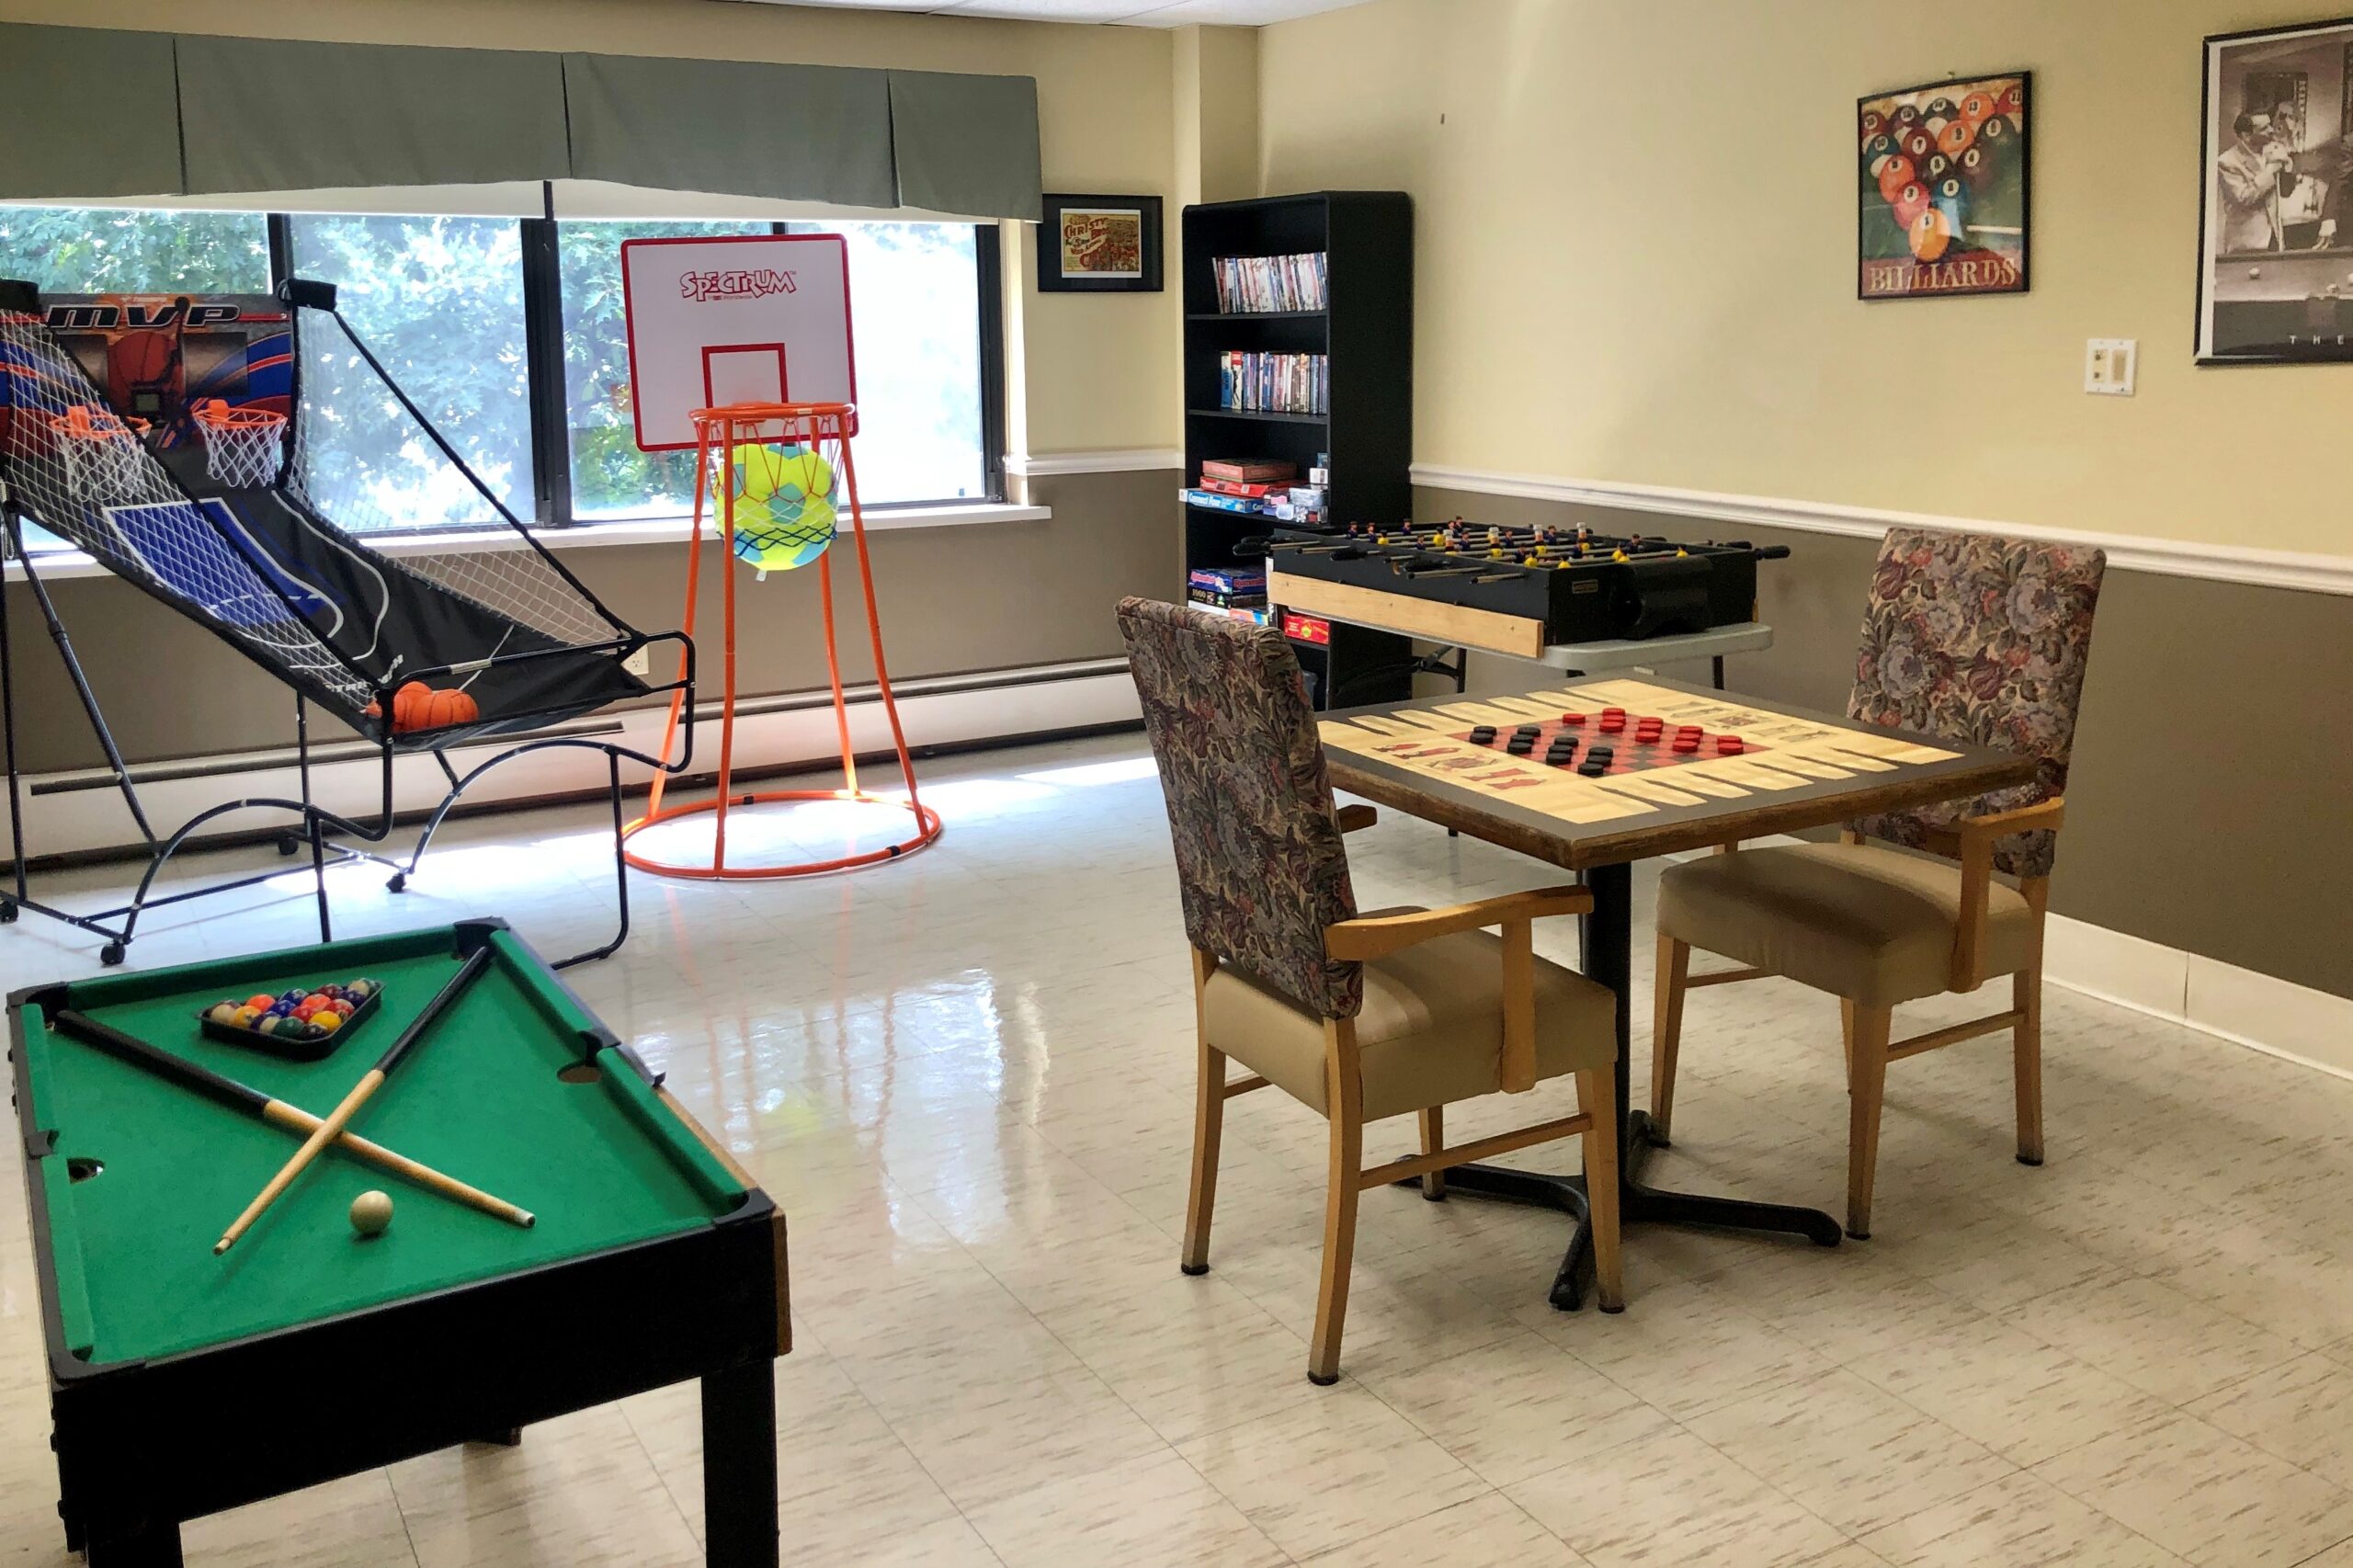
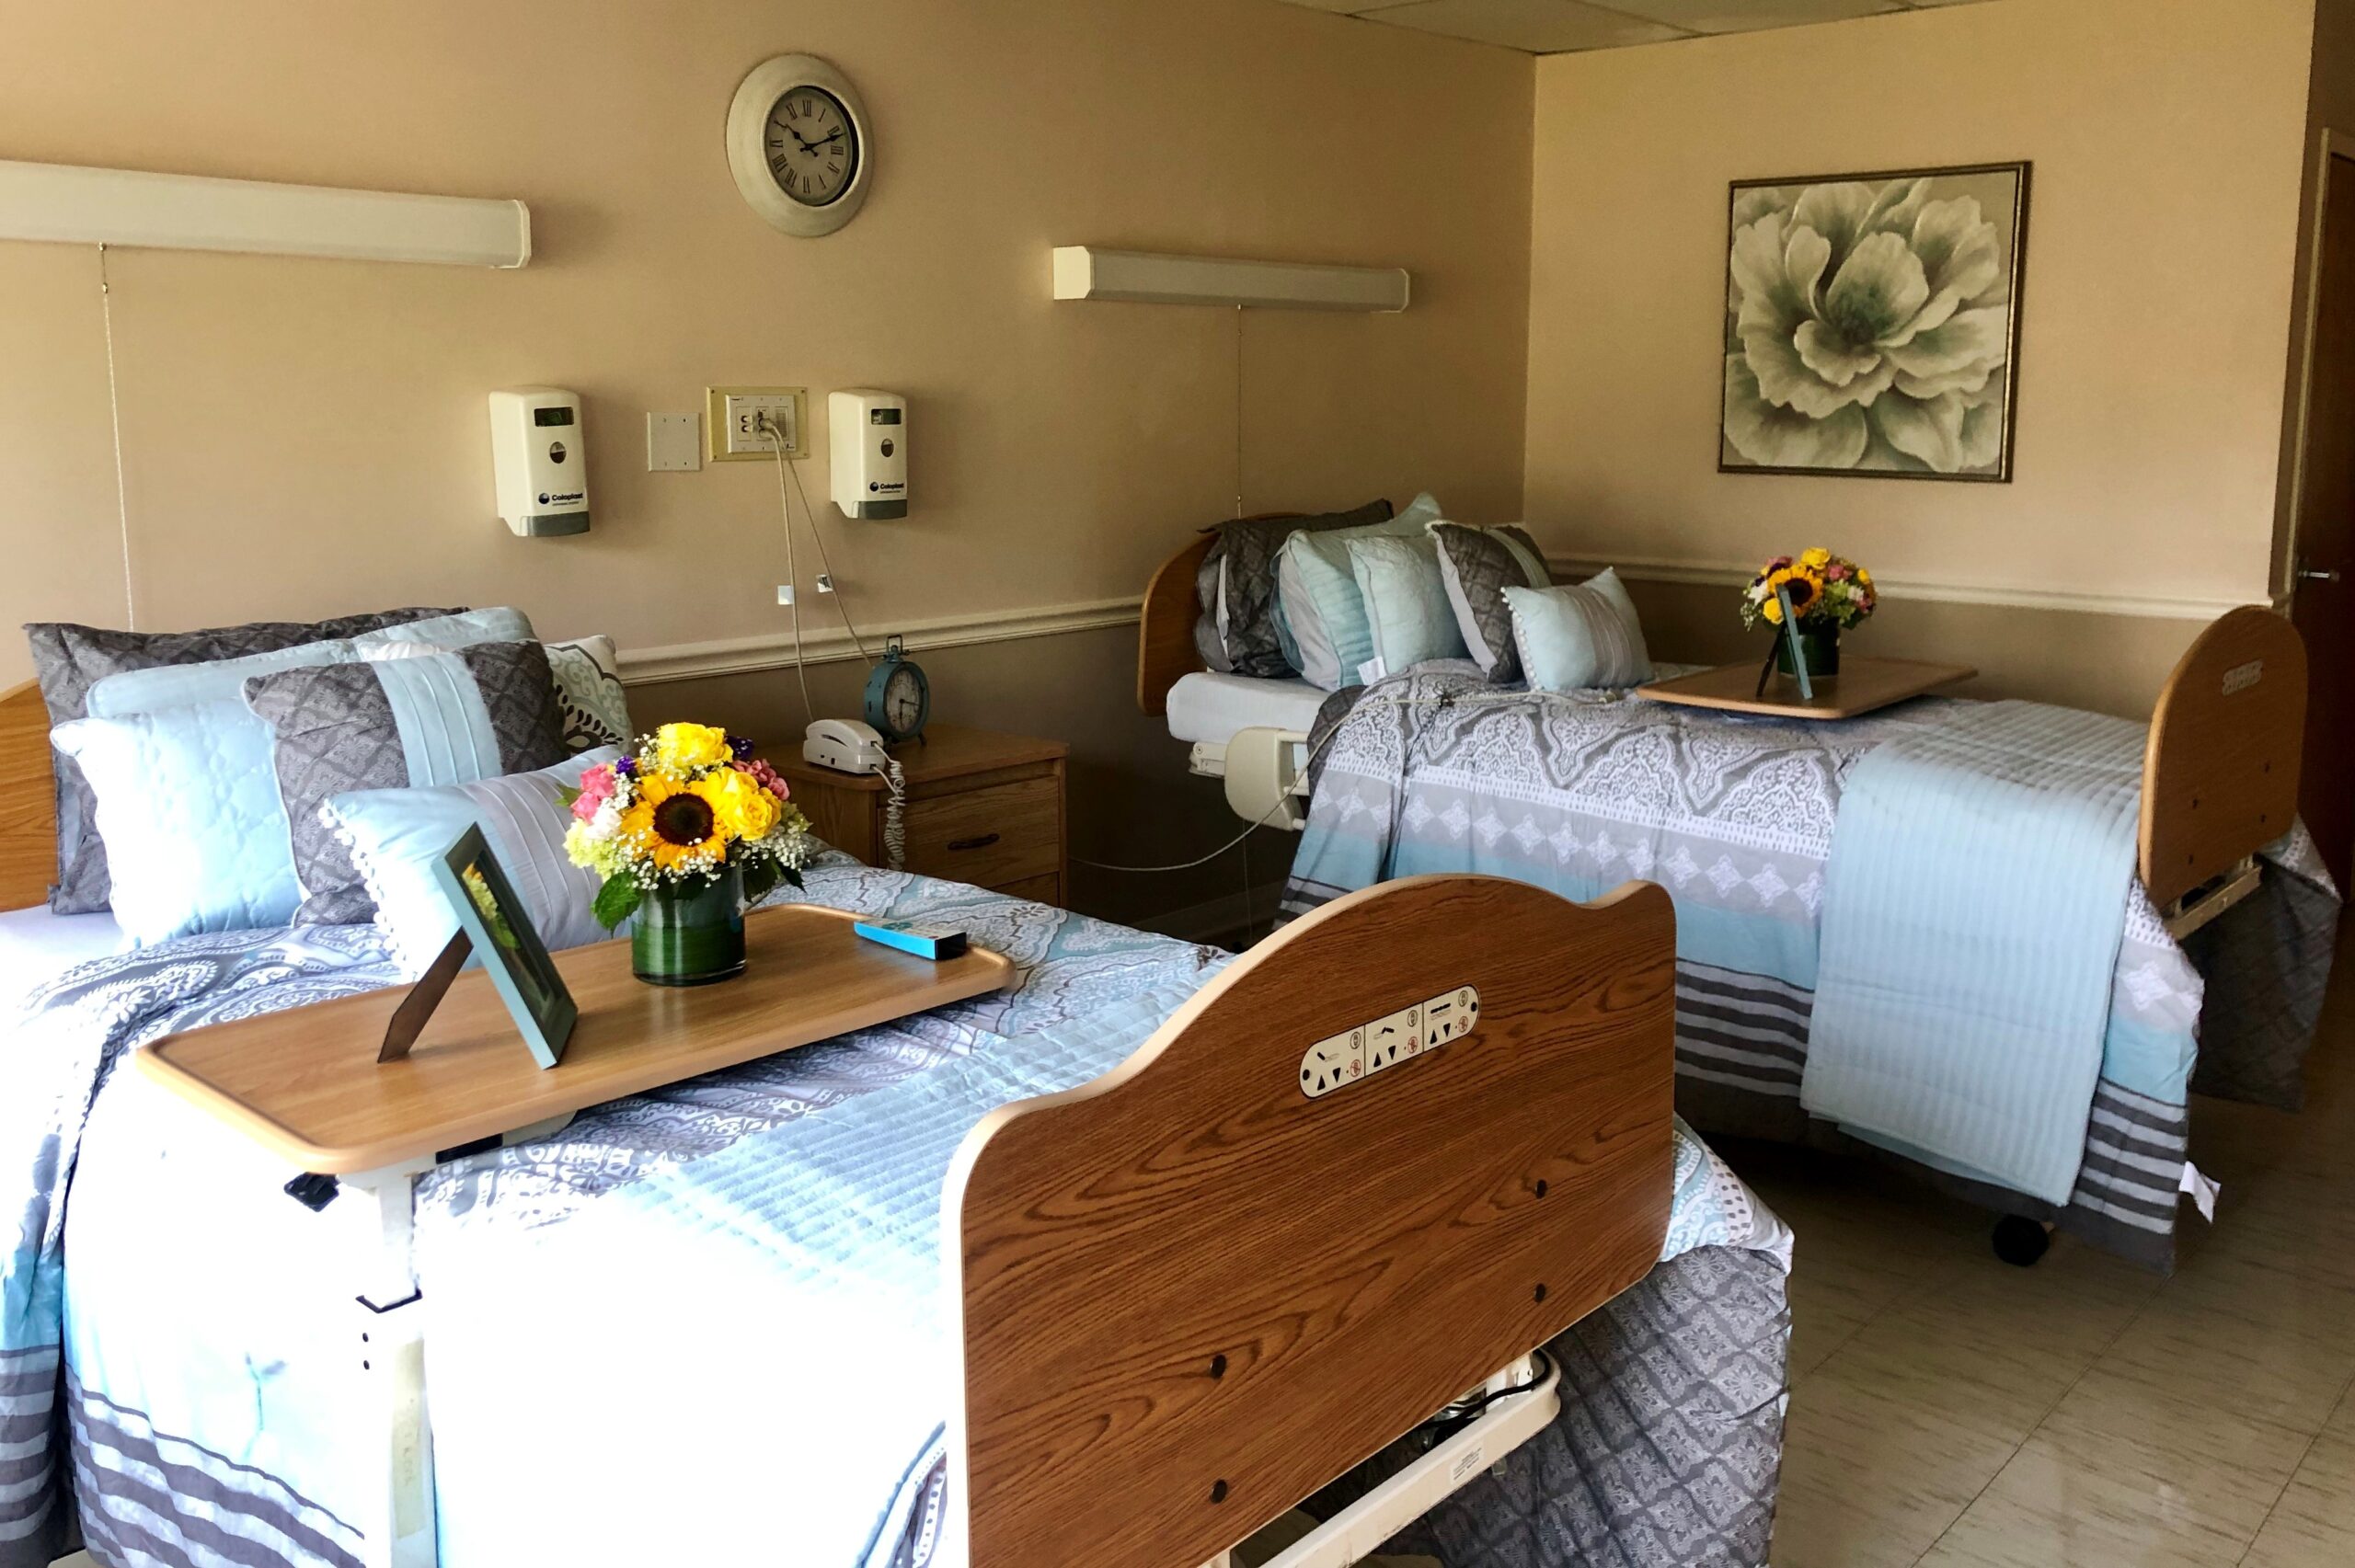
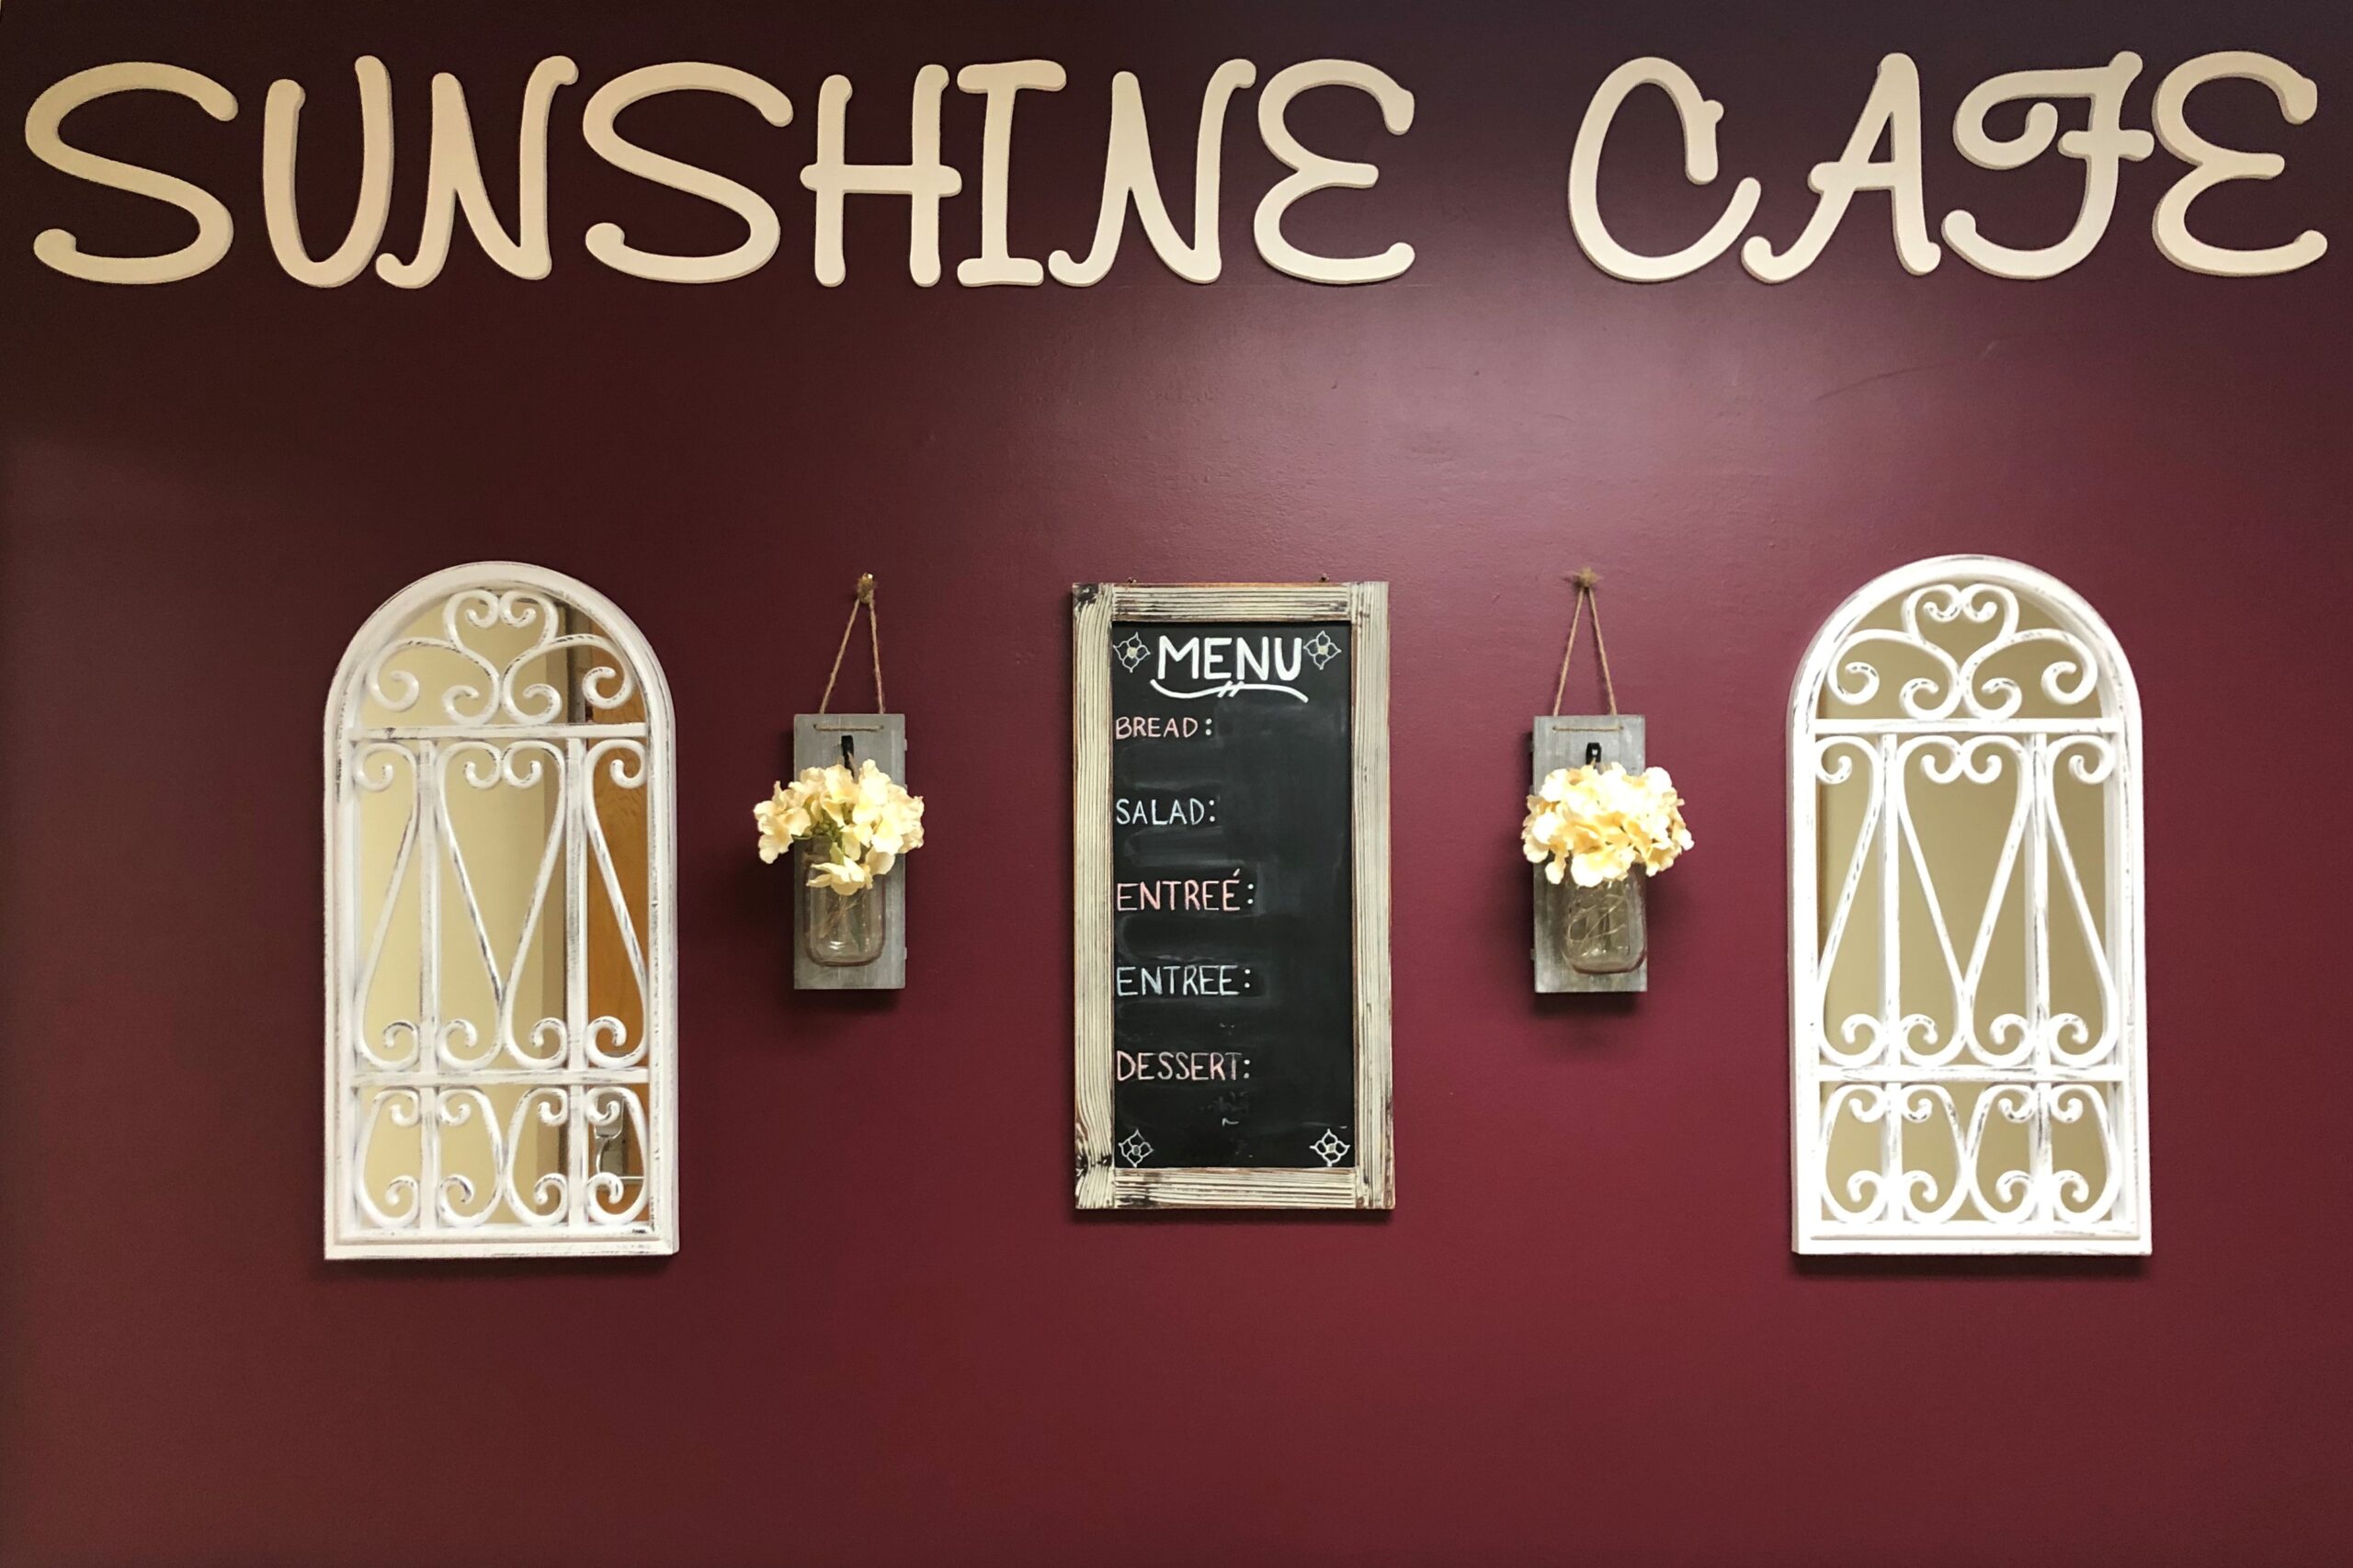
Their memory care community is focused on enhancing the day-to-day experiences and quality of life for residents with memory impairments, with a strong emphasis on social engagement, nutrition, and relaxation, in addition to providing round-the-clock care assistance. For assisted living residents, Northbridge offers private apartments and structured daily programs, with medication management and accompanied excursions. They aim to create a home-like environment, with three daily meals and a range of integrated community activities.

Managed by Renea Watson

Administrator

Renea Watson serves as the Administrator at Northbridge Health Care Center, leading the team dedicated to providing compassionate care for residents. She oversees both short-term rehab and long-term care services, ensuring the community supports residents and families through their healthcare decisions with professionalism and warmth.

Quality ratings

Measured by Centers for Medicare & Medicaid Services (CMS)

Overall rating Info The Overall CMS Rating combines results from health inspections, staffing levels and quality measures. Health inspections carry the most weight. Staffing and quality scores can increase or decrease the final rating based on performance compared to state and national standards.
1/5
Connecticut average: 3.4/5
Health Inspection Info Based on the results of the facility's three most recent standard inspections and any complaint investigations. CMS reviews the number, scope, and severity of deficiencies, with more recent findings weighted more heavily.
1/5
Connecticut average: 3.1/5
Staffing Info Measures average nursing staff hours per resident per day, including Registered Nurses (RNs) and total nursing staff. Ratings are adjusted based on the level of care residents require and are compared to state and national benchmarks.
3/5
Connecticut average: 3.4/5
Quality Measures Info Based on clinical and physical health indicators reported to CMS, such as hospital readmissions, falls, pressure ulcers, and improvements in mobility. These measures reflect how well residents' health needs are being managed.
3/5
Connecticut average: 3.6/5

Nursing care per resident

Info This shows how many total hours of nursing staff time are available per resident each day. Higher numbers usually mean more staff support.
3h 51m per day

This home provides 5% less nursing time per resident than the Connecticut average.

Connecticut average: 4h 4m per day

Staffing hours breakdown

Info Hours of care per resident per day, broken down by staff type. Data from CMS Medicare.
Staff type Facility State avg National avg
Registered Nurse (RN) Info Registered nurse hours per resident per day. 23m per day 42m per day 41m per day
Nurse Aide Info Nurse aide hours per resident per day. 1h 59m per day 2h 17m per day 2h 21m per day
Total Nursing (Weekend) Info Total number of nurse staff hours per resident per day on weekends. 3h 1m per day 3h 25m per day 3h 26m per day
Physical Therapist Info Physical therapist staff hours per resident per day. 5m per day 5m per day 4m per day
RN (Weekend) Info Registered nurse hours per resident per day on weekends. 15m per day 28m per day 29m per day

Capacity and availability

Medium-capacity home

Offers a balance of services and community atmosphere.

Total beds 145

This home usually has limited availability

Occupancy is moderate, suggesting balanced demand.

Similar demand to the Connecticut average
Occupancy rate 89%
Residents per day (avg) 126
Occupancy rate
89%
Residents per day (avg)
126

Who this home usually serves

TYPE OF STAY

Mostly long-term care residents

Most residents stay for extended periods and receive ongoing daily care.

Might be optimal for
Long-term daily care Ongoing support needs

Breakdown by payment type

Medicare

22% of new residents, usually for short-term rehab.

Typical stay 1 - 2 months

Private pay

41% of new residents, often for short stays.

Typical stay 1 - 2 months

Medicaid

37% of new residents, often for long-term daily care.

Typical stay 1 - 2 years

Finances and operations

Privately-owned community
Operated by a business corporation.
Home revenue
$32.6M
Operating loss
-$508.8K
Privately-owned community Operated by a business corporation.
Home revenue
$32,587,453.00
Operating loss
$-508,785.00
Payroll costs Info The portion of the home's budget spent on staff, including nurses, caregivers, and other employees who support care and operations.
$9.3M
28.4% of revenue
Other operating costs Info All remaining costs needed to run the home, such as food, utilities, building maintenance, supplies and administrative expenses.
$23.8M
Total costs $33.1M
Years in operation
18 years in operation
A longer operating history, which may indicate experience navigating regulations and delivering ongoing care.
Walk Score
Walk Score: 75 / 100
Very walkable. Most errands can be accomplished on foot, and many essentials are within a short walk.

Services

Alzheimers
Dementia Care
Hospice
Iv Therapy
Pain Management
Recreation
Rehabilitation Therapy
Respite Care

About this community

Occupancy

Occupancy rate
89%
In line with Connecticut average
Occupied beds
129 / 145
Average residents 102 per day

License details

Facility type
Chronic & Convalescent Nursing Home
Status Active
Issuance January 10, 2008
Expiration September 30, 2026

Additional licensing details

License number: 2183C

Room costs

Private Room (11 rooms) $622 per day
Semi-Private Room (67 rooms) $602 per day

Staffing

Key information about the people who lead and staff this community.

Languages Spoken

Creole French Haitian Italian Jamaican Portuguese Spanish

Staff Composition (State Data)

Admin
3 FTE
Registered Nurse
3 FTE
Licensed Practical Nurse
18 FTE
Nursing Assistant
53 FTE
Recreation
5 FTE
Social Services
3 FTE
Food Service Supervisor
14 FTE
Physical Therapy
4 FTE
Occupational Therapy
2 FTE
Speech Therapy
1 FTE
Dietary
12 FTE
Other Staff
18 FTE

Care Services

Nursing Services
Rehabilitation Services
Respite Care
Skilled Nursing
Licensed Nurses/CNAs
Short-Term Rehab

Additional Policies & Features

Religious Services: All Denominations

Programs & Activities

Specific Programs
Skilled Nursing Care, Home Health Care Services, Hospice Care Services, Post-Hospital Care Recovery, Rehabilitation Services

What does this home offer?

Accepts Medicaid icon

Accept Medicaid: Yes

Housing options icon

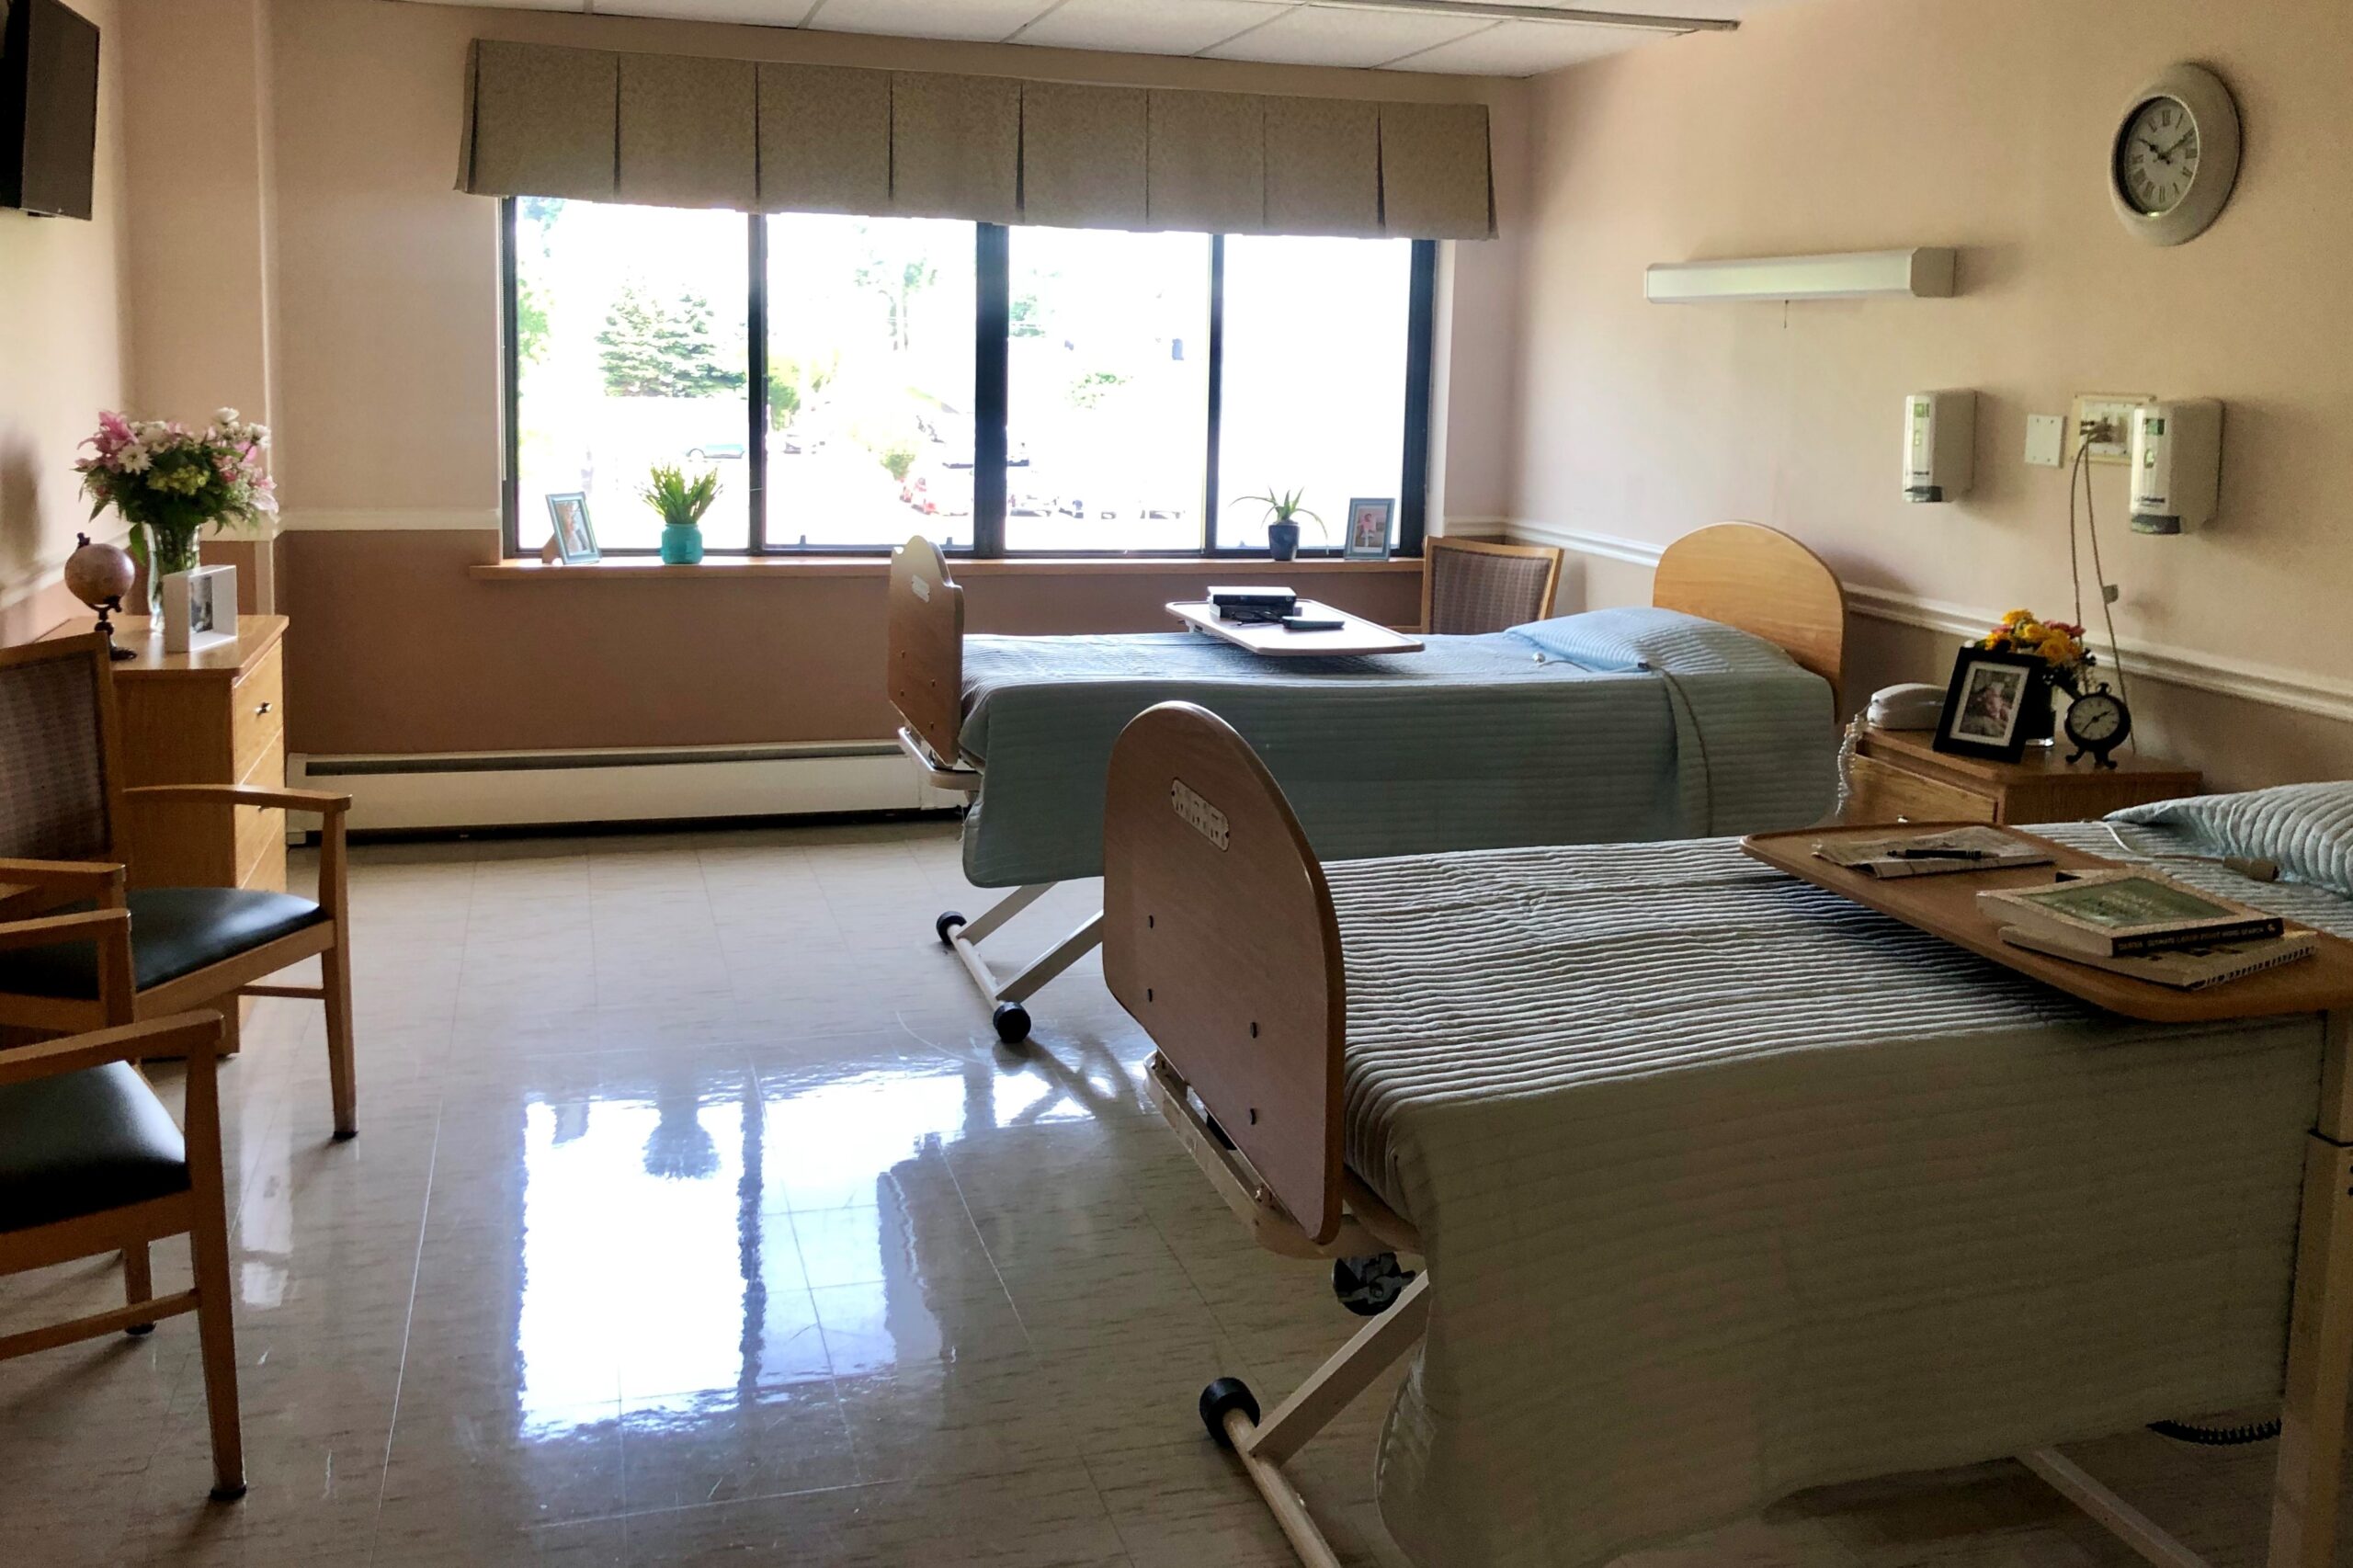
Housing Options: Private / Shared Rooms

Building type icon
Building type icon

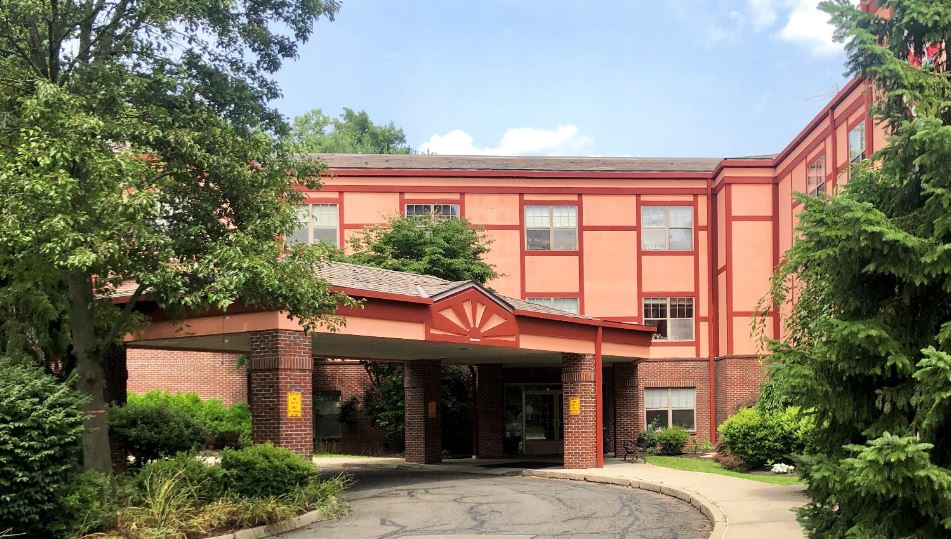
Building Type: Mid-rise

Dining services icon

Dining Services

Beauty services icon

Beauty Services

Social and recreational activities icon

Social and Recreational Activities

On-site medical care and health services icon

On-site Medical Care and Health Services

Types of Care at Northbridge Health Care Center

Skilled Nursing Memory Care Home Care Hospice Care

Inspection History

In Connecticut, the Department of Public Health, Facility Licensing and Investigations Section conducts mandatory inspections and unannounced surveys to monitor the quality of care in long-term facilities.

17 visits/inspections

1 visits/inspections triggered by complaints

12 routine inspections

Breakdown by inspection type
  • 1 renewal/recertification inspection
  • 3 licensing inspections
  • 1 complaint investigation
  • 5 plans of correction

Results

5 with issues

0 without issues

Connecticut average: 13 visits/inspections

Latest inspection

Date:July 7, 2025

Inspection history

01-10-2025 Plan of Correction
01-11-2022 Inspection Report
02-01-2024 Inspection Report
02-07-2022 Inspection Report
04-02-2025 Inspection Report
05-05-2025 Inspection Report
05-05-2025 Plan of Correction
06-15-2022 Inspection Report
06-21-2022 Plan of Correction
06-27-2023 Inspection Report
07-07-2025 Inspection Report
09-20-2018 Inspection Report
10-28-2024 Inspection Report
11-01-2021 Plan of Correction
12-07-2021 Inspection Report
12-09-2024 Inspection Report
12-09-2024 Plan of Correction
12-18-2024 Inspection Report
12-24-2024 Inspection Report

12 deficiencies

Deficiencies indicate regulatory issues. A higher number implies the facility had several areas requiring improvement.

Inspection Report Summary for Northbridge Health Care Center

The most recent inspection on July 7, 2025, found no deficiencies. Earlier inspections showed a mixed record with several citations related to resident care issues, including delayed nursing response to a resident burn and substantiated verbal abuse by staff. Prior reports also noted concerns with supervision, infection control, staff identification, and failure to report incidents promptly, including a substantiated case of sexual abuse between residents. Complaint investigations were mostly unsubstantiated except for the verbal abuse and burn incident cases, which led to corrective actions and staff termination. The facility appears to have addressed many prior deficiencies, as recent inspections show improvement and no new violations.

Health Inspection History

Inspections
Total health inspections 7

Connecticut average 5.7


Last Health inspection on Dec 2024

Total health citations 32

Connecticut average 32

Citations per inspection
4.57

Connecticut average 5.82


Health citations are formal notices following inspections when they fail to comply with safety and care standards.

21 of 32 citations resulted from standard inspections; 5 of 32 resulted from complaint investigations; and 6 of 32 came from combined inspections (standard and complaint).

Breakdown of citation severity (last 3 years)
Critical Health citations More info 1
233% worse than Connecticut average

Connecticut average: 0.3


Serious Health citations More info 1
43% worse than Connecticut average

Connecticut average: 0.7

1 critical citation More info Connecticut average: 0.3

1 serious citation More info Connecticut average: 0.7

29 moderate citations More info Connecticut average: 28.8

1 minor citation More info Connecticut average: 2.3
Citations history (last 3 years)
Abuse/Neglect moderate citation Info Issues related to protecting resident's from harm, including abuse, neglect, or mistreatment. Dec 19, 2024
Corrected

Abuse/Neglect moderate citation Info Issues related to protecting resident's from harm, including abuse, neglect, or mistreatment. Nov 14, 2024
Corrected

Abuse/Neglect moderate citation Info Issues related to protecting resident's from harm, including abuse, neglect, or mistreatment. Nov 06, 2024
Corrected

Abuse/Neglect moderate citation Info Issues related to protecting resident's from harm, including abuse, neglect, or mistreatment. Nov 06, 2024
Corrected

Compare Nursing Homes around Bridgeport The information below is reported by the Connecticut Department of Public Health, Facility Licensing and Investigations Section.

5 facilities compared · CMS & CT Dept. of Health data · Updated Mar 2026

Ludlowe Center for Health and Rehabilitation
NH

Nursing Home Licensed facility providing 24/7 skilled nursing care for residents with complex, ongoing medical needs. Staffed by RNs, LPNs, and CNAs. Inspected and star-rated annually by CMS. Accepts Medicare (short-term rehab) and Medicaid (long-term care).

Fairfield
144
95.7%
+14%
3.25
+70%
-18%
1
21
3
134
33
Page, Patricia
$33,8M
$10,1M
30%
75330
Private / Shared Rooms
Cambridge Health and Rehabilitation Center
NH

Nursing Home Licensed facility providing 24/7 skilled nursing care for residents with complex, ongoing medical needs. Staffed by RNs, LPNs, and CNAs. Inspected and star-rated annually by CMS. Accepts Medicare (short-term rehab) and Medicaid (long-term care).

Fairfield
160
91.9%
+9%
3.25
+62%
-18%
0
29
0
146
23
Oagmah Partnership Lp
$37,9M
$9,7M
25.6%
75323
Private / Shared Rooms
Maefair Health Care Center
AL

Assisted Living A licensed, long-term care setting for seniors or individuals with disabilities who need help with daily activities — like bathing, dressing, and medication management — but not 24-hour skilled nursing. Offers housing, meals, and around-the-clock support while aiming to maximize resident independence.

HC

Home Care Professional care delivered in the person's own home — from companionship and errands to skilled nursing and therapy. Allows seniors to age in place. Medicare covers skilled home health when medically necessary.

HC

Home Care Professional care delivered in the person's own home — from companionship and errands to skilled nursing and therapy. Allows seniors to age in place. Medicare covers skilled home health when medically necessary.

NH

Nursing Home Licensed facility providing 24/7 skilled nursing care for residents with complex, ongoing medical needs. Staffed by RNs, LPNs, and CNAs. Inspected and star-rated annually by CMS. Accepts Medicare (short-term rehab) and Medicaid (long-term care).

Trumbull (Trumbull Center)
134
90.3%
+8%
3.44
+19%
-14%
2
28
0
123
25
Golec, Terri
$32,1M
$9,0M
27.9%
75404
Private / Shared Rooms
Hewitt Health & Rehabilitation Center
MC

Memory Care Secured, specialized care for people living with Alzheimer's or dementia. Staff trained in cognitive impairment, with higher staff-to-resident ratios and an environment designed to reduce confusion and wandering risk.

NH

Nursing Home Licensed facility providing 24/7 skilled nursing care for residents with complex, ongoing medical needs. Staffed by RNs, LPNs, and CNAs. Inspected and star-rated annually by CMS. Accepts Medicare (short-term rehab) and Medicaid (long-term care).

Shelton
120
78.8%
-6%
3.68
-29%
-7%
2
61
1
114
74
-
$13,2M
$5,5M
41.8%
75047
Private / Shared Rooms
Northbridge Health Care Center
AL

Assisted Living A licensed, long-term care setting for seniors or individuals with disabilities who need help with daily activities — like bathing, dressing, and medication management — but not 24-hour skilled nursing. Offers housing, meals, and around-the-clock support while aiming to maximize resident independence.

HC

Home Care Professional care delivered in the person's own home — from companionship and errands to skilled nursing and therapy. Allows seniors to age in place. Medicare covers skilled home health when medically necessary.

HC

Home Care Professional care delivered in the person's own home — from companionship and errands to skilled nursing and therapy. Allows seniors to age in place. Medicare covers skilled home health when medically necessary.

NH

Nursing Home Licensed facility providing 24/7 skilled nursing care for residents with complex, ongoing medical needs. Staffed by RNs, LPNs, and CNAs. Inspected and star-rated annually by CMS. Accepts Medicare (short-term rehab) and Medicaid (long-term care).

Bridgeport (Brooklawn/St. Vincent)
145
88.0%
+5%
3.85
-95%
-3%
1
32
2
126
75
Roman, Erica
$32,4M
$9,3M
28.6%
75413
Private / Shared Rooms

Places of interest near Northbridge Health Care Center

Address 2.6 miles from city center — 2.13 miles to nearest hospital (Bridgeport Hospital)

Address 2875 Main St, Bridgeport, CT 06606

Calculate Travel Distance to Northbridge Health Care Center

Add your location

Address

Staffing Data (Q2 2025)

This data corresponds to Q2 2025 and is based on CMS Payroll-Based Journal.

Total staff 189
Employees 179
Contractors 10
Staff to resident ratio 1.47:1
22% worse than Connecticut average

Connecticut average ratio: 1.88:1

Avg staff/day 71
Average shift 7.3 hours
0% compared with Connecticut average

Connecticut average: 7.5 hours

Total staff hours (quarter) 47,008
Nursing staff breakdown
Registered Nurse

Manages medical care and health needs.

Total count 1
Average shift length Info Average shift length. Calculated as total hours divided by days worked and average staff per day. 2.4 hours

This role is partially covered by contractors.

Licensed Practical Nurse

Assists with medical care and medications.

Total count 46
Average shift length Info Average shift length. Calculated as total hours divided by days worked and average staff per day. 7.8 hours

This role is partially covered by contractors.

Certified Nursing Assistant

Helps with daily care and mobility.

Total count 84
Average shift length Info Average shift length. Calculated as total hours divided by days worked and average staff per day. 7.2 hours

No contractors work on this role.

Contractor staffing

Total hours from contractors

1.1%

517 contractor hours this quarter

Feeding Assistant: 4 Occupational Therapy Assistant: 2 Licensed Practical Nurse: 1 Medical Director: 1 Registered Nurse: 1 Other Physician: 1
Staff by category
Certified Nursing Assistant8408423,64891100%7.2
Licensed Practical Nurse4514611,58291100%7.8
Clinical Nurse Specialist220223,69191100%7.8
RN Director of Nursing2029526470%7.8
Respiratory Therapy Technician3039447481%7
Therapeutic Recreation Specialist2028928796%7.5
Physical Therapy Assistant2028897582%7.4
Mental Health Service Worker3038116268%7.6
Other Dietary Services Staff7076086774%7.4
Nurse Practitioner1015266571%8.1
Administrator1015046470%7.9
Occupational Therapy Aide1014496066%7.5
Feeding Assistant0443776470%3.1
Speech Language Pathologist1013695055%7.4
Dietitian2022853741%7.7
Qualified Social Worker2022796167%4.6
Physical Therapy Aide101751011%7.5
Occupational Therapy Assistant022513134%1.5
Registered Nurse011472022%2.4
Medical Director011213235%0.6
Other Physician0111189%1.4
84 Certified Nursing Assistant
% of Days 100%
46 Licensed Practical Nurse
% of Days 100%
22 Clinical Nurse Specialist
% of Days 100%
2 RN Director of Nursing
% of Days 70%
3 Respiratory Therapy Technician
% of Days 81%
2 Therapeutic Recreation Specialist
% of Days 96%
2 Physical Therapy Assistant
% of Days 82%
3 Mental Health Service Worker
% of Days 68%
7 Other Dietary Services Staff
% of Days 74%
1 Nurse Practitioner
% of Days 71%
1 Administrator
% of Days 70%
1 Occupational Therapy Aide
% of Days 66%
4 Feeding Assistant
% of Days 70%
1 Speech Language Pathologist
% of Days 55%
2 Dietitian
% of Days 41%
2 Qualified Social Worker
% of Days 67%
1 Physical Therapy Aide
% of Days 11%
2 Occupational Therapy Assistant
% of Days 34%
1 Registered Nurse
% of Days 22%
1 Medical Director
% of Days 35%
1 Other Physician
% of Days 9%

Facility Characteristics

Source: CMS Long-Term Care Facility Characteristics (Data as of Jan 2026)

Total census
129 residents
Residents by payment source
Medicare
2 residents (1.6%)
Medicaid
114 residents (88.4%)
Private pay or other
13 residents (10.1%)
Programs & Services
Residents' Group

Residents meet regularly to discuss policies, care quality, and activities

Family Member Group

Family members meet regularly to discuss policies, care quality, and activities

Active Family Council

Organized group of family members that meets regularly to discuss facility policies, resident care, and activities.

Active Resident Council

Organized group of residents that meets regularly to discuss facility policies, quality of life, and activities.

Quality of care over time

These measures show how residents usually do over time at this home, based on health outcomes and preventive care.

High-risk clinical events score Info A composite score based on pressure ulcers, falls with injury, weight loss, walking ability decline, and activities of daily living decline. 8.3
20% better than Connecticut average

Connecticut average: 10.4

Functional decline score Info A composite score based on activities of daily living decline, walking ability decline, and incontinence. 18.6
12% better than Connecticut average

Connecticut average: 21.1

Long-stay resident measures
Average Connecticut avg: 3.2 Info CMS star rating based on long-stay quality measure performance. 5 stars = significantly above average, 1 star = significantly below average.
Need for Help with Daily Activities Increased Info Percent of long-stay residents whose need for help with daily activities has increased 11.4%
39% better than Connecticut average

Connecticut average: 18.9%

Walking Ability Worsened Info Percent of long-stay residents whose ability to move independently worsened 19.1%
In line with Connecticut average

Connecticut average: 19.2%

Low Risk Residents with Bowel/Bladder Incontinence Info Percent of low risk long-stay residents who lose control of their bowels or bladder 25.3%
In line with Connecticut average

Connecticut average: 24.9%

Falls with Major Injury Info Percent of long-stay residents experiencing one or more falls with major injury 0.6%
81% better than Connecticut average

Connecticut average: 3.5%

High Risk Residents with Pressure Ulcers Info Percent of long-stay high risk residents with pressure ulcers 6.5%
42% worse than Connecticut average

Connecticut average: 4.6%

Urinary Tract Infection Info Percent of long-stay residents with a urinary tract infection 1.7%
In line with Connecticut average

Connecticut average: 1.7%

Lost Too Much Weight Info Percent of long-stay residents who lose too much weight 3.9%
38% better than Connecticut average

Connecticut average: 6.3%

Depressive Symptoms Info Percent of long-stay residents who have depressive symptoms 0.8%
95% better than Connecticut average

Connecticut average: 15.2%

Antipsychotic Use Info Percent of long-stay residents who received an antipsychotic medication 16.1%
6% better than Connecticut average

Connecticut average: 17.2%

Pneumococcal Vaccine Info Percent of long-stay residents assessed and appropriately given the pneumococcal vaccine 86.6%
In line with Connecticut average

Connecticut average: 87.5%

Influenza Vaccine Info Percent of long-stay residents assessed and appropriately given the seasonal influenza vaccine 93.6%
In line with Connecticut average

Connecticut average: 93.5%

Hospitalizations per 1,000 days Info Number of hospitalizations per 1,000 long-stay resident days. 3.14
50% worse than Connecticut average

Connecticut average: 2.10

ED visits per 1,000 days Info Number of outpatient emergency department visits per 1,000 long-stay resident days. 1.63
7% worse than Connecticut average

Connecticut average: 1.53

Short-stay resident measures
Average Connecticut avg: 3.3 Info CMS star rating based on short-stay quality measure performance. 5 stars = much above average, 1 star = much below average.
Pneumococcal Vaccine Info Percent of short-stay residents assessed and appropriately given the pneumococcal vaccine 42.1%
40% worse than Connecticut average

Connecticut average: 70.1%

Antipsychotic medication increase Info Percent of short-stay residents who newly received an antipsychotic medication 0.7%
51% better than Connecticut average

Connecticut average: 1.5%

Influenza Vaccine Info Percent of short-stay residents assessed and appropriately given the seasonal influenza vaccine 55.7%
20% worse than Connecticut average

Connecticut average: 69.8%

Re-hospitalized after SNF stay Info Percentage of short-stay residents who were re-hospitalized after their nursing home admission. 26.3%
5% worse than Connecticut average

Connecticut average: 25.0%

Emergency department visits Info Percentage of short-stay residents who had an outpatient emergency department visit. 11.5%
In line with Connecticut average

Connecticut average: 11.1%

Falls with major injury Info Percentage of SNF residents who experience falls with major injury during their stay. 0.0%
100% better than Connecticut average

Connecticut average: 0.8%

Ability to care for self at discharge Info Percentage of residents at or above expected ability to care for themselves at discharge. 28.6%
47% worse than Connecticut average

Connecticut average: 53.7%

Successful return to home or community Info Rate of successful return to home or community from a skilled nursing facility. 45.2%
11% worse than Connecticut average

Connecticut average: 50.6%

Penalties and fines

Federal penalties imposed by CMS for regulatory violations, including civil money penalties (fines) and denials of payment for new Medicare/Medicaid admissions.

Source: CMS Penalties Database (Data as of Jan 2026)

Total fines amount $17K
62% lower than Connecticut average

Connecticut average: $44K

Number of fines 1
43% fewer fines than Connecticut average

Connecticut average: 1.7

Payment Denials Info Serious action where Medicare and/or Medicaid temporarily stops payments for new residents until issues are fixed. 1
654% more payment denials than Connecticut average

Connecticut average: 0.1

Fines amount comparison
This facility $17K
Connecticut average $44K
Penalty History

Penalties are imposed by CMS for violations of federal nursing home regulations.

Civil Money Penalty Info Fines imposed for noncompliance, which can be assessed per day or per instance of violation. Jun 26, 2024
$17K
Payment Denial Info Serious action where Medicare and/or Medicaid temporarily stops payments for new residents until issues are fixed. Jun 26, 2024
64 days

Last updated: Jan 2026

Guides for Better Senior Living

Care Cost Calculator: See Prices in Your Area

Nursing Home Data Explorer

Don’t Wait Too Long: 7 Red Flag Signs Your Parent Needs Assisted Living Now

The True Cost of Assisted Living in 2025 – And How Families Are Paying For It

Understanding Senior Living Costs: Pricing Models, Discounts & Financial Assistance

Financial Aid for Connecticut Seniors

Get financial aid guidance

Connecticut Home Care Program for Elders

CHCPE

Age 65+, Connecticut resident, at risk of nursing home placement.

State-funded: ~$1,600/month; Medicaid: ~$2,829/month (300% FBR).

$1,600 (state), $2,000 (Medicaid, individual).

Two tiers (state and Medicaid); waitlists possible.

Statewide Respite Care Program

CT Respite Care

Caregiver of senior with dementia, Connecticut resident.

~$2,500/month (individual, varies).

$40,000 (individual).

Limited to dementia caregivers; capped funding.

Congregate Housing Services Program (CHSP)

Connecticut Congregate Housing Services Program

Age 62+, Connecticut resident, frail but not needing 24/7 care, resides in CHSP-eligible housing.

~$41,000/year (individual, adjusted annually).

Not specified; focus is income-based.

Limited to 14 state-subsidized sites; participants pay 10% of service costs.

Medicare Savings Program (MSP)

Connecticut Medicare Savings Program

Age 65+ or disabled, Connecticut resident, enrolled in Medicare Part A/B.

~$2,510/month (individual, QMB); ~$3,380/month (SLMB); ~$3,598/month (ALMB)—adjusted annually.

None since 2023 policy change.

Three tiers (Qualified Medicare Beneficiary, Specified Low-Income, Additional Low-Income); no asset test.

Senior Community Service Employment Program (SCSEP)

Connecticut SCSEP (federally funded, state-administered)

Age 55+, unemployed, low-income, Connecticut resident.

~$1,983/month (125% FPL, individual).

Not specified; income-focused.

Priority for veterans, rural residents; limited slots (~500/year).