Oak Grove Christian Retirement Village
Nursing Home · Indiana, IN
CMS overall rating Info The Overall CMS Rating is scored from 1 to 5 stars and combines results from health inspections, staffing levels, and quality measures. Health inspections carry the most weight. Staffing and quality scores can increase or decrease the final rating based on performance compared to state and national standards.

Oak Grove Christian Retirement Village

Nursing Home · Indiana, IN
CMS overall rating Info The Overall CMS Rating is scored from 1 to 5 stars and combines results from health inspections, staffing levels, and quality measures. Health inspections carry the most weight. Staffing and quality scores can increase or decrease the final rating based on performance compared to state and national standards.
Calculator: See prices in your area
Oak Grove Christian Retirement Village accepts Medicare, Medicaid, and private pay.

Overview of Oak Grove Christian Retirement Village

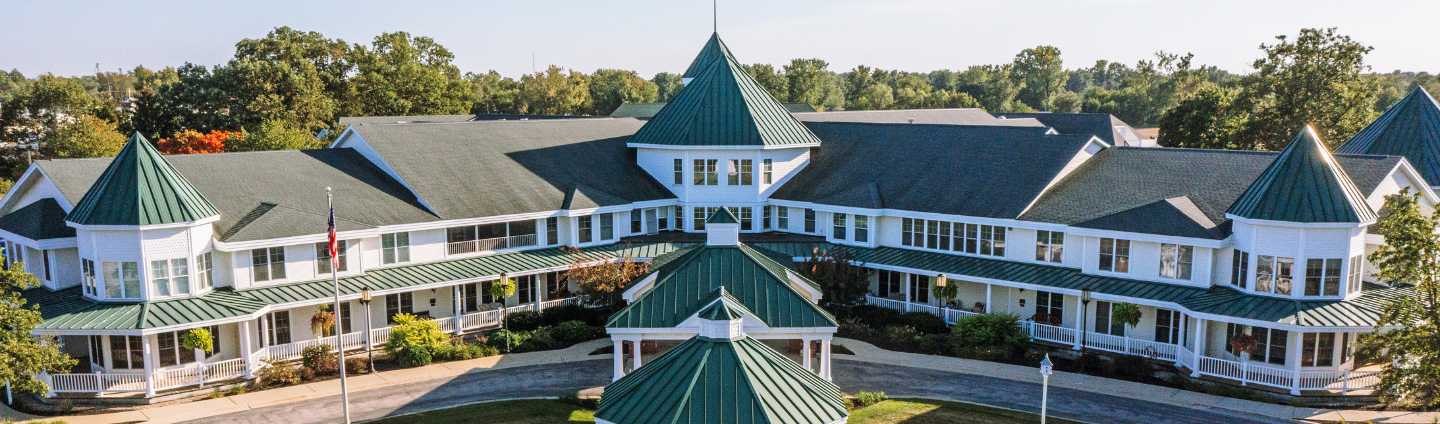
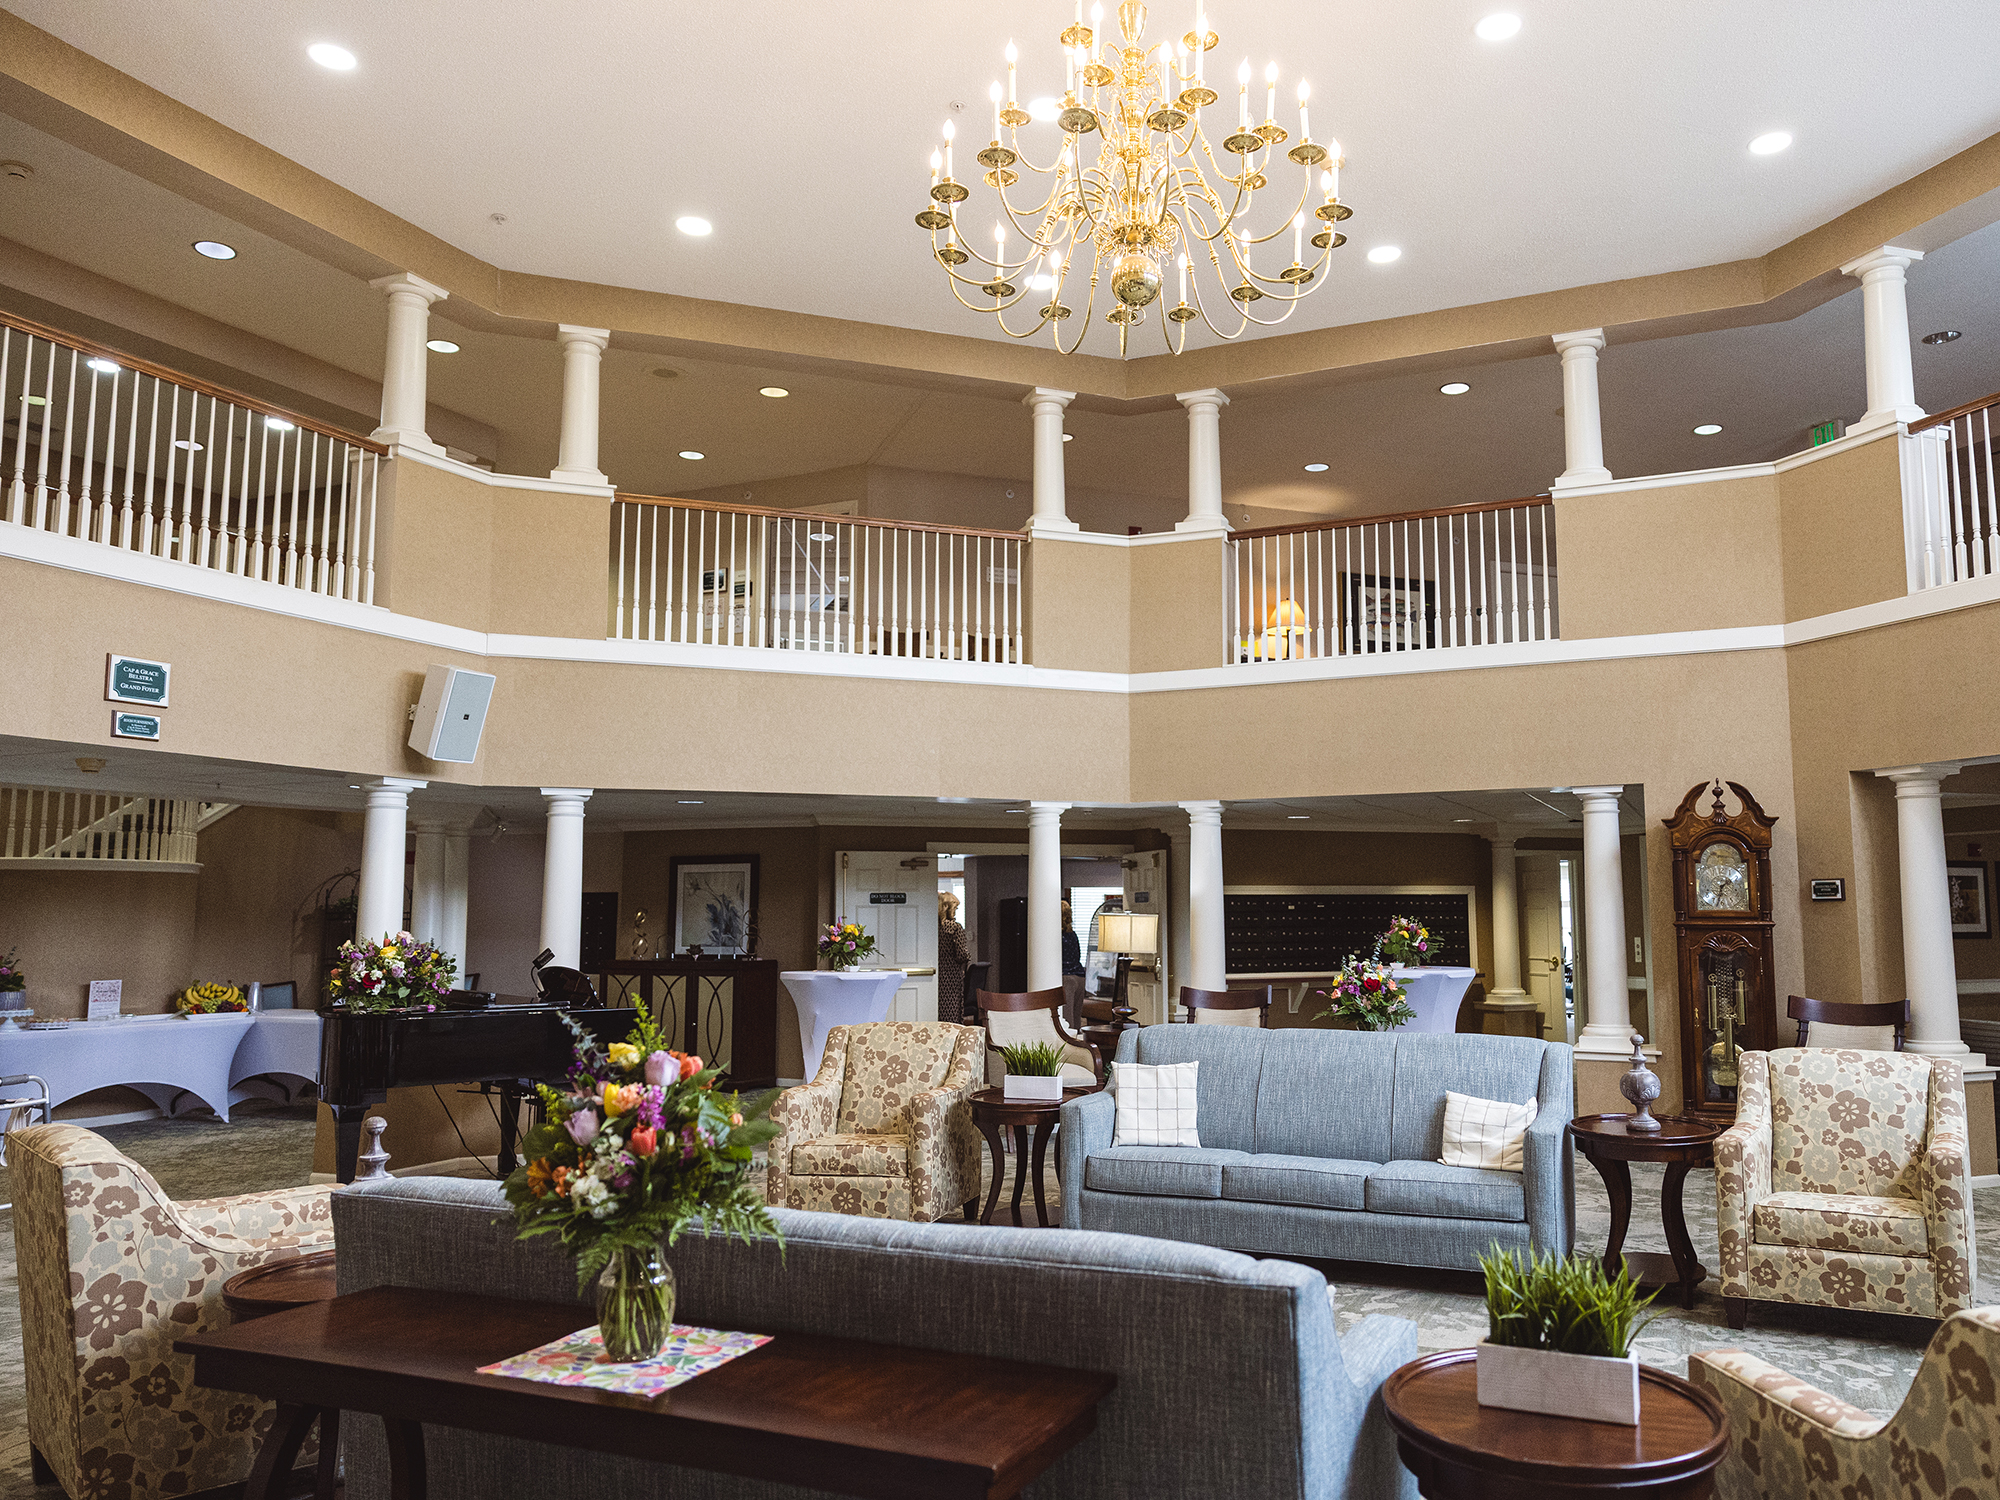
Oak Grove Christian Retirement Village is a senior living community. It focuses on supporting local family-owned businesses and fostering community engagement. For more information, interested parties can call the provided phone number.

(219) 987-7005

Quality ratings

Measured by Centers for Medicare & Medicaid Services (CMS)

Overall rating Info The Overall CMS Rating combines results from health inspections, staffing levels and quality measures. Health inspections carry the most weight. Staffing and quality scores can increase or decrease the final rating based on performance compared to state and national standards.
▼ 66.8% Below IN avg.
Health Inspection Info Based on the results of the facility's three most recent standard inspections and any complaint investigations. CMS reviews the number, scope, and severity of deficiencies, with more recent findings weighted more heavily.
▼ 63.4% Below IN avg.
Staffing Info Measures average nursing staff hours per resident per day, including Registered Nurses (RNs) and total nursing staff. Ratings are adjusted based on the level of care residents require and are compared to state and national benchmarks.
▲ 56.9% Above IN avg.
Quality Measures Info Based on clinical and physical health indicators reported to CMS, such as hospital readmissions, falls, pressure ulcers, and improvements in mobility. These measures reflect how well residents' health needs are being managed.
At IN avg.

Staffing hours breakdown

Info Daily nursing hours per resident by staff type, reported to CMS. Higher is generally better — compare this facility to state and national averages to see where staffing stands.

Hours per resident per day — compared to Indiana state averages

Total nursing care / resident Info Total adjusted nursing hours per resident per day, combining RN, LPN, and aide time. CMS adjusts this for case-mix so facilities can be fairly compared.
4h 19m per day
This facility Indiana avg (3h 32m per day)
vs Indiana avg
+22%

2 of 6 metrics below state avg

Standout metric LPN / LVN is +35% above state avg
Staff typeHours / dayvs state avg
Registered Nurse (RN) Info RNs hold the highest nursing license and can assess residents, interpret test results, and direct care plans. More RN hours per day often signals stronger clinical oversight and faster response to health changes. 39m per day ▼ 3% State avg: 40m per day · National avg: 41m per day
LPN / LVN Info Licensed Practical Nurses (LPNs) or Licensed Vocational Nurses (LVNs) deliver routine hands-on care — medication administration, wound dressing, and monitoring vital signs. They work under RN supervision and make up a large share of daily bedside care. 1h 2m per day ▲ 35% State avg: 46m per day · National avg: 52m per day
Nurse Aide Info Certified Nurse Aides (CNAs) provide the most direct day-to-day assistance: bathing, dressing, feeding, and mobility. Nurse aide hours are typically the largest staffing category and directly affect residents' quality of life. 2h 31m per day ▲ 11% State avg: 2h 16m per day · National avg: 2h 20m per day
Total Nursing (Weekend) Info Combined nursing hours (RN + LPN + Nurse Aide) per resident per day on weekends. Staffing often drops on weekends — this figure reveals whether the facility maintains adequate coverage outside of weekday hours. 3h 58m per day ▲ 22% State avg: 3h 14m per day · National avg: 3h 26m per day
Physical Therapist Info Hours per resident per day provided by licensed Physical Therapists (PTs) or PT Assistants. PT services help residents recover mobility after injury or illness and are especially important for post-acute (short-stay) rehabilitation. 5m per day ▲ 25% State avg: 4m per day · National avg: 4m per day
RN (Weekend) Info Registered nurse hours specifically on weekends. Facilities sometimes reduce RN presence on Saturdays and Sundays — a low weekend RN figure compared to weekday hours can indicate reduced clinical oversight when most administrative staff are absent. 24m per day ▼ 11% State avg: 27m per day · National avg: 28m per day

Capacity and availability

Avg. Length of Stay
130 days

Who this home usually serves

TYPE OF STAY

Mostly short-term rehab stays

Most residents typically stay for a few weeks or months before returning home or moving on.

Breakdown by payment type

Medicare

59% of new residents, usually for short-term rehab.

Typical stay 1 - 2 months

Private pay

36% of new residents, often for short stays.

Typical stay 11 - 12 months

Medicaid

5% of new residents, often for long-term daily care.

Typical stay 3 - 4 years

Finances and operations

Governmental community
Operated by county authorities.
Home revenue
$13.7M
Surplus of revenue
$142.9K
Governmental community Operated by county authorities.
Home revenue
$13.7M
Surplus of revenue
$142.9K
Payroll costs Info The portion of the home's budget spent on staff, including nurses, caregivers, and other employees who support care and operations.
$6.0M
43.7% of revenue
Other operating costs Info All remaining costs needed to run the home, such as food, utilities, building maintenance, supplies and administrative expenses.
$7.6M
Total costs $13.6M
Bed community size
123-bed community
A larger shared setting that may offer more common spaces and organized community services.
Years in operation
1 year in operation
A newer community that may feature more recent facilities and programs.
Walk Score
Walk Score: 52 / 100
Moderately walkable. Some errands can be accomplished on foot, with a mix of nearby amenities.
BBB Rating
BBB Rating: A+ (Not Accredited)
An independent rating from the Better Business Bureau based on factors such as complaint history, transparency, and business practices.
How BBB ratings work

About this community

Occupancy

Occupancy rate
46%
Lower than the Indiana average: 68.1%
Occupied beds
57 / 123
Average residents per home in Indiana 70 per day

License Details

Facility TypeMixed Facility (nursing + Residential Care)
IssuanceJanuary 1, 2025
ExpirationDecember 31, 2025
License Number25-010823-1

Ownership & Operating Entity

Oak Grove Christian Retirement Village is legally operated by Woodlawn Hospital, and administrated by Beth Ingram.

Profit StatusOther

Type Of Units

SNF (Skilled Nursing)
29 units
SNF/NF (Combined)
44 units
Residential
50 units
Total beds
123 units

Staffing

Key information about the people who lead and staff this community.

Leadership

Medical DirectorChirag Patel
Director of NursingPATRICIA JOHNSON
ContactRosemary Weeks

Contact Information

Fax(219) 987-7401

Contact Oak Grove Christian Retirement Village

Inspection History

In Indiana, the Department of Health, Division of Long Term Care is the primary regulatory body that performs onsite inspections and quality of care reviews for all licensed facilities.

Since 2022 · 4 years of data 86 deficiencies 9 complaints 25 inspections

Inspection Scorecard Info This scorecard compares key inspection, citation, and complaint metrics at this facility against the Indiana state average. Metrics rated ≥15% worse than average are highlighted in red; those ≥15% better are highlighted in green.

Since 2022 vs. Indiana state average
Overall vs. IN average 9 Worse Metrics worse than Indiana average:
• Total deficiencies (139% above)
• Deficiencies per year (139% above)
• Deficiencies per inspection (79% above)
• Total visits (32% above)
• Inspections with deficiencies (129% above)
• Inspection deficiency rate (73% above)
• Inspections (23% above)
• Total complaints (80% above)
• Complaints per year (77% above)
0 Better No metrics in this bucket.
Latest Inspection June 10, 2025 Re Inspection

Deficiencies Info Deficiencies are formal regulatory issues recorded during state inspections.

MetricThis FacilityIN Averagevs. IN Avg
Total deficiencies Info Formal regulatory issues recorded by inspectors across all inspection types. 8636 This facility has 139% more total deficiencies than a typical Indiana nursing home (86 vs. IN avg 36).↑ 139% worse
Deficiencies per year Info Average deficiencies per year since 2022. 21.59 This facility has 139% more deficiencies per year than a typical Indiana nursing home (21.5 vs. IN avg 9).↑ 139% worse
Deficiencies per inspection Info Average deficiencies per inspection. 3.41.9 This facility has 79% more deficiencies per inspection than a typical Indiana nursing home (3.4 vs. IN avg 1.9).↑ 79% worse

Inspections Info State inspections evaluate whether the facility meets health and safety standards.

MetricThis FacilityIN Averagevs. IN Avg
Total visits Info Combined count of all on-site visits — routine inspections, complaint visits, follow-ups, and other focused visits. 2519 This facility has 32% more total visits than a typical Indiana nursing home (25 vs. IN avg 19).↑ 32% worse
Inspections with deficiencies Info Inspections that resulted in at least one regulatory deficiency. 167 This facility has 129% more inspections with deficiencies than a typical Indiana nursing home (16 vs. IN avg 7).↑ 129% worse
Inspection deficiency rate Info Percentage of inspections that resulted in at least one deficiency. 64%37% This facility has 27 percentage points higher inspection deficiency rate than a typical Indiana nursing home (64% vs. IN avg 37%).↑ 27% worse
Inspections Info Routine, scheduled inspections conducted by state regulators. 1613 This facility has 23% more inspections than a typical Indiana nursing home (16 vs. IN avg 13).↑ 23% worse

Complaints & Investigations Info Complaints are formal concerns filed by residents, families, or staff. Investigations are on-site follow-ups.

MetricThis FacilityIN Averagevs. IN Avg
Total complaints Info Formal expressions of concern made by residents, families, or staff. 95 This facility has 80% more total complaints than a typical Indiana nursing home (9 vs. IN avg 5).↑ 80% worse
Complaints per year Info Average complaints per year since 2022. 2.31.3 This facility has 77% more complaints per year than a typical Indiana nursing home (2.3 vs. IN avg 1.3).↑ 77% worse

Inspection Reports Summary Info An editor-reviewed summary of the themes and findings across this facility's recent inspection reports.

The most recent inspection on June 10, 2025, found Oak Grove Christian Retirement Village in compliance with no deficiencies noted during the post-survey revisit related to a prior complaint. Earlier inspections showed a pattern of deficiencies primarily involving resident care issues such as inadequate assessments and supervision following injuries, as well as ongoing concerns with infection control, care planning, medication management, and safety measures including fire safety code compliance. Several complaint investigations were substantiated, citing deficiencies related to quality of care, accident prevention, medication administration, and documentation, though fines or enforcement actions were not listed in the available reports. The facility addressed many of these issues through plans of correction and staff re-education, with subsequent revisits confirming compliance. This indicates an improving trend in the facility’s adherence to regulatory requirements over time.

Read the full inspection reports for this facility, including detailed findings and corrective actions.

Show Inspection Reports

Health Inspection History

Inspections
Total health inspections 10

Indiana average 6


Last Health inspection on Aug 2025

Total health citations
51

Indiana average 25

Citations per inspection
5.1

Indiana average 4.12


Health citations are formal notices following inspections when they fail to comply with safety and care standards.

29 of 51 citations resulted from standard inspections; 21 of 51 resulted from complaint investigations; and 1 of 51 came from combined inspections (standard and complaint).

Breakdown of citation severity (last 4 years)
Critical Health citations More info
0
100% better than Indiana average

Indiana average: 0.2


Serious Health citations More info 1
67% worse than Indiana average

Indiana average: 0.6

0 critical citations More info Indiana average: 0.2

1 serious citation More info Indiana average: 0.6

50 moderate citations More info Indiana average: 23.8

0 minor citations More info Indiana average: 0.4
Citations history (last 4 years)
Quality of Care moderate citation Info Issues related to how well residents receive appropriate treatment and support for their medical and daily care needs. Aug 13, 2025
Corrected

Quality of Care moderate citation Info Issues related to how well residents receive appropriate treatment and support for their medical and daily care needs. Aug 13, 2025
Corrected

Care Planning moderate citation Info Issues related to creating and updating personalized care plans for residents based on their needs and conditions. Aug 13, 2025
Corrected

Quality of Care moderate citation Info Issues related to how well residents receive appropriate treatment and support for their medical and daily care needs. May 07, 2025
Corrected

Financial Assistance for
Nursing Home in Indiana

Oak Grove Christian Retirement Village is located in DEMOTTE, Indiana.
Here are the financial assistance programs available to residents in Indiana.

Get Financial aid guidance

Aged and Disabled Waiver

Indiana Medicaid A&D Waiver

Age 65+ or disabled
General Indiana resident, Medicaid-eligible, nursing home-level care need.
Income Limits (2025) ~$2,829/month 300% FBR, individual
Asset Limits $2,000 (individual), $3,000 (couple).
IN

Requires level-of-care determination.

Benefits
Personal care (5-7 hours/day) Respite (240 hours/year) Adult day care (~$60/day) Home health services

CHOICE Program

Indiana CHOICE

Age 60+
General Indiana resident, at risk of nursing home.
Income Limits ~$2,000/month varies
Asset Limits $10,000 individual
IN

Limited funding; regional variation.

Benefits
In-home care (3-5 hours/week) Respite (up to 10 days/year) Transportation (~5 trips/month)

Residential Care Assistance Program (RCAP)

Indiana Residential Care Assistance Program

Age 65+
General or blind, or disabled, Indiana resident, in approved facility, low-income or SSI recipient.
Income Limits (2025) ~$1,004/month including SSI
Asset Limits $2,000 (individual), $3,000 (couple).
IN

~50 facilities statewide; per diem rate set by FSSA.

Benefits
Room/board Laundry Minimal care coordination (~$20-$50/day subsidy)

Medicare Savings Program (MSP)

Indiana Medicare Savings Program

Age 65+ or disabled
General Indiana resident, Medicare Part A/B.
Income Limits (2025) ~$2,510/month (QMB), ~$3,380/month (SLMB), ~$3,598/month (QI)—individual.
Asset Limits $9,430 (individual), $14,130 (couple).
IN

Three tiers; no waitlist.

Benefits
Covers Part B premiums ($174.70/month) Deductibles ($240/year) Copays (~20%)

National Family Caregiver Support Program (NFCSP) Respite

Indiana NFCSP Respite Care

Age
General Caregivers of 60+ needing care or 55+ caregivers of others; Indiana resident; functional needs (2+ ADLs).
Income Limits (2025) Prioritizes ~$24,980/year (individual); no strict cap.
Asset Limits Not assessed; need-based.
IN

16 AAAs; prioritizes low-income, rural caregivers.

Benefits
Respite (4-6 hours/week or 5 days/year) Adult day care ($60/day) Caregiver training

VA Aid and Attendance (A&A) and Housebound Benefits

Indiana VA Aid and Attendance/Housebound

Age 65+ or disabled veteran/spouse
General Indiana resident, wartime service, need for ADL help (A&A) or homebound.
Income Limits (2025) Net income < ~$1,984/month (veteran with dependent, A&A); pension offsets income.
Asset Limits ~$155,356 net worth limit
IN

High veteran demand statewide.

Benefits
Cash (~$1,433-$2,642/month veteran, ~$951-$1,318 spouse) for care costs (e.g., in-home, assisted living)

Places of interest near Oak Grove Christian Retirement Village

Address 0.0 miles from city center Info Estimated distance in miles from Demotte's city center to Oak Grove Christian Retirement Village's address, calculated via Google Maps.

Calculate Travel Distance to Oak Grove Christian Retirement Village

Add your location

Address

Staffing Data (Q2 2025)

This data corresponds to Q2 2025 and is based on CMS Payroll-Based Journal.

Total staff 188
Employees 84
Contractors 104
Staff to resident ratio 3.03:1
3032158% better than Indiana average

Indiana average ratio: 0.00:1

Avg staff/day 40
Average shift 7.1 hours
8% worse than Indiana average

Indiana average: 7.7 hours

Total staff hours (quarter) 25,941

Nursing staff breakdown

Registered Nurse

Manages medical care and health needs.

Total count 11
Average shift length Info Average shift length. Calculated as total hours divided by days worked and average staff per day. 7.8 hours

No contractors work on this role.

Licensed Practical Nurse

Assists with medical care and medications.

Total count 39
Average shift length Info Average shift length. Calculated as total hours divided by days worked and average staff per day. 8.7 hours

This role is partially covered by contractors.

Certified Nursing Assistant

Helps with daily care and mobility.

Total count 90
Average shift length Info Average shift length. Calculated as total hours divided by days worked and average staff per day. 7.6 hours

This role is partially covered by contractors.

Contractor staffing

Total hours from contractors

25.6%

6,640 contractor hours this quarter

Certified Nursing Assistant: 56 Licensed Practical Nurse: 27 Speech Language Pathologist: 6 Physical Therapy Aide: 3 Respiratory Therapy Technician: 3 Physical Therapy Assistant: 2 Mental Health Service Worker: 1 Medication Aide/Technician: 1 Nurse Practitioner: 1 Medical Director: 1 Qualified Social Worker: 1 Occupational Therapy Aide: 1 Occupational Therapy Assistant: 1

Staff by category

Certified Nursing Assistant34569011,31191100%7.6
Licensed Practical Nurse1227394,18291100%8.7
Registered Nurse110113,26091100%7.8
Nurse Aide in Training9091,0677987%7
Clinical Nurse Specialist3039606571%8
Dietitian3039357481%6.6
Speech Language Pathologist0667847987%4.2
Medication Aide/Technician5167638088%6.3
Administrator1014886167%8
Respiratory Therapy Technician0334887481%3.2
Mental Health Service Worker1124495560%8
Nurse Practitioner1123474044%8.7
Physical Therapy Aide0332986571%3.7
Physical Therapy Assistant0222765055%5.4
Other Dietary Services Staff3031513842%3.4
Occupational Therapy Aide011681011%6.8
Qualified Social Worker011412629%1.6
Occupational Therapy Assistant011391516%2.6
Dental Services Staff1013344%8.3
Medical Director011333%1
90 Certified Nursing Assistant
% of Days 100%
39 Licensed Practical Nurse
% of Days 100%
11 Registered Nurse
% of Days 100%
9 Nurse Aide in Training
% of Days 87%
3 Clinical Nurse Specialist
% of Days 71%
3 Dietitian
% of Days 81%
6 Speech Language Pathologist
% of Days 87%
6 Medication Aide/Technician
% of Days 88%
1 Administrator
% of Days 67%
3 Respiratory Therapy Technician
% of Days 81%
2 Mental Health Service Worker
% of Days 60%
2 Nurse Practitioner
% of Days 44%
3 Physical Therapy Aide
% of Days 71%
2 Physical Therapy Assistant
% of Days 55%
3 Other Dietary Services Staff
% of Days 42%
1 Occupational Therapy Aide
% of Days 11%
1 Qualified Social Worker
% of Days 29%
1 Occupational Therapy Assistant
% of Days 16%
1 Dental Services Staff
% of Days 4%
1 Medical Director
% of Days 3%

Facility Characteristics

Source: CMS Long-Term Care Facility Characteristics (Data as of Jan 2026)

Total residents 62
Medicare
11
17.7% of residents
Medicaid
33
53.2% of residents
Private pay or other
18
29% of residents
Programs & Services
Residents Group

Residents meet regularly to discuss policies, care quality, and activities

CCRC

Part of a Continuing Care Retirement Community offering multiple care levels

Active Resident Council

Organized group of residents that meets regularly to discuss facility policies, quality of life, and activities.

Quality of care over time

These measures show how residents usually do over time at this home, based on health outcomes and preventive care.

High-risk clinical events score Info A composite score based on pressure ulcers, falls with injury, weight loss, walking ability decline, and activities of daily living decline. 9.8
22% worse than Indiana average

Indiana average: 8.0

Functional decline score Info A composite score based on activities of daily living decline, walking ability decline, and incontinence. 23.5
37% worse than Indiana average

Indiana average: 17.1

Long-stay resident measures
Significantly above average Info CMS star rating based on long-stay quality measure performance. 5 stars = significantly above average, 1 star = significantly below average.
Need for Help with Daily Activities Increased Info Percent of long-stay residents whose need for help with daily activities has increased 16.1%
34% worse than Indiana average

Indiana average: 12.0%

Walking Ability Worsened Info Percent of long-stay residents whose ability to move independently worsened 19.3%
34% worse than Indiana average

Indiana average: 14.4%

Low Risk Residents with Bowel/Bladder Incontinence Info Percent of low risk long-stay residents who lose control of their bowels or bladder 34.9%
42% worse than Indiana average

Indiana average: 24.6%

Falls with Major Injury Info Percent of long-stay residents experiencing one or more falls with major injury 3.4%
12% better than Indiana average

Indiana average: 3.9%

High Risk Residents with Pressure Ulcers Info Percent of long-stay high risk residents with pressure ulcers 7.9%
81% worse than Indiana average

Indiana average: 4.4%

Urinary Tract Infection Info Percent of long-stay residents with a urinary tract infection 2.3%
88% worse than Indiana average

Indiana average: 1.2%

Lost Too Much Weight Info Percent of long-stay residents who lose too much weight 2.2%
62% better than Indiana average

Indiana average: 5.7%

Depressive Symptoms Info Percent of long-stay residents who have depressive symptoms 0.0%
100% better than Indiana average

Indiana average: 24.1%

Antipsychotic Use Info Percent of long-stay residents who received an antipsychotic medication 6.8%
46% better than Indiana average

Indiana average: 12.4%

Pneumococcal Vaccine Info Percent of long-stay residents assessed and appropriately given the pneumococcal vaccine 74.6%
20% worse than Indiana average

Indiana average: 93.7%

Influenza Vaccine Info Percent of long-stay residents assessed and appropriately given the seasonal influenza vaccine 39.1%
59% worse than Indiana average

Indiana average: 95.4%

Hospitalizations per 1,000 days Info Number of hospitalizations per 1,000 long-stay resident days. 1.25
22% better than Indiana average

Indiana average: 1.60

ED visits per 1,000 days Info Number of outpatient emergency department visits per 1,000 long-stay resident days. 0.88
41% better than Indiana average

Indiana average: 1.48

Short-stay resident measures
Above average Info CMS star rating based on short-stay quality measure performance. 5 stars = much above average, 1 star = much below average.
Pneumococcal Vaccine Info Percent of short-stay residents assessed and appropriately given the pneumococcal vaccine 33.8%
59% worse than Indiana average

Indiana average: 81.7%

Antipsychotic medication increase Info Percent of short-stay residents who newly received an antipsychotic medication 1.5%
9% worse than Indiana average

Indiana average: 1.4%

Influenza Vaccine Info Percent of short-stay residents assessed and appropriately given the seasonal influenza vaccine 7.1%
91% worse than Indiana average

Indiana average: 79.0%

Re-hospitalized after SNF stay Info Percentage of short-stay residents who were re-hospitalized after their nursing home admission. 23.6%
5% worse than Indiana average

Indiana average: 22.4%

Emergency department visits Info Percentage of short-stay residents who had an outpatient emergency department visit. 4.1%
61% better than Indiana average

Indiana average: 10.5%

Falls with major injury Info Percentage of SNF residents who experience falls with major injury during their stay. 2.4%
209% worse than Indiana average

Indiana average: 0.8%

Ability to care for self at discharge Info Percentage of residents at or above expected ability to care for themselves at discharge. 70.8%
32% better than Indiana average

Indiana average: 53.7%

Successful return to home or community Info Rate of successful return to home or community from a skilled nursing facility. 39.6%
22% worse than Indiana average

Indiana average: 50.6%

Penalties and fines

Federal penalties imposed by CMS for regulatory violations, including civil money penalties (fines) and denials of payment for new Medicare/Medicaid admissions.

Source: CMS Penalties Database

No penalties in the past 3 years

No civil money penalties or payment denials were reported in the last 3 years.

Compare Nursing Home around Indiana

The information below is reported by the Indiana Department of Health, Division of Long Term Care.

5 facilities compared · CMS & IN Dept. of Health data · Updated May 2026

Filter by care type
Adams Woodcrest
NH

Nursing Home Licensed facility providing 24/7 skilled nursing care for residents with complex, ongoing medical needs. Staffed by RNs, LPNs, and CNAs. Inspected and star-rated annually by CMS. Accepts Medicare (short-term rehab) and Medicaid (long-term care).

AL

Assisted Living A licensed, long-term care setting for seniors or individuals with disabilities who need help with daily activities — like bathing, dressing, and medication management — but not 24-hour skilled nursing. Offers housing, meals, and around-the-clock support while aiming to maximize resident independence.

Decatur167 67.1% -3%3.69 -10%+7%022.0-108- 79 Adams County Memorial Hospital$12.8M$5.6M43.8%155747
Adams Heritage
NH

Nursing Home Licensed facility providing 24/7 skilled nursing care for residents with complex, ongoing medical needs. Staffed by RNs, LPNs, and CNAs. Inspected and star-rated annually by CMS. Accepts Medicare (short-term rehab) and Medicaid (long-term care).

AL

Assisted Living A licensed, long-term care setting for seniors or individuals with disabilities who need help with daily activities — like bathing, dressing, and medication management — but not 24-hour skilled nursing. Offers housing, meals, and around-the-clock support while aiming to maximize resident independence.

Monroeville61 60.7% -13%4.12 +29%+20%021.0-39A+ 40 Adams County Memorial Hospital$5.5M$2.5M44.8%155729
Addison Pointe Health & Rehabilitation Center
NH

Nursing Home Licensed facility providing 24/7 skilled nursing care for residents with complex, ongoing medical needs. Staffed by RNs, LPNs, and CNAs. Inspected and star-rated annually by CMS. Accepts Medicare (short-term rehab) and Medicaid (long-term care).

AL

Assisted Living A licensed, long-term care setting for seniors or individuals with disabilities who need help with daily activities — like bathing, dressing, and medication management — but not 24-hour skilled nursing. Offers housing, meals, and around-the-clock support while aiming to maximize resident independence.

Chesterton100 93.0% +34%3.16 -5%-8%1274.5193- 73 Steven Dobben$15.3M$5.3M34.6%155805
Albany Health Care & Rehabilitation Center
NH

Nursing Home Licensed facility providing 24/7 skilled nursing care for residents with complex, ongoing medical needs. Staffed by RNs, LPNs, and CNAs. Inspected and star-rated annually by CMS. Accepts Medicare (short-term rehab) and Medicaid (long-term care).

AL

Assisted Living A licensed, long-term care setting for seniors or individuals with disabilities who need help with daily activities — like bathing, dressing, and medication management — but not 24-hour skilled nursing. Offers housing, meals, and around-the-clock support while aiming to maximize resident independence.

Albany102 75.5% +9%3.51 +4%+2%0193.2177- 34 Melanie Troxwell$12.4M$4.3M34.7%155432
Oak Grove Christian Retirement Village
NH

Nursing Home Licensed facility providing 24/7 skilled nursing care for residents with complex, ongoing medical needs. Staffed by RNs, LPNs, and CNAs. Inspected and star-rated annually by CMS. Accepts Medicare (short-term rehab) and Medicaid (long-term care).

AL

Assisted Living A licensed, long-term care setting for seniors or individuals with disabilities who need help with daily activities — like bathing, dressing, and medication management — but not 24-hour skilled nursing. Offers housing, meals, and around-the-clock support while aiming to maximize resident independence.

Demotte123 75.6% +9%4.31 -38%+26%0515.1156A+ 52 Oakgrove Christian Retirement Village$13.7M$3.5M25.7%155667

Guides for Better Senior Living

Care Cost Calculator: See Prices in Your Area

Nursing Home Data Explorer

Don’t Wait Too Long: 7 Red Flag Signs Your Parent Needs Assisted Living Now

The True Cost of Assisted Living in 2025 – And How Families Are Paying For It

Understanding Senior Living Costs: Pricing Models, Discounts & Financial Assistance

Frequently Asked Questions about Oak Grove Christian Retirement Village

Who is the Director of Nursing at Oak Grove Christian Retirement Village?

Patricia Johnson is the Director of Nursing at Oak Grove Christian Retirement Village.

Who is the owner of Oak Grove Christian Retirement Village?

The legal owner and operator of Oak Grove Christian Retirement Village is Woodlawn Hospital.

Is Oak Grove Christian Retirement Village in a walkable area?

Oak Grove Christian Retirement Village has a walk score of 52. Moderately walkable. Some errands can be accomplished on foot, with a mix of nearby amenities.

What is the license number of Oak Grove Christian Retirement Village?

According to IN state health department records, Oak Grove Christian Retirement Village's license number is 25-010823-1.

When does Oak Grove Christian Retirement Village's license expire?

According to IN state health department records, Oak Grove Christian Retirement Village's license expires on December 31, 2025.

What is the occupancy rate at Oak Grove Christian Retirement Village?

Oak Grove Christian Retirement Village's occupancy is 46%.

Who is the administrator of Oak Grove Christian Retirement Village?

Beth Ingram is the administrator of Oak Grove Christian Retirement Village.

Explore Open Rooms
1 Contact details
2 What type of senior care service are you looking for?
3 What budget do you have in mind for senior care?
4 How soon do you need to find care?
5 Additional details

Thank you for your interest!

Our team will be in touch shortly to help with next steps.