Ormond In The Pines
Nursing Home, Assisted Living & Independent Living · Palm Beach County, FL
CMS overall rating Info CMS (the Centers for Medicare & Medicaid Services) is the federal agency that rates nursing home quality. Its Overall Rating runs from 1 to 5 stars, combining health inspections, staffing, and quality measures, with inspections weighted most heavily.

Ormond In The Pines

Nursing Home, Assisted Living & Independent Living · Palm Beach County, FL
CMS overall rating Info CMS (the Centers for Medicare & Medicaid Services) is the federal agency that rates nursing home quality. Its Overall Rating runs from 1 to 5 stars, combining health inspections, staffing, and quality measures, with inspections weighted most heavily.
Calculator: See prices in your area
Ormond In The Pines accepts Medicare, Medicaid, and private pay.

Overview of Ormond in the Pines

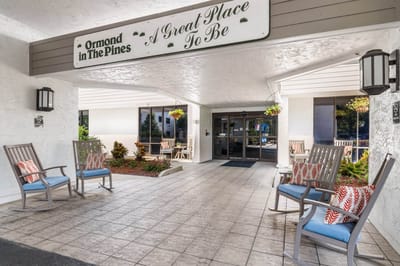
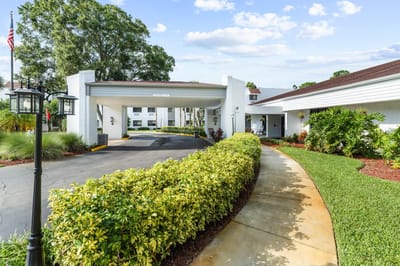
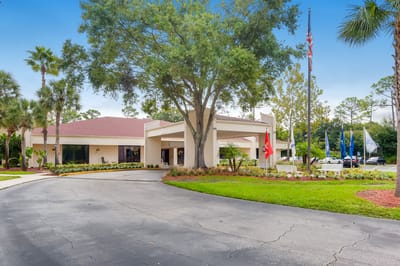
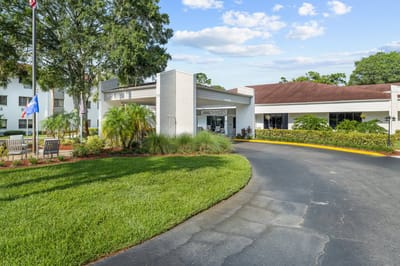
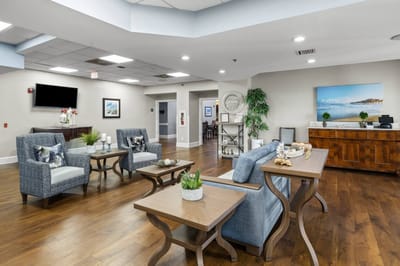
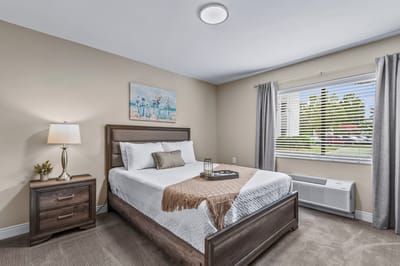
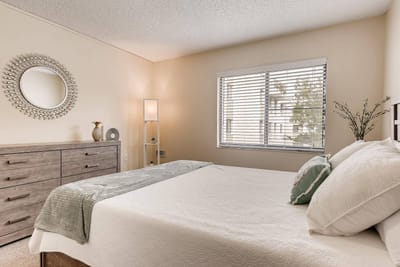
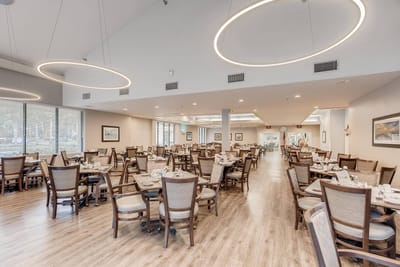
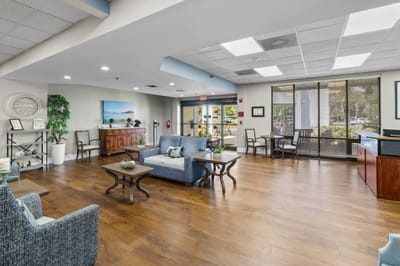
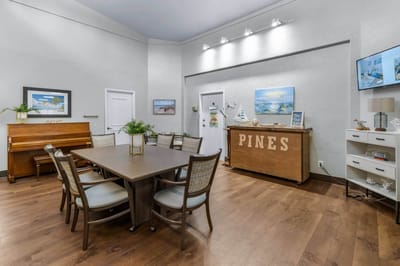
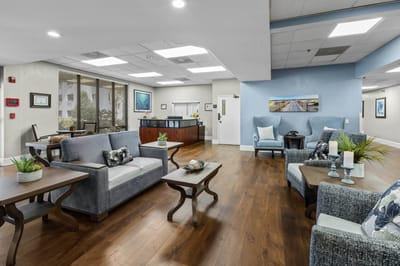
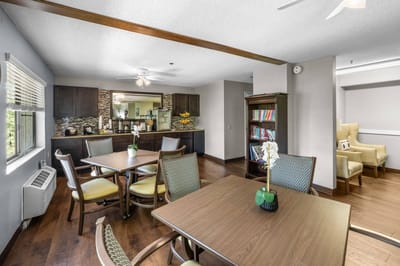
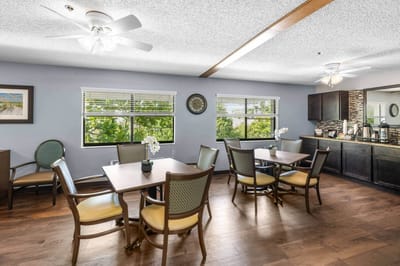
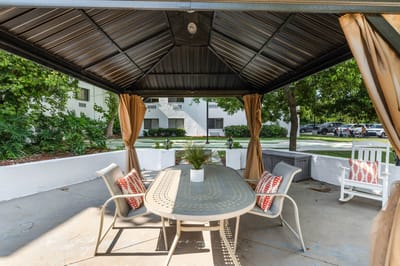
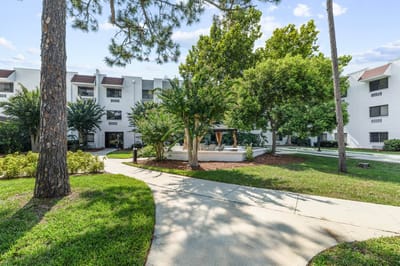
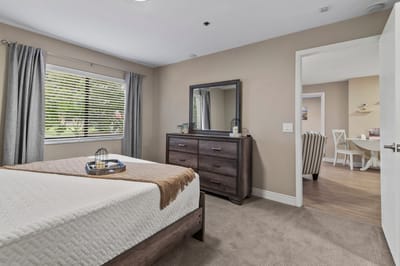
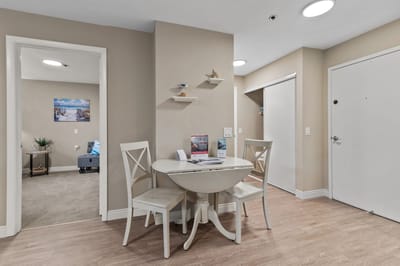
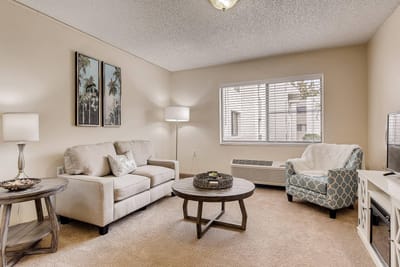
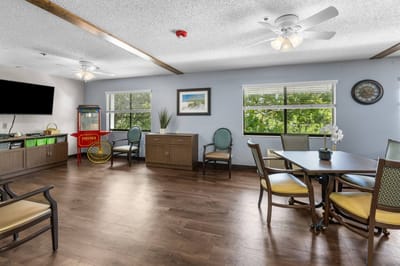
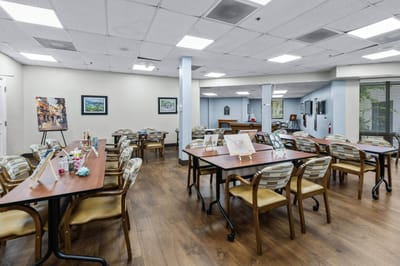
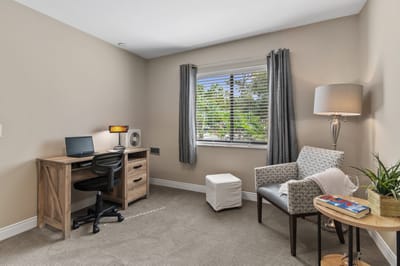
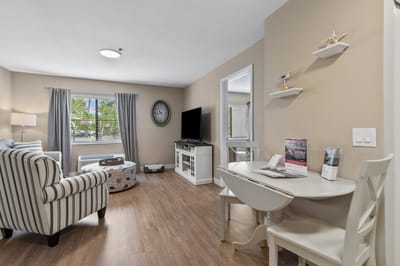
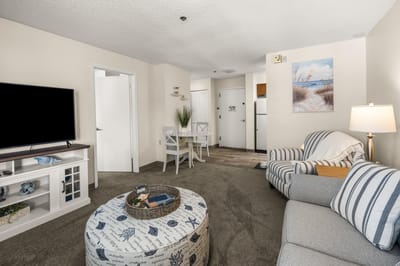
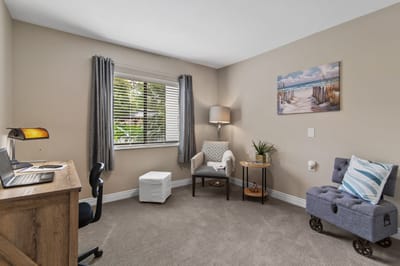
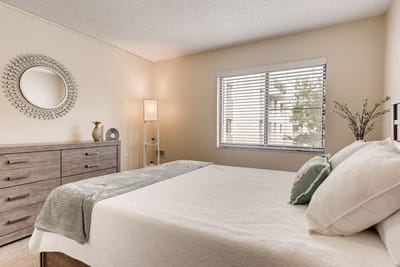
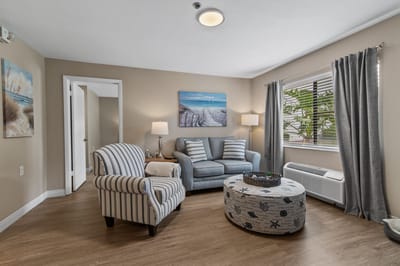
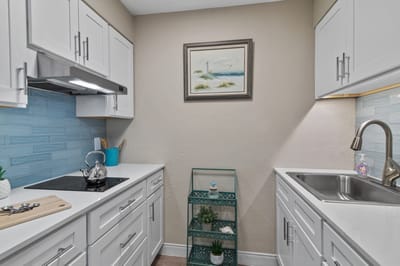
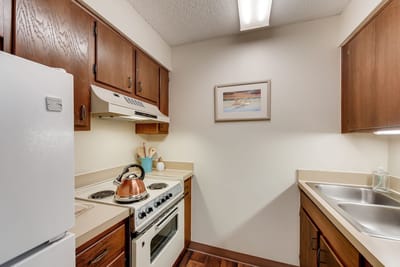
Set in the beautiful setting of Ormond Beach, FL, Ormond in the Pines is an exceptional senior living community that offers independent living. Relax in comfortable and thoughtfully designed accommodations in variations of studio, one-bedroom, and two-bedroom apartments with wheelchair-accessible units for residents with mobility needs. A compassionate team is available to provide various assistance with home maintenance and other things residents may need help with, ensuring they live in comfort and convenience.

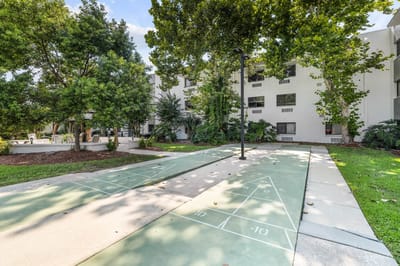
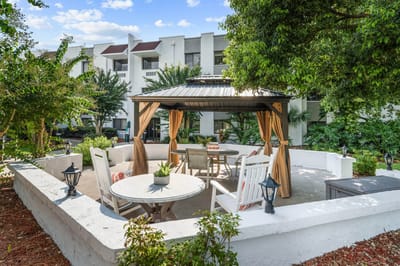
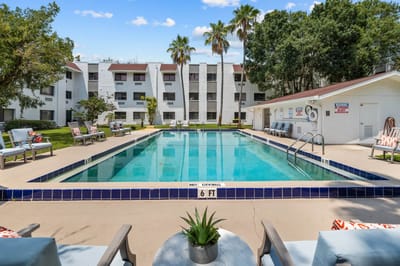
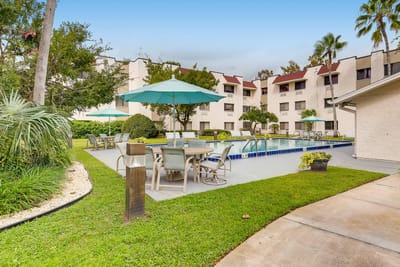
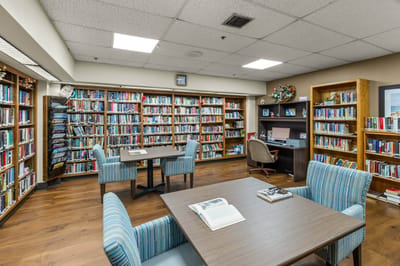
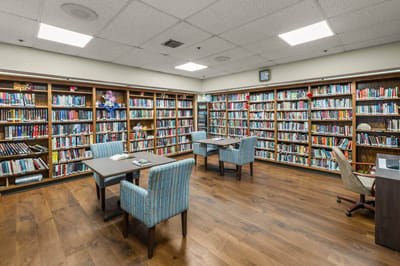
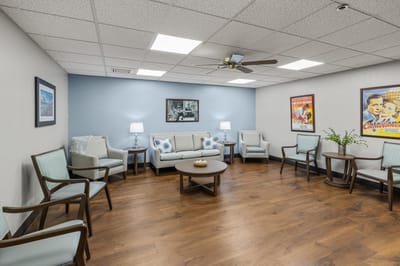
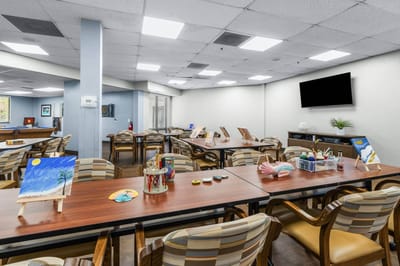
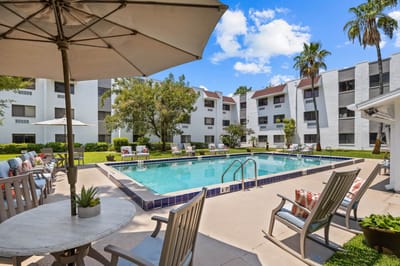
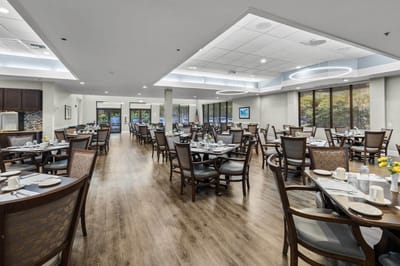
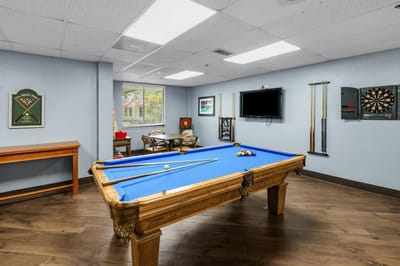
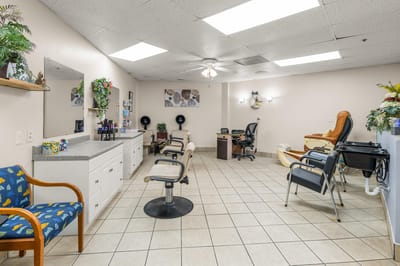
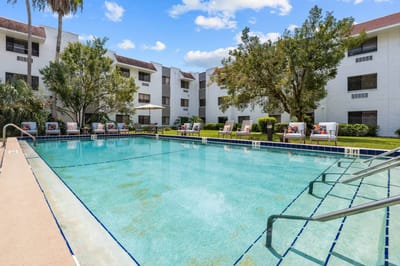
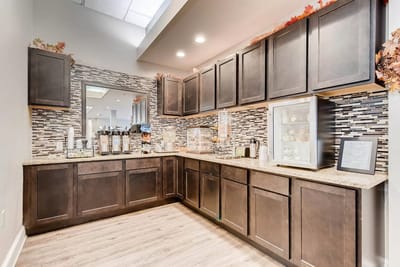
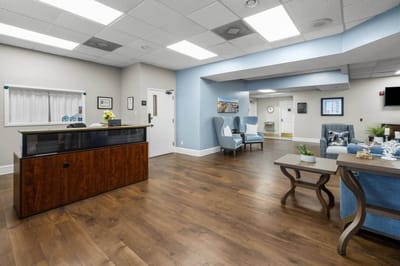
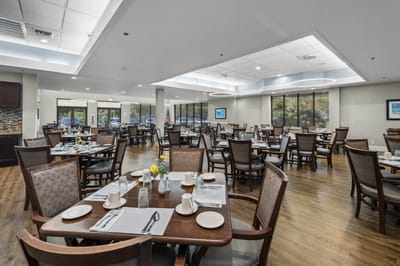
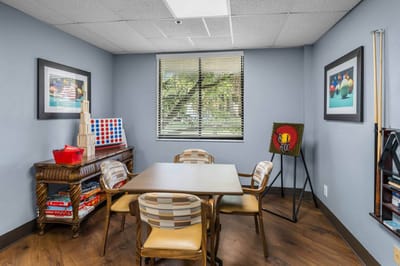
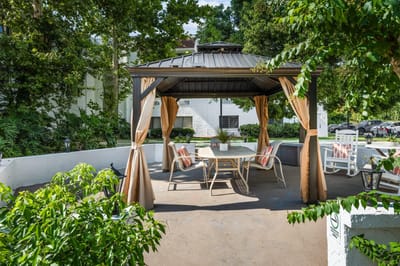
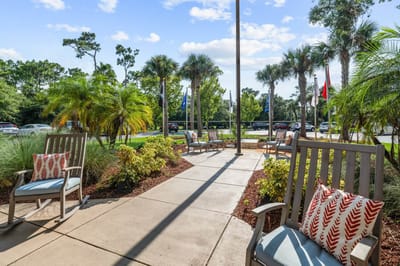
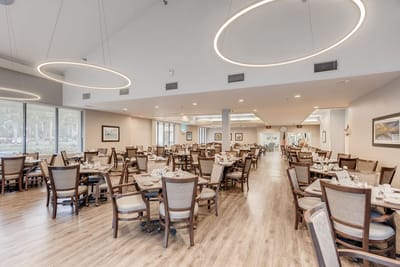
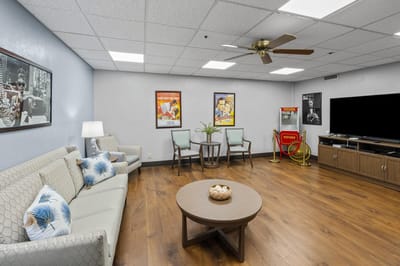
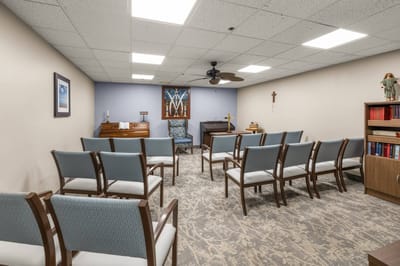
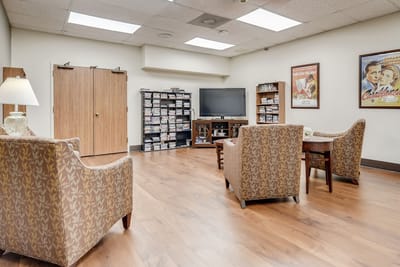
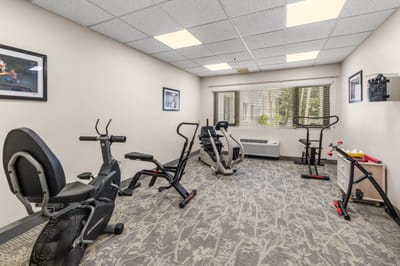
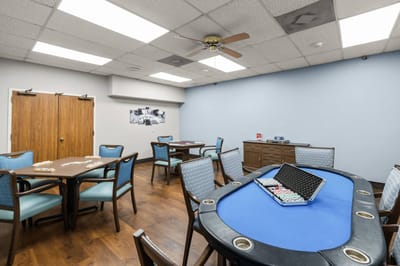
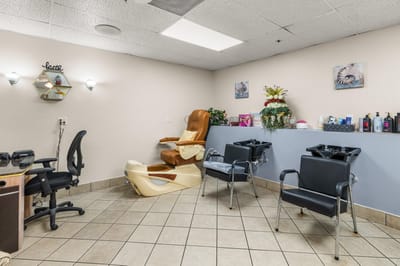
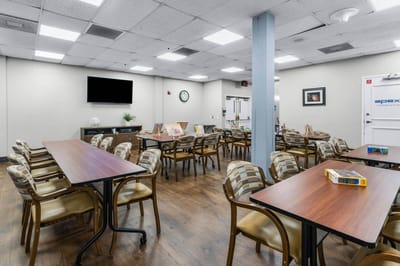
With most of the hassles and chores of daily living handled, residents enjoy the freedom to engage in a full calendar of enriching activities and enjoy a wide range of delightful amenities. The community provides a bistro area, salon & barbershop, a TV lounge, activity room, heated outdoor swimming pool, and refreshing courtyard gardens and walking paths. With a variety of vibrant activities and community spaces, residents have plenty of options to relax and enjoy.

(503) 665-6558

Quality ratings

Measured by Centers for Medicare & Medicaid Services (CMS)

Overall rating Info The Overall CMS Rating combines results from health inspections, staffing levels and quality measures. Health inspections carry the most weight. Staffing and quality scores can increase or decrease the final rating based on performance compared to state and national standards.
▲ 26.0% Above FL avg. ▲ 26.0% Above FL avg.FL average: 3.2Click the badge to see the full State ranking.Click here to see the full State ranking.
Health Inspection Info Based on the results of the facility's three most recent standard inspections and any complaint investigations. CMS reviews the number, scope, and severity of deficiencies, with more recent findings weighted more heavily.
▲ 6.7% Above FL avg. ▲ 6.7% Above FL avg.FL average: 2.8Click the badge to see the full State ranking.Click here to see the full State ranking.
Staffing Info Measures average nursing staff hours per resident per day, including Registered Nurses (RNs) and total nursing staff. Ratings are adjusted based on the level of care residents require and are compared to state and national benchmarks.
▲ 18.2% Above FL avg. ▲ 18.2% Above FL avg.FL average: 3.4Click the badge to see the full State ranking.Click here to see the full State ranking.
Quality Measures Info Based on clinical and physical health indicators reported to CMS, such as hospital readmissions, falls, pressure ulcers, and improvements in mobility. These measures reflect how well residents' health needs are being managed.
▲ 23.2% Above FL avg. ▲ 23.2% Above FL avg.FL average: 4.1Click the badge to see the full State ranking.Click here to see the full State ranking.

Staffing hours breakdown

Info Daily nursing hours per resident by staff type, reported to CMS. Higher is generally better — compare this facility to state and national averages to see where staffing stands.

Hours per resident per day — compared to Florida state averages

Total nursing care / resident Info This home is ranked 110th out of 253 homes in Florida for nurse hours. Total adjusted nursing hours per resident per day, combining RN, LPN, and aide time. CMS adjusts this for case-mix so facilities can be fairly compared.
4h 1m per day
Rank #110 / 253Nurse hours — State benchmarkedThis home is ranked 110th out of 253 homes in Florida. Shows adjusted nurse hours per resident per day benchmarked to the Florida average, with a ranking across 253 Florida facilities. More hours mean more direct care. The national average is about 3.5 hrs; below 3.0 is a red flag.Ranking totals vary by category as each rank only includes facilities that report data for that metric. Homes missing that data point aren't included in the ranking.Click the rank badge to see the full State ranking.Click here to see the full State ranking.
This facility Florida avg (4h 2m per day)
vs Florida avg
-1%

1 of 6 metrics below state avg

Standout metric Weekend RN is +46% above state avg
Staff typeHours / Day / Residentvs state avg
Registered Nurse (RN) Info RNs hold the highest nursing license and can assess residents, interpret test results, and direct care plans. More RN hours per day often signals stronger clinical oversight and faster response to health changes. 53m per day ▲ 20% State avg: 44m per day · National avg: 41m per day
LPN / LVN Info Licensed Practical Nurses (LPNs) or Licensed Vocational Nurses (LVNs) deliver routine hands-on care — medication administration, wound dressing, and monitoring vital signs. They work under RN supervision and make up a large share of daily bedside care. 54m per day ▲ 14% State avg: 47m per day · National avg: 52m per day
Nurse Aide Info Certified Nurse Aides (CNAs) provide the most direct day-to-day assistance: bathing, dressing, feeding, and mobility. Nurse aide hours are typically the largest staffing category and directly affect residents' quality of life. 2h 11m per day ▼ 7% State avg: 2h 20m per day · National avg: 2h 20m per day
Weekend Total Nursing Info Combined nursing hours (RN + LPN + Nurse Aide) per resident per day on weekends. Staffing often drops on weekends — this figure reveals whether the facility maintains adequate coverage outside of weekday hours. 3h 34m per day ■ Avg State avg: 3h 32m per day · National avg: 3h 27m per day
Physical Therapist Info Hours per resident per day provided by licensed Physical Therapists (PTs) or PT Assistants. PT services help residents recover mobility after injury or illness and are especially important for post-acute (short-stay) rehabilitation. 6m per day ▲ 10% State avg: 6m per day · National avg: 4m per day
Weekend RN Info Registered nurse hours specifically on weekends. Facilities sometimes reduce RN presence on Saturdays and Sundays — a low weekend RN figure compared to weekday hours can indicate reduced clinical oversight when most administrative staff are absent. 47m per day ▲ 46% State avg: 32m per day · National avg: 29m per day

Capacity and availability

Avg. Length of Stay
38 days
Bed community size
95-bed community Rank #504 / 1074Bed count — State benchmarkedThis home is ranked 504th out of 1074 homes in Florida. Shows this facility's certified or reported bed count compared to other Florida facilities. Larger communities may offer more amenities, programs, and on-site services for residents and families.Ranking totals vary by category as each rank only includes facilities that report data for that metric. Homes missing that data point aren't included in the ranking.Click the rank badge to see the full State ranking.Click here to see the full State ranking.
A larger shared setting that may offer more common spaces and organized community services.
Walk Score
Walk Score: 41 / 100 Rank #702 / 1486Walk Score — State benchmarkedThis home is ranked 702nd out of 1486 homes in Florida. Shows how walkable this facility's neighborhood is compared to the average Walk Score across Florida facilities. Higher scores benefit residents, families, and staff.Ranking totals vary by category as each rank only includes facilities that report data for that metric. Homes missing that data point aren't included in the ranking.Click the rank badge to see the full State ranking.Click here to see the full State ranking.
Somewhat walkable. A few nearby services may be reachable on foot, but most trips require transportation.

About this community

Occupancy

Occupancy rate
86%
Rank #164 / 258Occupancy rate — State benchmarkedThis home is ranked 164th out of 258 homes in Florida. Shows this facility's occupancy rate versus the Florida average, with its Statewide rank out of 258. Higher occupancy signals strong local demand and financial stability.Ranking totals vary by category as each rank only includes facilities that report data for that metric. Homes missing that data point aren't included in the ranking.Click the rank badge to see the full State ranking.Click here to see the full State ranking.
Similar to the Florida average: 84.3%
Occupied beds
82 / 95
Average occupied beds in Florida homes 108 beds

License Details

Facility TypeAssisted Living Facility
StatusLicensed
IssuanceDecember 1, 2024
ExpirationNovember 30, 2026
CountyVolusia
License Number5535

Ownership & Operating Entity

Ormond In The Pines is legally operated by 101 Clyde Morris Boulevard Opco Llc, and administrated by Charles Dellaria.

Management CompanyAMERICAN TRUST SENIOR CARE, LLC
Profit StatusFor-Profit

Type Of Units

Private
95 units
Total beds
95 units

Safety & Compliance

Wheelchair Accessible
Emergency SystemsEmergency response pendant.
Safety FeaturesSafety rails, smoke alarm & sprinkler system.

Staffing

Key information about the people who lead and staff this community.

Additional Policies & Features

HousekeepingYes

Amenities & Lifestyle

Chef-Prepared Meals With Tableside Services
Senior-Equipped Fitness Center
Heated Outdoor Swimming Pool
Courtyard
Gardens & Walking Paths
Private Dining Room
Covered Parking Available
Business Center
Bistro Area
On-Site Laundry Available
Community Center
Activity Room
Salon & Barber Shop
Large Screen Tv Lounge
Locked Mailboxes
Country Store
Pets Welcome
ActivitiesFull calendar of enriching activities.
Specific ProgramsExclusive Programs, Military Veterans Program

Dining & Nutrition

Food DescriptionChef-prepared meals with tableside services.

Contact Ormond In The Pines

Inspection History

In Florida, the Agency for Health Care Administration (AHCA) is the primary authority that conducts unannounced inspections and completes official health quality reports for all healthcare facilities.

Since 2012 · 14 years of data 38 citations 37 inspections 4 fines $3.6K fined
Inspection Score Info A composite 0–100 score combining this facility's inspections, citations, complaints, and enforcement actions relative to the Florida state average. The score below shows how many points this facility sits above or below the typical Florida assisted living residence score (the benchmark); higher is better.

2 points below the Florida average for assisted living residences (83/100)

Rank #556 / 876 in Florida Inspection Score — State benchmarked This home is ranked 556th out of 876 homes in Florida. Shows this facility's inspection score compared to the Florida average among 876 comparable communities in the ranking pool. Ranking totals vary by category as each rank only includes facilities that report data for that metric. Homes missing that data point aren't included in the ranking. Inspection score: 81 out of 100. Letter grade B-. 2 points below the Florida average for assisted living residences (83/100)

Inspection Scorecard Info This scorecard compares key inspection, citation, and complaint metrics at this facility against the Florida state average. Metrics rated ≥15% worse than average are highlighted in red; those ≥15% better are highlighted in green.

Since 2012 vs. Florida state average
Overall vs. FL average 5 Worse Metrics worse than Florida average:
• Total citations (15% above)
• Citations per year (13% above)
• Total inspections (42% above)
• Inspections with citations (100% above)
• Inspection citation rate (39% above)
1 Better Metrics better than Florida average:
• Citations per inspection (23% below)
Latest Inspection October 27, 2025 Standard

Citations Info Citations are formal regulatory issues recorded during state inspections.

This FacilityFL Averagevs. FL Avg
Total citations Info Formal regulatory issues recorded by inspectors across all inspection types. 3833 This facility has 15% more total citations than a typical Florida assisted living residence (38 vs. FL avg 33).↑ 15% worse Rank #592 / 919 Total citations — State benchmarked This home is ranked 592nd out of 919 homes in Florida. Shows this facility's total citations compared to the Florida average among 919 comparable communities in the ranking pool. Ranking totals vary by category as each rank only includes facilities that report data for that metric. Homes missing that data point aren't included in the ranking.
Citations per year Info Average citations per year since 2012. 2.72.4 This facility has 13% more citations per year than a typical Florida assisted living residence (2.7 vs. FL avg 2.4).↑ 13% worse
Citations per inspection Info Average citations per inspection. 11.3 This facility has 23% fewer citations per inspection than a typical Florida assisted living residence (1 vs. FL avg 1.3).↓ 23% better Rank #167 / 919 Citations per inspection — State benchmarked This home is ranked 167th out of 919 homes in Florida. Shows this facility's citations per inspection compared to the Florida average among 919 comparable communities in the ranking pool. Ranking totals vary by category as each rank only includes facilities that report data for that metric. Homes missing that data point aren't included in the ranking.

Inspections Info State inspections evaluate whether the facility meets health and safety standards.

This FacilityFL Averagevs. FL Avg
Total inspections Info Combined count of all routine and focused inspections. Excludes complaint investigations. 3726 This facility has 42% more total inspections than a typical Florida assisted living residence (37 vs. FL avg 26).↑ 42% worse
Inspections with citations Info Inspections that resulted in at least one regulatory citation. 3216 This facility has 100% more inspections with citations than a typical Florida assisted living residence (32 vs. FL avg 16).↑ 100% worse
Inspection citation rate Info Percentage of inspections that resulted in at least one citation. 86%62% This facility has 24 percentage points higher inspection citation rate than a typical Florida assisted living residence (86% vs. FL avg 62%).↑ 24% worse Rank #876 / 919 Inspection citation rate — State benchmarked This home is ranked 876th out of 919 homes in Florida. Shows this facility's % of inspections with citations compared to the Florida average among 919 comparable communities in the ranking pool. Ranking totals vary by category as each rank only includes facilities that report data for that metric. Homes missing that data point aren't included in the ranking.

Inspection Reports Summary Info An editor-reviewed summary of the themes and findings across this facility's recent inspection reports.

  • October 27, 2025 inspection closed with no deficiencies, showing the facility met all state standards at that time.
  • September 23, 2025 routine inspection cited three Class 3 deficiencies for staff training, including Alzheimer’s disease/dementia and Do Not Resuscitate orders.
  • Deficiencies over recent years focused mainly on training, staff records, and resident care, with no immediate jeopardy or harm-level citations reported.

Health Inspection History

Inspections since 2022
Total health inspections 4

Florida average 4.3


Last Health inspection on Aug 2025

Total health citations
21 Rank #149 / 252Health citations — State benchmarkedThis home is ranked 149th out of 252 homes in Florida. Shows this facility's total health deficiency citations benchmarked to the Florida State average, with a ranking across all 252 FL facilities. Lower citation counts earn a better rank.Ranking totals vary by category as each rank only includes facilities that report data for that metric. Homes missing that data point aren't included in the ranking.Click the rank badge to see the full State ranking.Click here to see the full State ranking.

Florida average 19.7

Citations per inspection
5.25 Rank #176 / 252Citations per inspection — State benchmarkedThis home is ranked 176th out of 252 homes in Florida. Shows average deficiency citations per CMS inspection for this facility versus the Florida mean across 252 facilities with citation data. Lower is better.Ranking totals vary by category as each rank only includes facilities that report data for that metric. Homes missing that data point aren't included in the ranking.Click the rank badge to see the full State ranking.Click here to see the full State ranking.

Florida average 4.48


Health citations are formal notices following inspections when they fail to comply with safety and care standards.

20 of 21 citations resulted from standard inspections; and 1 of 21 resulted from complaint investigations.

Breakdown of citation severity (last 4 years)
Critical health citations
0
100% better than Florida average

Florida average: 0.8


Serious health citations
0
100% better than Florida average

Florida average: 0.4

0 critical citations Florida average: 0.8

0 serious citations Florida average: 0.4

21 moderate citations Florida average: 18.4

0 minor citations Florida average: 0.2
Citations history (last 4 years)
Environmental moderate citation Aug 27, 2025
Corrected

Quality of Care moderate citation Aug 27, 2025
Corrected

Care Planning moderate citation Aug 27, 2025
Corrected

Care Planning moderate citation Aug 27, 2025
Corrected

Staffing Data

Reporting period: October 1 – December 31, 2025 (Q4 2025). Source: CMS Payroll-Based Journal report.

Total staff 92
Employees 87
Contractors 5
Staff to resident ratio 1.70 : 1
16% more staff per resident than Florida average
Florida average ratio: 1.47 : 1 Florida average ratio: 1.47 : 1See full Florida ranking
Avg staff/day 36
Average shift 7.4 hours
6% worse than Florida average
Florida average: 7.9 hours Florida average shift: 7.9 hoursSee full Florida ranking
Total staff hours (quarter) 24,508

Nursing staff breakdown

Q4 2025 · Oct 1 – Dec 31 More info This data comes from the CMS Payroll-Based Journal report covering October 1 – December 31, 2025.
Registered Nurse

Manages medical care and health needs.

RN Staff Info All 10 RN Staff are full-time employees. No contractors work on this role. 10
Average shift length Info Average shift length. Calculated as total hours divided by days worked and average staff per day. 9.8 hours
Licensed Practical Nurse

Assists with medical care and medications.

LPN Staff Info All 14 LPN Staff are full-time employees. No contractors work on this role. 14
Average shift length Info Average shift length. Calculated as total hours divided by days worked and average staff per day. 8.7 hours
Certified Nursing Assistant

Helps with daily care and mobility.

CNA Staff Info All 40 CNA Staff are full-time employees. No contractors work on this role. 40
Average shift length Info Average shift length. Calculated as total hours divided by days worked and average staff per day. 7.1 hours

Contractor staffing

Q4 2025 · Oct 1 – Dec 31 More info This data comes from the CMS Payroll-Based Journal report covering October 1 – December 31, 2025.

Total hours from contractors

1.5%

363 contractor hours this quarter

Occupational Therapy Assistant: 3 Occupational Therapy Aide: 1 Medical Director: 1

Staff by category

Q4 2025 · Oct 1 – Dec 31 More info This data comes from the CMS Payroll-Based Journal report covering October 1 – December 31, 2025.
Certified Nursing Assistant4004010,59992100%7.1
Licensed Practical Nurse140143,27192100%8.7
Registered Nurse100103,08292100%9.8
RN Director of Nursing2021,0986672%8.4
Respiratory Therapist4041,0167582%7.6
Clinical Nurse Specialist2026536470%6.7
Dental Services Staff1015437177%7.6
Administrator1015286672%8
Nurse Practitioner1015286672%8
Mental Health Service Worker1015126470%8
Respiratory Therapy Technician2025087177%6.6
Dietitian1014886166%8
Qualified Social Worker2024576975%6.6
Speech Language Pathologist4044426874%5.8
Other Dietary Services Staff1013104650%6.7
Occupational Therapy Aide0112636065%4.4
Physical Therapy Assistant1011114448%2.5
Medical Director011544043%1.4
Occupational Therapy Assistant033473538%1.3
40 Certified Nursing Assistant
% of Days 100%
14 Licensed Practical Nurse
% of Days 100%
10 Registered Nurse
% of Days 100%
2 RN Director of Nursing
% of Days 72%
4 Respiratory Therapist
% of Days 82%
2 Clinical Nurse Specialist
% of Days 70%
1 Dental Services Staff
% of Days 77%
1 Administrator
% of Days 72%
1 Nurse Practitioner
% of Days 72%
1 Mental Health Service Worker
% of Days 70%
2 Respiratory Therapy Technician
% of Days 77%
1 Dietitian
% of Days 66%
2 Qualified Social Worker
% of Days 75%
4 Speech Language Pathologist
% of Days 74%
1 Other Dietary Services Staff
% of Days 50%
1 Occupational Therapy Aide
% of Days 65%
1 Physical Therapy Assistant
% of Days 48%
1 Medical Director
% of Days 43%
3 Occupational Therapy Assistant
% of Days 38%

Penalties and fines

Federal penalties imposed by CMS for regulatory violations, including civil money penalties (fines) and denials of payment for new Medicare/Medicaid admissions.

Source: CMS Penalties Database

No penalties in the past 3 years

No civil money penalties or payment denials were reported in the last 3 years.

Quality of care over time

These measures show how residents usually do over time at this home, based on health outcomes and preventive care.

High-risk clinical events score Info A composite score based on pressure ulcers, falls with injury, weight loss, walking ability decline, and activities of daily living decline. 8.8
18% worse than Florida average

Florida average: 7.4

Functional decline score Info A composite score based on activities of daily living decline, walking ability decline, and incontinence. 18.9
52% worse than Florida average

Florida average: 12.4

Long-stay resident measures
Need for Help with Daily Activities Increased Info Percent of long-stay residents whose need for help with daily activities has increased 16.3%
55% worse than Florida average

Florida average: 10.5%

Walking Ability Worsened Info Percent of long-stay residents whose ability to move independently worsened 17.9%
38% worse than Florida average

Florida average: 12.9%

Low Risk Residents with Bowel/Bladder Incontinence Info Percent of low risk long-stay residents who lose control of their bowels or bladder 22.3%
65% worse than Florida average

Florida average: 13.5%

Falls with Major Injury Info Percent of long-stay residents experiencing one or more falls with major injury 3.5%
34% worse than Florida average

Florida average: 2.6%

High Risk Residents with Pressure Ulcers Info Percent of long-stay high risk residents with pressure ulcers 2.1%
61% better than Florida average

Florida average: 5.4%

Urinary Tract Infection Info Percent of long-stay residents with a urinary tract infection 5.4%
513% worse than Florida average

Florida average: 0.9%

Lost Too Much Weight Info Percent of long-stay residents who lose too much weight 4.0%
33% better than Florida average

Florida average: 6.0%

Depressive Symptoms Info Percent of long-stay residents who have depressive symptoms 17.5%
424% worse than Florida average

Florida average: 3.3%

Antipsychotic Use Info Percent of long-stay residents who received an antipsychotic medication 2.7%
67% better than Florida average

Florida average: 8.0%

Pneumococcal Vaccine Info Percent of long-stay residents assessed and appropriately given the pneumococcal vaccine 96.5%
In line with Florida average

Florida average: 97.7%

Influenza Vaccine Info Percent of long-stay residents assessed and appropriately given the seasonal influenza vaccine 93.8%
5% worse than Florida average

Florida average: 99.2%

Short-stay resident measures
Pneumococcal Vaccine Info Percent of short-stay residents assessed and appropriately given the pneumococcal vaccine 87.1%
7% worse than Florida average

Florida average: 94.0%

Antipsychotic medication increase Info Percent of short-stay residents who newly received an antipsychotic medication 1.0%
36% better than Florida average

Florida average: 1.5%

Influenza Vaccine Info Percent of short-stay residents assessed and appropriately given the seasonal influenza vaccine 80.5%
15% worse than Florida average

Florida average: 94.7%

Breakdown by payment type

Medicare

34% of new residents, usually for short-term rehab.

Typical stay 28 days

Private pay

26% of new residents, often for short stays.

Typical stay 1 - 2 months

Medicaid

41% of new residents, often for long-term daily care.

Typical stay 30 days

Facility Characteristics

Source: CMS Long-Term Care Facility Characteristics (Data as of Jan 2026)

Total residents 54
Medicare
12
22.2% of residents
Medicaid
5
9.3% of residents
Private pay or other
37
68.5% of residents
Programs & Services
Residents Group

Residents meet regularly to discuss policies, care quality, and activities

Active Resident Council

Organized group of residents that meets regularly to discuss facility policies, quality of life, and activities.

Finances and operations

Based on CMS SNF Cost Report for fiscal year ending in 12/2023.

Privately-owned community
Operated by a single business entity.
Net patient revenue Info Net patient revenue — what the home actually collects for resident care, after contractual allowances, bad debt and discounts are subtracted from its gross charges (CMS cost report, Worksheet G-3). It covers resident care only; money the home earns from other sources is shown separately as "Other income."
$7.7M
Net patient income Info Net patient income: net patient revenue minus the home's total operating expenses. A positive figure means it earns more from resident care than it spends to deliver it; a negative figure means the opposite. It excludes non-operating "other income."
-$1.3M
Privately-owned community Operated by a single business entity.
Net patient revenue Info Net patient revenue — what the home actually collects for resident care, after contractual allowances, bad debt and discounts are subtracted from its gross charges (CMS cost report, Worksheet G-3). It covers resident care only; money the home earns from other sources is shown separately as "Other income."
$7.7M Rank #228 / 257Revenue — State benchmarkedThis home is ranked 228th out of 257 homes in Florida. Shows this facility's annual revenue compared to the Florida average. Higher revenue generally means more resources for staffing and capital — read alongside Payroll %.Ranking totals vary by category as each rank only includes facilities that report data for that metric. Homes missing that data point aren't included in the ranking.Click the rank badge to see the full State ranking.Click here to see the full State ranking.
Net patient income Info Net patient income: net patient revenue minus the home's total operating expenses. A positive figure means it earns more from resident care than it spends to deliver it; a negative figure means the opposite. It excludes non-operating "other income."
-$1.3M
Other income Info Money the home earns outside of resident care — such as investments, grants, rentals and other non-operating sources (CMS cost report, Worksheet G-3). It is tracked separately from net patient revenue: it is not part of that figure, and it is not included in net patient income.
$447
Payroll costs Info Staff salaries plus wage-related costs — benefits such as payroll taxes, health insurance and retirement — from the home's own accounting records (CMS cost report, Worksheet A). Contract or agency labor is counted separately, under other operating costs. Rank #225 / 257Payroll — State benchmarkedThis home is ranked 225th out of 257 homes in Florida. Shows total annual staff payroll benchmarked to the Florida average. Higher payroll investment relative to peers often signals better staffing and less reliance on cheaper contract labor.Ranking totals vary by category as each rank only includes facilities that report data for that metric. Homes missing that data point aren't included in the ranking.Click the rank badge to see the full State ranking.Click here to see the full State ranking.
$4.0M 51.5% of net patient revenue Info Payroll as a share of revenue: staff salaries and wage-related benefits divided by net patient revenue. A higher figure means more of each revenue dollar goes to staff pay. Rank #106 / 257Payroll % — State benchmarkedThis home is ranked 106th out of 257 homes in Florida. Shows payroll as a percentage of revenue versus the Florida average. Well-run Florida facilities typically land around 49–56% — the top third Statewide. Below 25% may signal understaffing or heavy agency use — read with Staffing ratings.Ranking totals vary by category as each rank only includes facilities that report data for that metric. Homes missing that data point aren't included in the ranking.Click the rank badge to see the full State ranking.Click here to see the full State ranking.
Other operating costs Info Everything it costs to run the home apart from payroll — food, utilities, supplies, maintenance, contract labor and administration. Calculated as total operating expense minus payroll (staff salaries and wage-related benefits).
$5.1M
Total costs Info The home's total operating expense for the year — all the costs of running it, salaries included (CMS cost report, Worksheet G-3).
$9.0M

What does this home offer?

Pets allowed icon
Pets allowed icon

Pets Allowed

Room sizes icon
Room sizes icon

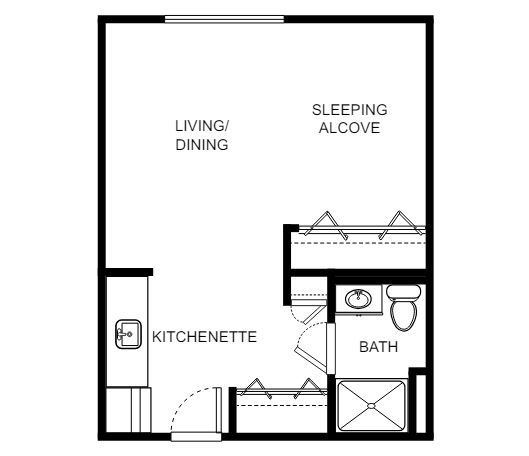
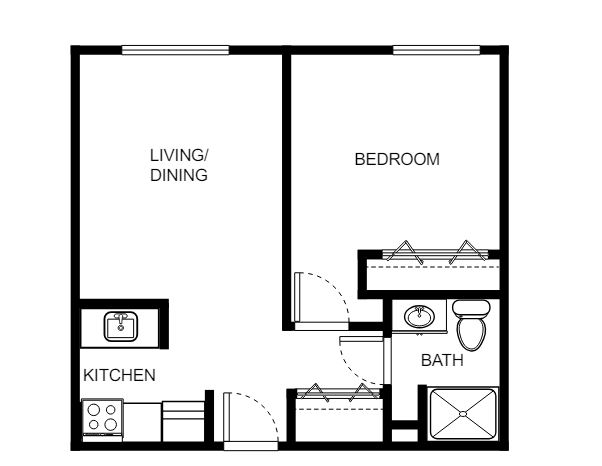
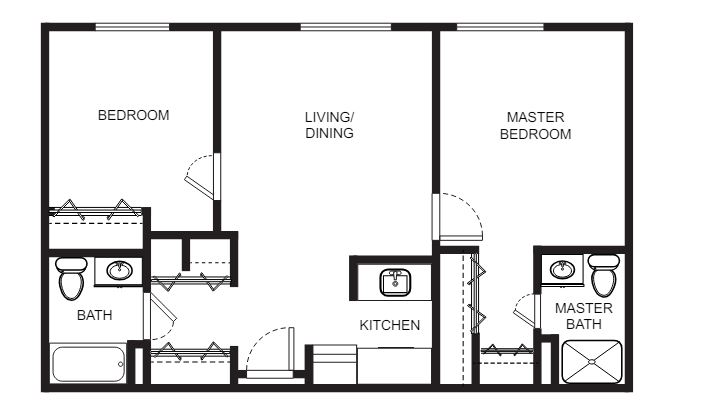
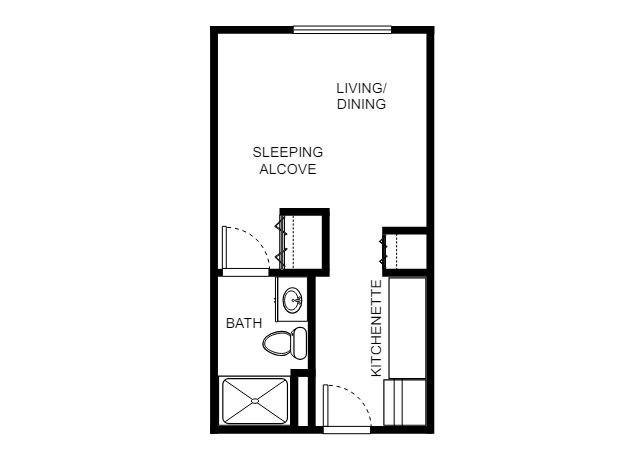
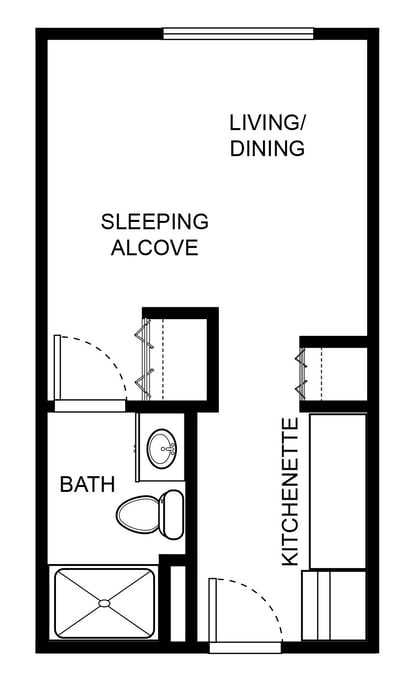
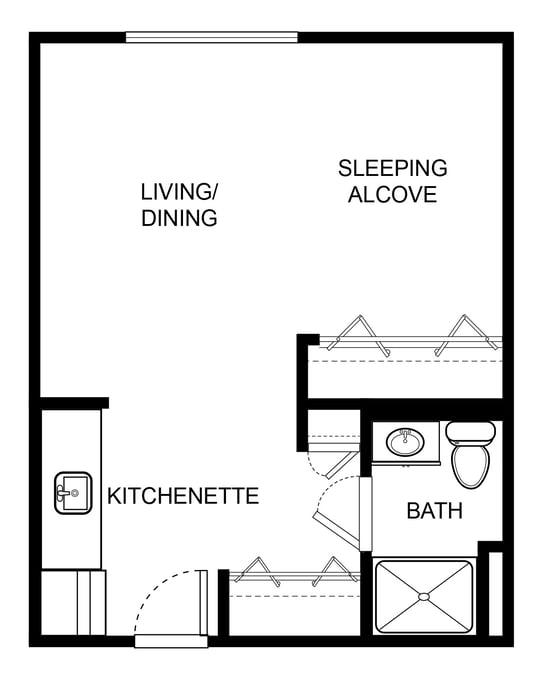
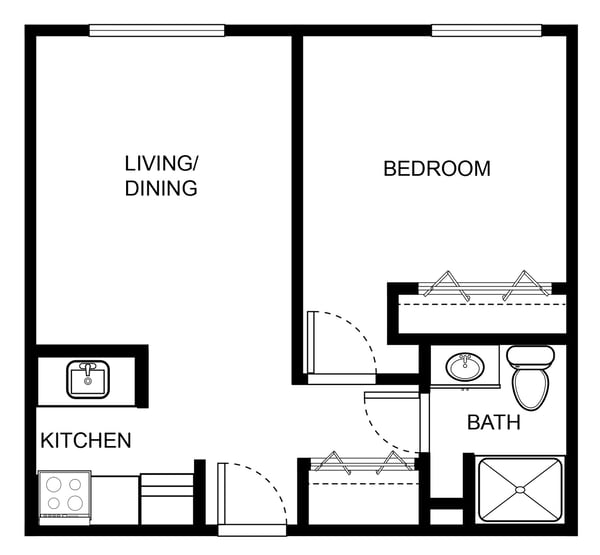
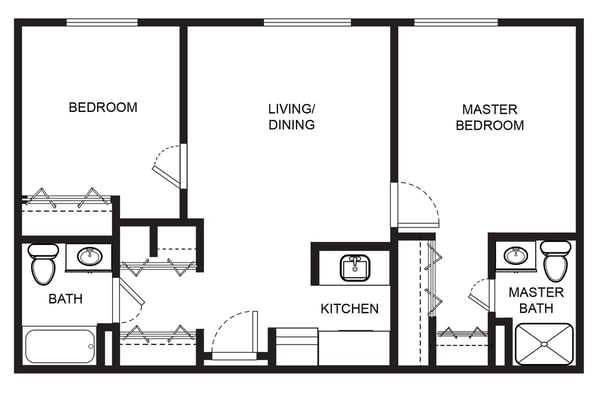
Room Sizes: 260 / 385 / 440 - 532 / 796 - 848 sq. ft

Housing options icon

Housing Options: Studio / Alcove / 1 Bed / 2 Bed

Building type icon
Building type icon

Building Type: Mid-rise

Transportation services icon

Transportation Services

Fitness and recreation icon

Fitness and Recreation

Who this home usually serves

TYPE OF STAY

Mostly long-term care residents

Most residents stay for extended periods and receive ongoing daily care.

New residents most often arrive under Medicaid (41% of admissions), and a typical Medicaid stay runs around 30 days.

Admissions
629 total

Coverage residents most often arrive under.

Medicare 34%
Private pay 26%
Medicaid 41%
Discharges
606 total

Coverage residents most often leave under.

Medicare 39%
Private pay 21%
Medicaid 40%

Activities in this home

Living Spaces & Floor Plans for Ormond In The Pines

Holiday Ormond In The Pines Plan 2
Holiday Ormond In The Pines Plan 3
Holiday Ormond In The Pines Plan 4
Holiday Ormond In The Pines Plan 1
Maple Suite Floor Plan
Oak Suite Floor Plan
Pine One Bedroom Floor Plan
Sabal Two Bedroom Floor Plan

Ormond In The Pines Reviews

Bear Glassley
My wife and I have lived here for 2 years and 2 months. What we like is how easy it is to fit in. you find everyone is like family. Everything you want is within minutes of our location.What do you like most about living here? Answer: I WOULD SAY THE OPEN DOOR POLICY WITH STAFF TO ANSWER ALL QUESTIONS. Are there enough caregivers to handle the residents' needs, especially during emergencies? Answer: Yes Are the common areas pleasant and comfortable for socializing or relaxing? Answer: Yes How would you rate the quality and variety of the meals? (1-5) Answer: 4 Are special diets handled well? Answer: Yes Is the dining schedule flexible enough to meet your preferences? Answer: Yes How do you feel about the level of social interaction available with other residents? Answer: EXCELLENT How was the units offered in this community? Answer: EXCELLENT WALK-THRU, ALL QUESTIONS WERE ANSWERED WITHOUT HESITATION. Do you feel safe living in this community? Answer: Yes How well do you think the community handles emergencies or unexpected events? Answer: OK Are there any hidden fees or unexpected charges? Answer: NONE Would you recommend this community to others looking for senior living options? Answer: YES AND WE HAVE. Is there anything you wish you knew before moving in? Answer: NONE

Places of interest near Ormond In The Pines

Address 2.5 miles from city center Info Estimated distance in miles from Ormond Beach's city center to Ormond In The Pines's address, calculated via Google Maps. — 0.54 miles to nearest hospital (Millennium Research)

Calculate Travel Distance to Ormond In The Pines

Add your location

Address

Compare Assisted Living around Palm Beach County

The information below is reported by the Florida Agency for Health Care Administration (AHCA).

Ormond In The Pines
AL
NH
IL
Ormond Beach -
95
Facility 95
FL AVG 89
Rank #504 / 1074
-
41
Facility 41
FL AVG 40
Rank #702 / 1486
Studio / Alcove / 1 Bed / 2 Bed
The Pointe at West Palm
AL
NH
IL
RC
West Palm Beach -
102
Facility 102
FL AVG 89
Rank #428 / 1074
A+
37
Facility 37
FL AVG 40
Rank #787 / 1486
Suite / 1 Bed / 2 Bed

Financial Assistance for
Assisted Living in Florida

Ormond In The Pines is located in Ormond Beach, Florida.
Here are the financial assistance programs available to residents in Florida.

Get Financial aid guidance

Long-Term Care Waiver

Florida Medicaid LTC Waiver

Age 65+ or 21+ disabled
General Florida resident, Medicaid- eligible, nursing home-level care need.
Income Limits (2025) ~$2,829/month 300% FBR, individual
Asset Limits $2,000 (individual), $3,000 (couple).
FL

High demand; waitlists common.

Benefits
In-home care (6-8 hours/day) Assisted living Respite (240 hours/year) Case management

Community Care for the Elderly (CCE)

Florida CCE

Age 60+
General Florida resident, at risk of nursing home.
Income Limits ~$2,000/month varies
Asset Limits $5,000 individual
FL

Limited funding; regional variation.

Benefits
Homemaker services (3-5 hours/week) Adult day care (~$60/day) Respite (up to 10 days/year)

Home Care for the Elderly (HCE)

Florida Home Care for the Elderly

Age 60+
General Florida resident, at risk of nursing home placement; caregiver must be approved.
Income Limits (2025) ~$2,829/month individual, aligned with Medicaid thresholds
Asset Limits ~$2,000 (individual); varies by case manager discretion.
FL

Limited funding (~3,500 served annually); prioritizes low-income frail seniors.

Benefits
Basic subsidy (~$160/month) for housing/medical costs; special subsidies for supplies/services (e.g., incontinence supplies, ~$50-$200/month)

Program of All-Inclusive Care for the Elderly (PACE)

Florida Medicaid PACE

Age 55+
General Florida resident, nursing home-level care need, safe with PACE support.
Income Limits (2025) ~$2,829/month 300% FBR
Asset Limits $2,000 (individual), $3,000 (couple).
FL

Limited to specific counties (e.g., Hillsborough, Miami-Dade); ~10 sites statewide.

Benefits
Personal care (5-7 hours/day) Medical care Meals Transportation Therapy

Optional State Supplementation (OSS)

Florida Optional State Supplementation

Age 65+ or disabled
General Florida resident, living in approved facility, receiving SSI or low-income.
Income Limits (2025) ~$1,004/month individual, including SSI
Asset Limits $2,000 (individual), $3,000 (couple).
FL

Limited to specific facility types; ~$78.40/month max supplement.

Benefits
Cash payment (~$78.40/month) for room/board or personal needs in facilities

Frequently Asked Questions about Ormond In The Pines

What languages are spoken at Ormond In The Pines?

The team at Ormond In The Pines speaks English.

Who is the owner of Ormond In The Pines?

The legal owner and operator of Ormond In The Pines is 101 Clyde Morris Boulevard Opco Llc.

Is Ormond In The Pines in a walkable area?

Ormond In The Pines has a walk score of 41. Somewhat walkable. A few nearby services may be reachable on foot, but most trips require transportation.

What is the license number of Ormond In The Pines?

According to FL state health department records, Ormond In The Pines's license number is 5535.

When does Ormond In The Pines's license expire?

According to FL state health department records, Ormond In The Pines's license expires on November 30, 2026.

What is the occupancy rate at Ormond In The Pines?

Ormond In The Pines's occupancy is 86%.

Does Ormond In The Pines have different floorplan options?

Yes — see the floorplan options available at Ormond In The Pines on this page.

Guides for Better Senior Living

Care Cost Calculator: See Prices in Your Area

Nursing Home Data Explorer

Don’t Wait Too Long: 7 Red Flag Signs Your Parent Needs Assisted Living Now

The True Cost of Assisted Living in 2025 – And How Families Are Paying For It

Understanding Senior Living Costs: Pricing Models, Discounts & Financial Assistance