


Total staff
243
Employees
234
Contractors
9
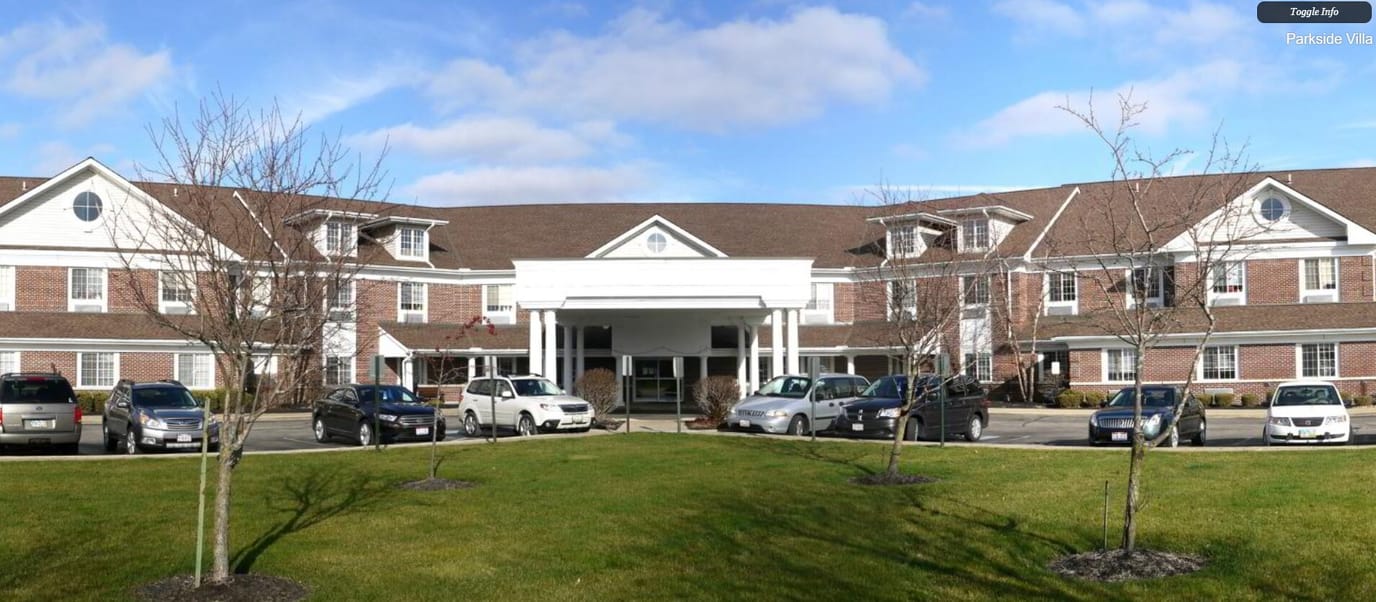
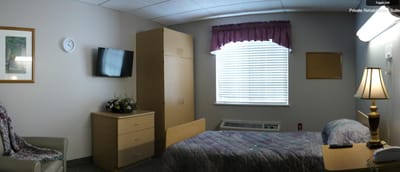
Offering skilled nursing and rehabilitation, Parkside Villa is a nursing home in Middleburg Heights, Ohio, with a 178-bed capacity. The community has a two-story setting, ensuring older adults’ comfort and safety. Hospice care and respite care are also provided, supported by 24-hour coverage and therapy services. The care team also consists of a registered nurse, nurse aides, LPNs, CNAs, and a physical therapist, overseeing residents’ care based on their needs.
The average length of stay in the community is 76 days, and it is currently at 85.9% occupancy. Its surrounding area is also slightly walkable, with a Walk Score of 44, requiring transportation for most errands. Parkside Villa also accepts Medicare, Medicaid, and private pay, offering a variety of payment options.
| Staff type | Hours / Day / Resident | vs state avg |
|---|---|---|
|
Registered Nurse (RN)
| 48m per day | ▲ 25% State avg: 38m per day · National avg: 41m per day |
|
LPN / LVN
| 55m per day | ▼ 5% State avg: 58m per day · National avg: 52m per day |
|
Nurse Aide
| 1h 58m per day | ▼ 7% State avg: 2h 7m per day · National avg: 2h 20m per day |
|
Weekend Total Nursing
| 3h 18m per day | ■ Avg State avg: 3h 20m per day · National avg: 3h 27m per day |
|
Physical Therapist
| 3m per day | ■ Avg State avg: 3m per day · National avg: 4m per day |
|
Weekend RN
| 35m per day | ▲ 37% State avg: 25m per day · National avg: 29m per day |
Reporting period: October 1 – December 31, 2025 (Q4 2025). Source: CMS Payroll-Based Journal report.
Manages medical care and health needs.
Assists with medical care and medications.
Helps with daily care and mobility.
Total hours from contractors
1,169 contractor hours this quarter
| Certified Nursing Assistant | 102 | 0 | 102 | 27,518 | 92 | 100% | 7.9 |
| Licensed Practical Nurse | 42 | 0 | 42 | 12,520 | 92 | 100% | 7.8 |
| Registered Nurse | 25 | 4 | 29 | 8,732 | 92 | 100% | 7.7 |
| Clinical Nurse Specialist | 5 | 5 | 10 | 2,157 | 92 | 100% | 6.5 |
| Qualified Activities Professional | 8 | 0 | 8 | 2,138 | 92 | 100% | 9 |
| Other Dietary Services Staff | 4 | 0 | 4 | 1,950 | 92 | 100% | 8.2 |
| Speech Language Pathologist | 9 | 0 | 9 | 1,809 | 80 | 87% | 6.7 |
| Physical Therapy Assistant | 6 | 0 | 6 | 1,761 | 73 | 79% | 7.2 |
| Mental Health Service Worker | 4 | 0 | 4 | 1,371 | 68 | 74% | 8.1 |
| Physical Therapy Aide | 7 | 0 | 7 | 1,318 | 83 | 90% | 6.1 |
| Occupational Therapy Aide | 3 | 0 | 3 | 804 | 71 | 77% | 8.6 |
| Respiratory Therapy Technician | 5 | 0 | 5 | 770 | 77 | 84% | 5.8 |
| Qualified Social Worker | 4 | 0 | 4 | 637 | 65 | 71% | 5.2 |
| RN Director of Nursing | 2 | 0 | 2 | 519 | 60 | 65% | 7.7 |
| Administrator | 1 | 0 | 1 | 512 | 64 | 70% | 8 |
| Nurse Practitioner | 1 | 0 | 1 | 512 | 64 | 70% | 8 |
| Dietitian | 1 | 0 | 1 | 512 | 64 | 70% | 8 |
| Nurse Aide in Training | 2 | 0 | 2 | 387 | 35 | 38% | 10.7 |
| Dental Services Staff | 1 | 0 | 1 | 340 | 46 | 50% | 7.4 |
| Medication Aide/Technician | 2 | 0 | 2 | 229 | 30 | 33% | 7.6 |
Federal penalties imposed by CMS for regulatory violations, including civil money penalties (fines) and denials of payment for new Medicare/Medicaid admissions.
Source: CMS Penalties Database
No penalties in the past 3 years
No civil money penalties or payment denials were reported in the last 3 years.
These measures show how residents usually do over time at this home, based on health outcomes and preventive care.
Ohio average: 5.8
Ohio average: 12.7
Ohio average: 6.8%
Ohio average: 8.9%
Ohio average: 22.0%
Ohio average: 3.4%
Ohio average: 3.9%
Ohio average: 0.5%
Ohio average: 6.2%
Ohio average: 24.0%
Ohio average: 8.4%
Ohio average: 92.4%
Ohio average: 94.5%
Ohio average: 78.0%
Ohio average: 1.3%
Ohio average: 75.6%
Quality measures are calculated from Minimum Data Set (MDS) assessments. For most measures, lower percentages indicate better care quality.
46% of new residents, usually for short-term rehab.
46% of new residents, often for short stays.
8% of new residents, often for long-term daily care.
Source: CMS Long-Term Care Facility Characteristics (Data as of Jan 2026)
Residents meet regularly to discuss policies, care quality, and activities
State-approved Nurse Aide Training and Competency Evaluation Program on-site
Organized group of residents that meets regularly to discuss facility policies, quality of life, and activities.
Data sourced from CMS Long-Term Care Facility Characteristics quarterly report. Payer mix reflects the current resident census by primary payment source.
Historical financial and operational data for Parkside Villa from 2011–2023, based on CMS SNF Cost Reports.
Key figures below are for fiscal year ending in 12/2023.
Based on CMS SNF Cost Report for fiscal year ending in 12/2023.
Building Type: 2-story
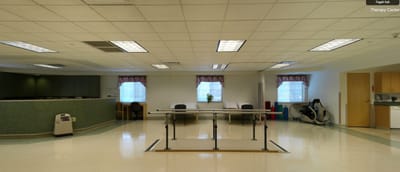
Rehabilitative Support

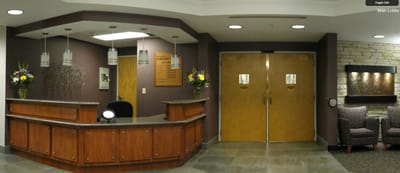
On-site Medical Care and Health Services
This home supports both short-term rehab and long-term care, with residents staying for a wide range of durations.
New residents most often arrive under Medicare (46% of admissions), and a typical Medicare stay runs around 24 days.
Coverage residents most often arrive under.
Coverage residents most often leave under.
![]() 7040 Hepburn Rd, Middleburg Heights, OH 44130
7040 Hepburn Rd, Middleburg Heights, OH 44130
Add your location
The information below is reported by the Ohio Department of Health, Bureau of Survey and Certification.
| Parkside Villa | NH | Middleburg Heights (North Ontario) | 178
Facility
178
OH AVG
76
Rank
#3 / 315 |
87.3%
Facility
87.3%
OH AVG
81.9
Rank
#66 / 145 | +7% | 3.10
Facility
3.10
OH AVG
3.54
Rank
#156 / 199 | +29% | -12% | $0
Facility
$0
OH AVG
$74.0k
Rank
#1 / 200 | 25
Facility
25
OH AVG
30.9
Rank
#89 / 199 | 3.6
Facility
3.6
OH AVG
4.6
Rank
#69 / 199 | - | 155 | - |
44
Facility
44
OH AVG
40
Rank
#322 / 704 | - | $23.5MFiscal year ending 12/2023
Facility
$23.5MFiscal year ending 12/2023
OH AVG
$10.1M
Rank
#6 / 199 | $11.6MFiscal year ending 12/2023
Facility
$11.6MFiscal year ending 12/2023
OH AVG
$3.9M
Rank
#9 / 199 | 49.4%Fiscal year ending 12/2023
Facility
49.4%Fiscal year ending 12/2023
OH AVG
40.2%
Rank
#185 / 199 | 366229 | ||||
| Falling Water Healthcare Center | NH HOS MC RC | Strongsville (Orange) | 135
Facility
135
OH AVG
76
Rank
#27 / 315 |
71.9%
Facility
71.9%
OH AVG
81.9
Rank
#119 / 145 | -12% | 3.28
Facility
3.28
OH AVG
3.54
Rank
#122 / 199 | -24% | -7% | $10.8k
Facility
$10.8k
OH AVG
$74.0k
Rank
#147 / 200 | 19
Facility
19
OH AVG
30.9
Rank
#56 / 199 | 2.4
Facility
2.4
OH AVG
4.6
Rank
#21 / 199 | 2 | 97 | - |
22
Facility
22
OH AVG
40
Rank
#525 / 704 | Collena Rhodes | $9.3MFiscal year ending 03/2024
Facility
$9.3MFiscal year ending 03/2024
OH AVG
$10.1M
Rank
#83 / 199 | $4.8MFiscal year ending 03/2024
Facility
$4.8MFiscal year ending 03/2024
OH AVG
$3.9M
Rank
#97 / 199 | 51%Fiscal year ending 03/2024
Facility
51%Fiscal year ending 03/2024
OH AVG
40.2%
Rank
#153 / 199 | 366111 | ||||
| Avenue at Strongsville Care and Rehabilitation Center | NH AL HOS PC RC SNF | Strongsville (West Orange Avenue) | 99
Facility
99
OH AVG
76
Rank
#73 / 315 |
90.2%
Facility
90.2%
OH AVG
81.9
Rank
#46 / 145 | +10% | 2.88
Facility
2.88
OH AVG
3.54
Rank
#180 / 199 | +90% | -19% | $27.3k
Facility
$27.3k
OH AVG
$74.0k
Rank
#164 / 200 | 22
Facility
22
OH AVG
30.9
Rank
#74 / 199 | 2.4
Facility
2.4
OH AVG
4.6
Rank
#21 / 199 | 2 | 89 | - |
75
Facility
75
OH AVG
40
Rank
#47 / 704 | Strongsville Fk Healthcare Holdings LLC | $9.8MFiscal year ending 12/2023
Facility
$9.8MFiscal year ending 12/2023
OH AVG
$10.1M
Rank
#107 / 199 | $4.3MFiscal year ending 12/2023
Facility
$4.3MFiscal year ending 12/2023
OH AVG
$3.9M
Rank
#80 / 199 | 44.1%Fiscal year ending 12/2023
Facility
44.1%Fiscal year ending 12/2023
OH AVG
40.2%
Rank
#51 / 199 | 366491 |
Parkside Villa is located in Middleburg Heights, Ohio.
Here are the financial assistance programs available to residents in Ohio.
Parkside Villa is in the North Ontario neighborhood.
Parkside Villa has a walk score of 44. Somewhat walkable. A few nearby services may be reachable on foot, but most trips require transportation.
Parkside Villa's occupancy is 85.9%.
Parkside Villa is registered as a for-profit.
Yes — there are 7 photos of Parkside Villa in the photo gallery on this page.
Parkside Villa is located at 7040 Hepburn Rd, Middleburg Heights, OH 44130.
(440) 260-7626 will put you in contact with the team at Parkside Villa.
Care Cost Calculator: See Prices in Your Area
Nursing Home Data Explorer
Don’t Wait Too Long: 7 Red Flag Signs Your Parent Needs Assisted Living Now
The True Cost of Assisted Living in 2025 – And How Families Are Paying For It
Understanding Senior Living Costs: Pricing Models, Discounts & Financial Assistance


