


Total health inspections
12
Illinois average 10.4
Last Health inspection on Mar 2025
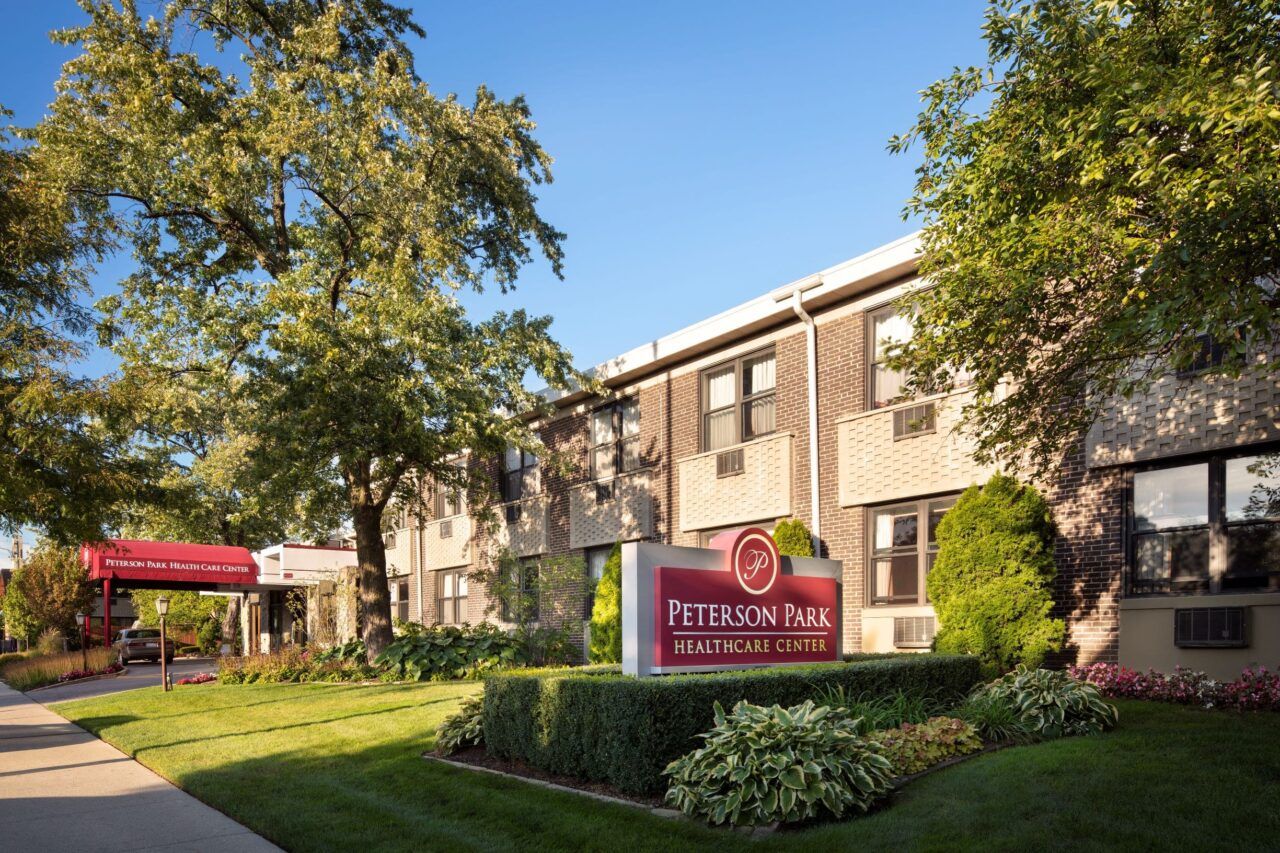


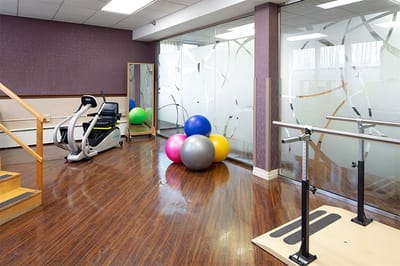

Peterson Park Health Care Center is a senior living home that prides itself on offering premier services and novel methods of clinical care. The healthcare professionals at the center are highly experienced and skilled in providing personalized care to each individual resident. The center offers 24-hour security and skilled nursing care, as well as social services and personal assistance with daily needs. They are also equipped to provide tube feedings, wound care, and physical therapy, with nurses who are trained to manage and treat pressure ulcers and wounds. Their critical therapy program includes in-house ultrasound studies of vascular wounds and wound VAC services.
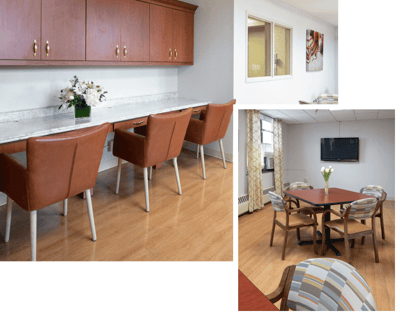
The home boasts stylish dining settings and values family, celebrations, intimate gatherings, and holidays or festivities that make the residents feel at home. The center features spacious rooms and tranquil common areas, making it an ideal place for seniors to recover while being well taken care of. Families can trust that their loved ones are in a home that genuinely cares for them and provides the best possible service for their recovery.
| Staff type | Hours / Day / Resident | vs state avg |
|---|---|---|
|
Registered Nurse (RN)
| 44m per day | ■ Avg State avg: 44m per day · National avg: 41m per day |
|
LPN / LVN
| 36m per day | ▼ 6% State avg: 38m per day · National avg: 52m per day |
|
Nurse Aide
| 2h 3m per day | ▼ 4% State avg: 2h 8m per day · National avg: 2h 21m per day |
|
Weekend Total Nursing
| 3h 18m per day | ▲ 7% State avg: 3h 5m per day · National avg: 3h 26m per day |
|
Physical Therapist
| 2m per day | ▼ 45% State avg: 3m per day · National avg: 4m per day |
|
Weekend RN
| 47m per day | ▲ 37% State avg: 34m per day · National avg: 29m per day |
Key information about the people who lead and staff this community.
In Illinois, the Department of Public Health, Office of Health Care Regulation conducts annual unannounced surveys to assess compliance with state and federal healthcare facility standards.
Deficiencies
| This Facility | IL Average | vs. IL Avg |
|---|---|---|---|
|
Total deficiencies
| 44 | 7 | This facility has 529% more total deficiencies than a typical Illinois nursing home (44 vs. IL avg 7).↑ 529% worse |
|
Deficiencies per inspection
| 4.0 | 0.8 | This facility has 400% more deficiencies per inspection than a typical Illinois nursing home (4 vs. IL avg 0.8).↑ 400% worse |
Inspections
| This Facility | IL Average | vs. IL Avg |
|---|---|---|---|
|
Total inspections
| 11 | 9 | This facility has had 22% more total inspections than the Illinois average (11 vs. IL avg 9). More inspections can mean more regulatory scrutiny rather than worse care.↑ 22% more |
Illinois average 10.4
Last Health inspection on Mar 2025
Illinois average 36.8
Illinois average 3.68
Health citations are formal notices following inspections when they fail to comply with safety and care standards.
26 of 46 citations resulted from standard inspections; 18 of 46 resulted from complaint investigations; and 2 of 46 came from combined inspections (standard and complaint).
Illinois average: 0.7
Illinois average: 3.6
Reporting period: October 1 – December 31, 2025 (Q4 2025). Source: CMS Payroll-Based Journal report.
Manages medical care and health needs.
Assists with medical care and medications.
Helps with daily care and mobility.
Total hours from contractors
12,775 contractor hours this quarter
| Certified Nursing Assistant | 72 | 182 | 254 | 32,434 | 92 | 100% | 7.5 |
| Licensed Practical Nurse | 20 | 15 | 35 | 8,903 | 92 | 100% | 8.7 |
| Registered Nurse | 20 | 26 | 46 | 7,356 | 92 | 100% | 8.3 |
| Clinical Nurse Specialist | 8 | 0 | 8 | 3,817 | 92 | 100% | 6.3 |
| Other Dietary Services Staff | 8 | 0 | 8 | 3,375 | 92 | 100% | 7.4 |
| Dental Services Staff | 3 | 0 | 3 | 1,366 | 91 | 99% | 5.6 |
| Dietitian | 2 | 0 | 2 | 958 | 90 | 98% | 5.6 |
| Administrator | 1 | 0 | 1 | 520 | 91 | 99% | 5.7 |
| Nurse Practitioner | 1 | 0 | 1 | 520 | 91 | 99% | 5.7 |
| Speech Language Pathologist | 0 | 3 | 3 | 516 | 64 | 70% | 7.6 |
| Qualified Social Worker | 0 | 3 | 3 | 514 | 65 | 71% | 7.7 |
| Mental Health Service Worker | 1 | 0 | 1 | 466 | 84 | 91% | 5.5 |
| RN Director of Nursing | 1 | 0 | 1 | 464 | 82 | 89% | 5.7 |
| Respiratory Therapy Technician | 0 | 1 | 1 | 435 | 61 | 66% | 7.1 |
| Physical Therapy Aide | 0 | 4 | 4 | 414 | 63 | 68% | 6.4 |
| Physical Therapy Assistant | 0 | 2 | 2 | 384 | 66 | 72% | 5.8 |
Includes penalties issued in 2023
Federal penalties imposed by CMS for regulatory violations, including civil money penalties (fines) and denials of payment for new Medicare/Medicaid admissions.
Source: CMS Penalties Database (Data as of Jan 2026)
Illinois average: $143K
Illinois average: 3.0
Illinois average: 1.1
Penalties are imposed by CMS for violations of federal nursing home regulations.
2 penalties in the past 3 years
Multiple penalties were reported in the last 3 years.
Last updated: Jan 2026
These measures show how residents usually do over time at this home, based on health outcomes and preventive care.
Illinois average: 9.7
Illinois average: 18.6
Illinois average: 15.5%
Illinois average: 18.4%
Illinois average: 21.6%
Illinois average: 3.4%
Illinois average: 5.3%
Illinois average: 1.8%
Illinois average: 6.5%
Illinois average: 48.1%
Illinois average: 20.2%
Illinois average: 89.2%
Illinois average: 91.6%
Illinois average: 68.3%
Illinois average: 2.3%
Illinois average: 63.0%
Illinois average: 26.2%
Illinois average: 14.0%
Illinois average: 0.8%
Illinois average: 53.7%
Illinois average: 50.6%
Quality measures are calculated from Minimum Data Set (MDS) assessments. For most measures, lower percentages indicate better care quality.
14% of new residents, usually for short-term rehab.
66% of new residents, often for short stays.
20% of new residents, often for long-term daily care.
Source: CMS Long-Term Care Facility Characteristics (Data as of Jan 2026)
Residents meet regularly to discuss policies, care quality, and activities
Organized group of residents that meets regularly to discuss facility policies, quality of life, and activities.
Data sourced from CMS Long-Term Care Facility Characteristics quarterly report. Payer mix reflects the current resident census by primary payment source.
Historical financial and operational data for Peterson Park Health Care Center from 2011–2023, based on CMS SNF Cost Reports.
Key figures below are for fiscal year ending in 12/2023.
Based on CMS SNF Cost Report for fiscal year ending in 12/2023.
Most residents stay long-term, while a smaller portion are admitted for short-term rehab.
Most new residents arrive under private pay (66% of admissions), and a typical private pay stay runs around 5 - 6 months.
Coverage residents most often arrive under.
Coverage residents most often leave under.
![]() 9.1 miles from city center
9.1 miles from city center
![]() Estimated distance in miles from Chicago's city center to Peterson Park Health Care Center's address, calculated via Google Maps.
— 4.38 miles to nearest hospital (Resurrection Medical Center - Emergency Fast Track)
Estimated distance in miles from Chicago's city center to Peterson Park Health Care Center's address, calculated via Google Maps.
— 4.38 miles to nearest hospital (Resurrection Medical Center - Emergency Fast Track)
Add your location
Info below is compiled from CMS reports & the IL Dept. of Public Health (IDPH), senior community websites & trusted data sources such as Walk Score & BBB.
Communities are listed from highest to lowest based on our ranking methodology.
| Mercy Circle Senior Living | NH AL IL MC SNF | Chicago (Mount Greenwood) | 43
Facility
43
IL AVG
85
Rank
#330 / 419 | - | - | 4.57
Facility
4.57
IL AVG
3.10
Rank
#24 / 155 | -8% | +47% | $0
Facility
$0
IL AVG
$151.3k
Rank
#1 / 155 | 16
Facility
16
IL AVG
36.8
Rank
#24 / 155 | 4.0
Facility
4.0
IL AVG
3.7
Rank
#105 / 155 | - | 22 | - |
44
Facility
44
IL AVG
51
Rank
#392 / 648 | Sisters Of Mercy Of The Americas West Midwest Community Inc | $10.3MFiscal year ending 06/2024
Facility
$10.3MFiscal year ending 06/2024
IL AVG
$12.2M
Rank
#95 / 154 | $5.1MFiscal year ending 06/2024
Facility
$5.1MFiscal year ending 06/2024
IL AVG
$4.8M
Rank
#112 / 154 | 49.8%Fiscal year ending 06/2024
Facility
49.8%Fiscal year ending 06/2024
IL AVG
44.3%
Rank
#105 / 154 | 146174 | ||||
| The Selfhelp Home Senior Living Community | NH AL IL RC SNF | Chicago (Uptown) | 72
Facility
72
IL AVG
85
Rank
#204 / 419 |
81.9%
Facility
81.9%
IL AVG
73
Rank
#63 / 157 | +12% | 5.56
Facility
5.56
IL AVG
3.10
Rank
#8 / 155 | +44% | +79% | $0
Facility
$0
IL AVG
$151.3k
Rank
#1 / 155 | 21
Facility
21
IL AVG
36.8
Rank
#41 / 155 | 5.3
Facility
5.3
IL AVG
3.7
Rank
#138 / 155 | 1 | 59 | A+ |
92
Facility
92
IL AVG
51
Rank
#28 / 648 | Marvin Rubin | $9.3MFiscal year ending 09/2023
Facility
$9.3MFiscal year ending 09/2023
IL AVG
$12.2M
Rank
#76 / 154 | $7.0MFiscal year ending 09/2023
Facility
$7.0MFiscal year ending 09/2023
IL AVG
$4.8M
Rank
#72 / 154 | 75.3%Fiscal year ending 09/2023
Facility
75.3%Fiscal year ending 09/2023
IL AVG
44.3%
Rank
#59 / 154 | 146009 | ||||
| The Clare | NH AL IL MC SNF | Chicago (Rush & Division) | 49
Facility
49
IL AVG
85
Rank
#294 / 419 |
92.2%
Facility
92.2%
IL AVG
73
Rank
#23 / 157 | +26% | 3.69
Facility
3.69
IL AVG
3.10
Rank
#48 / 155 | +61% | +19% | $0
Facility
$0
IL AVG
$151.3k
Rank
#1 / 155 | 13
Facility
13
IL AVG
36.8
Rank
#19 / 155 | 2.6
Facility
2.6
IL AVG
3.7
Rank
#25 / 155 | 1 | 45 | A+ |
100
Facility
100
IL AVG
51
Rank
#1 / 648 | County Of Fulton | $4.4MFiscal year ending 11/2023
Facility
$4.4MFiscal year ending 11/2023
IL AVG
$12.2M
Rank
#147 / 154 | $3.6MFiscal year ending 11/2023
Facility
$3.6MFiscal year ending 11/2023
IL AVG
$4.8M
Rank
#146 / 154 | 81.8%Fiscal year ending 11/2023
Facility
81.8%Fiscal year ending 11/2023
IL AVG
44.3%
Rank
#14 / 154 | 146151 | ||||
| Asbury Gardens | NH HOS MC PC SNF | North Aurora (Airport Road) | 75
Facility
75
IL AVG
85
Rank
#193 / 419 |
76.5%
Facility
76.5%
IL AVG
73
Rank
#78 / 157 | +5% | 4.00
Facility
4.00
IL AVG
3.10
Rank
#41 / 155 | +6% | +29% | $6.4k
Facility
$6.4k
IL AVG
$151.3k
Rank
#66 / 155 | 21
Facility
21
IL AVG
36.8
Rank
#41 / 155 | 3.5
Facility
3.5
IL AVG
3.7
Rank
#72 / 155 | - | 57 | A+ |
38
Facility
38
IL AVG
51
Rank
#434 / 648 | Abraham Diamond | $6.7MFiscal year ending 12/2023
Facility
$6.7MFiscal year ending 12/2023
IL AVG
$12.2M
Rank
#137 / 154 | $3.8MFiscal year ending 12/2023
Facility
$3.8MFiscal year ending 12/2023
IL AVG
$4.8M
Rank
#128 / 154 | 56.5%Fiscal year ending 12/2023
Facility
56.5%Fiscal year ending 12/2023
IL AVG
44.3%
Rank
#28 / 154 | 146170 | ||||
| Peterson Park Health Care Center | NH MC PC RC SNF | Chicago (North Park) | 196
Facility
196
IL AVG
85
Rank
#29 / 419 |
88.8%
Facility
88.8%
IL AVG
73
Rank
#34 / 157 | +22% | 2.58
Facility
2.58
IL AVG
3.10
Rank
#109 / 155 | -13% | -17% | $13.0k
Facility
$13.0k
IL AVG
$151.3k
Rank
#75 / 155 | 46
Facility
46
IL AVG
36.8
Rank
#112 / 155 | 3.8
Facility
3.8
IL AVG
3.7
Rank
#90 / 155 | 3 | 174 | - |
74
Facility
74
IL AVG
51
Rank
#135 / 648 | Ppa Ltd | $17.9MFiscal year ending 12/2023
Facility
$17.9MFiscal year ending 12/2023
IL AVG
$12.2M
Rank
#31 / 154 | $9.0MFiscal year ending 12/2023
Facility
$9.0MFiscal year ending 12/2023
IL AVG
$4.8M
Rank
#26 / 154 | 50.6%Fiscal year ending 12/2023
Facility
50.6%Fiscal year ending 12/2023
IL AVG
44.3%
Rank
#97 / 154 | 145838 |
Peterson Park Health Care Center is located in Chicago, Illinois.
Here are the financial assistance programs available to residents in Illinois.
Peterson Park Health Care Center is in the North Park neighborhood of Chicago.
Peterson Park Health Care Center has a walk score of 74. Very walkable. Most errands can be accomplished on foot, and many essentials are within a short walk.
Peterson Park Health Care Center's occupancy is 89.1%.
Peterson Park Health Care Center has been operating for approximately 45 years, based on available licensing and registration records.
No, Peterson Park Health Care Center has a no-pet policy.
Peterson Park Health Care Center is registered as a for-profit in IL.
Peterson Park Health Care Center has had 44 reported deficiencies since 2022 according to records from Illinois Department of Public Health (IDPH).
Care Cost Calculator: See Prices in Your Area
Nursing Home Data Explorer
Don’t Wait Too Long: 7 Red Flag Signs Your Parent Needs Assisted Living Now
The True Cost of Assisted Living in 2025 – And How Families Are Paying For It
Understanding Senior Living Costs: Pricing Models, Discounts & Financial Assistance


