Pinnacle Rehabilitation & Health Center
Nursing Home, Assisted Living, Hospice Care & Respite Care · Smyrna, DE
CMS overall rating Info CMS (the Centers for Medicare & Medicaid Services) is the federal agency that rates nursing home quality. Its Overall Rating runs from 1 to 5 stars, combining health inspections, staffing, and quality measures, with inspections weighted most heavily.

Pinnacle Rehabilitation & Health Center

Nursing Home, Assisted Living, Hospice Care & Respite Care · Smyrna, DE
CMS overall rating Info CMS (the Centers for Medicare & Medicaid Services) is the federal agency that rates nursing home quality. Its Overall Rating runs from 1 to 5 stars, combining health inspections, staffing, and quality measures, with inspections weighted most heavily.
Calculator: See prices in your area
Pinnacle Rehabilitation & Health Center accepts Medicare, Medicaid, and private pay.

Overview of Pinnacle Rehabilitation & Health Center

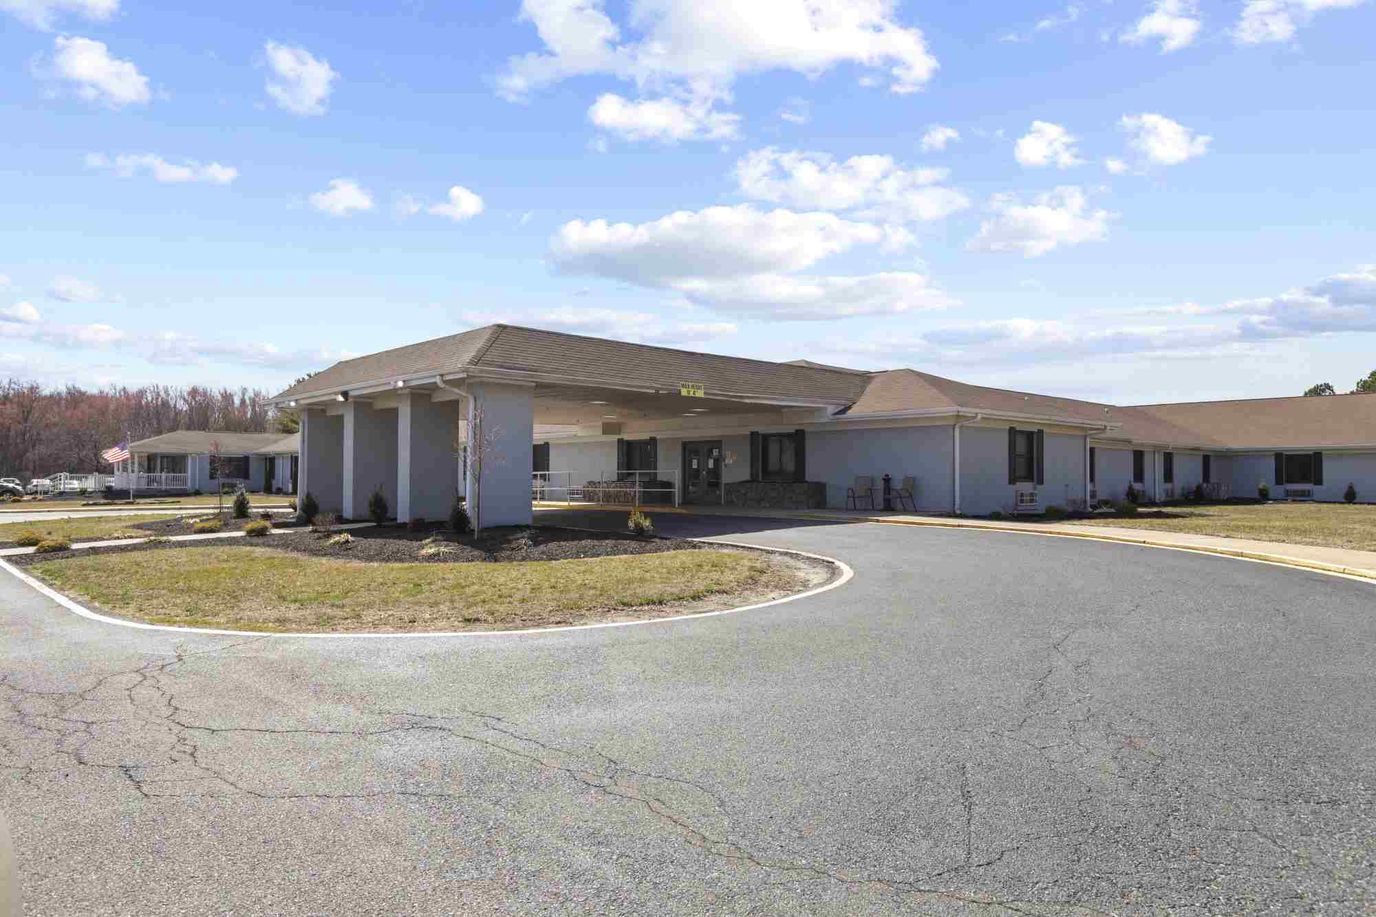
At 151 beds on South Dupont Boulevard, Pinnacle Rehabilitation & Health Center serves one of the broader care mandates you’ll find in Smyrna: nursing home and assisted living, yes, but also respite and hospice. The facility is running at 88.2% occupancy with 135 residents, which puts it in active, well-used territory rather than somewhere still finding its footing.

The average stay is about 90 days. That figure sits at the intersection of short-term rehab and longer-term care, reflecting the range of residents actually present: some here to recover and leave, some here to stay. Total nursing coverage comes to 4 hours and 3 minutes per resident per day. Residents have a structured seat at the table through an active resident council that meets regularly on care quality and facility policies.

Payment options cover Medicare, Medicaid, and private pay. For families managing a post-acute Medicare benefit or planning for Medicaid coverage over a longer stay, that range matters practically.

The neighborhood is car-dependent. Walk Score 24 means visiting family will drive, and most surrounding errands require a vehicle.

Pinnacle fits the profile of a facility carrying both a rehabilitation caseload and a longer-term resident population, with the payment flexibility to accommodate both. The staffing figures and breadth of care types suggest it’s built for range rather than specialization.

(302) 653-5085

Quality ratings

Measured by Centers for Medicare & Medicaid Services (CMS)

Overall rating Info The Overall CMS Rating combines results from health inspections, staffing levels and quality measures. Health inspections carry the most weight. Staffing and quality scores can increase or decrease the final rating based on performance compared to state and national standards.
▼ 8.5% Below DE avg. ▼ 8.5% Below DE avg.DE average: 3.3Click the badge to see the full State ranking.Click here to see the full State ranking.
Health Inspection Info Based on the results of the facility's three most recent standard inspections and any complaint investigations. CMS reviews the number, scope, and severity of deficiencies, with more recent findings weighted more heavily.
▼ 27.7% Below DE avg. ▼ 27.7% Below DE avg.DE average: 2.8Click the badge to see the full State ranking.Click here to see the full State ranking.
Staffing Info Measures average nursing staff hours per resident per day, including Registered Nurses (RNs) and total nursing staff. Ratings are adjusted based on the level of care residents require and are compared to state and national benchmarks.
▼ 50.3% Below DE avg. ▼ 50.3% Below DE avg.DE average: 4.0Click the badge to see the full State ranking.Click here to see the full State ranking.
Quality Measures Info Based on clinical and physical health indicators reported to CMS, such as hospital readmissions, falls, pressure ulcers, and improvements in mobility. These measures reflect how well residents' health needs are being managed.
▲ 23.6% Above DE avg. ▲ 23.6% Above DE avg.DE average: 4.0Click the badge to see the full State ranking.Click here to see the full State ranking.

Staffing hours breakdown

Info Daily nursing hours per resident by staff type, reported to CMS. Higher is generally better — compare this facility to state and national averages to see where staffing stands.

Hours per resident per day — compared to Delaware state averages

Total nursing care / resident Info This home is ranked 23rd out of 38 homes in Delaware for nurse hours. Total adjusted nursing hours per resident per day, combining RN, LPN, and aide time. CMS adjusts this for case-mix so facilities can be fairly compared.
4h 3m per day
Rank #23 / 38Nurse hours — State benchmarkedThis home is ranked 23rd out of 38 homes in Delaware. Shows adjusted nurse hours per resident per day benchmarked to the Delaware average, with a ranking across 38 Delaware facilities. More hours mean more direct care. The national average is about 3.5 hrs; below 3.0 is a red flag.Click the rank badge to see the full State ranking.Click here to see the full State ranking.
This facility Delaware avg (4h 39m per day)
vs Delaware avg
-13%

5 of 6 metrics below state avg

Staff typeHours / Day / Residentvs state avg
Registered Nurse (RN) Info RNs hold the highest nursing license and can assess residents, interpret test results, and direct care plans. More RN hours per day often signals stronger clinical oversight and faster response to health changes. 28m per day ▼ 54% State avg: 1h 0m per day · National avg: 41m per day
LPN / LVN Info Licensed Practical Nurses (LPNs) or Licensed Vocational Nurses (LVNs) deliver routine hands-on care — medication administration, wound dressing, and monitoring vital signs. They work under RN supervision and make up a large share of daily bedside care. 1h 1m per day ■ Avg State avg: 1h 2m per day · National avg: 52m per day
Nurse Aide Info Certified Nurse Aides (CNAs) provide the most direct day-to-day assistance: bathing, dressing, feeding, and mobility. Nurse aide hours are typically the largest staffing category and directly affect residents' quality of life. 2h 15m per day ▼ 10% State avg: 2h 29m per day · National avg: 2h 20m per day
Weekend Total Nursing Info Combined nursing hours (RN + LPN + Nurse Aide) per resident per day on weekends. Staffing often drops on weekends — this figure reveals whether the facility maintains adequate coverage outside of weekday hours. 3h 23m per day ▼ 20% State avg: 4h 14m per day · National avg: 3h 27m per day
Physical Therapist Info Hours per resident per day provided by licensed Physical Therapists (PTs) or PT Assistants. PT services help residents recover mobility after injury or illness and are especially important for post-acute (short-stay) rehabilitation. 4m per day ▼ 70% State avg: 12m per day · National avg: 4m per day
Weekend RN Info Registered nurse hours specifically on weekends. Facilities sometimes reduce RN presence on Saturdays and Sundays — a low weekend RN figure compared to weekday hours can indicate reduced clinical oversight when most administrative staff are absent. 17m per day ▼ 59% State avg: 42m per day · National avg: 29m per day

Capacity and availability

This home usually has limited availability

Higher occupancy than the Delaware average: 80.7%
Occupancy rate
88.2% Rank #18 / 44Occupancy rate — State benchmarkedThis home is ranked 18th out of 44 homes in Delaware. Shows this facility's occupancy rate versus the Delaware average, with its Statewide rank out of 44. Higher occupancy signals strong local demand and financial stability.Click the rank badge to see the full State ranking.Click here to see the full State ranking.
Avg. Length of Stay
90 days
Walk Score
Walk Score: 24 / 100 Rank #78 / 110Walk Score — State benchmarkedThis home is ranked 78th out of 110 homes in Delaware. Shows how walkable this facility's neighborhood is compared to the average Walk Score across Delaware facilities. Higher scores benefit residents, families, and staff.Click the rank badge to see the full State ranking.Click here to see the full State ranking.
Car-dependent. Most errands require a car, with limited nearby walkable options.

Contact Pinnacle Rehabilitation & Health Center

Staffing Data

Reporting period: October 1 – December 31, 2025 (Q4 2025). Source: CMS Payroll-Based Journal report.

Total staff 198
Employees 178
Contractors 20
Staff to resident ratio 1.47 : 1
10% fewer staff per resident than Delaware average
Delaware average ratio: 1.63 : 1 Delaware average ratio: 1.63 : 1See full Delaware ranking
Avg staff/day 75
Average shift 7.5 hours
0% compared with Delaware average
Delaware average: 7.6 hours Delaware average shift: 7.6 hoursSee full Delaware ranking
Total staff hours (quarter) 51,923

Nursing staff breakdown

Q4 2025 · Oct 1 – Dec 31 More info This data comes from the CMS Payroll-Based Journal report covering October 1 – December 31, 2025.
Registered Nurse

Manages medical care and health needs.

RN Staff Info All 9 RN Staff are full-time employees. No contractors work on this role. 9
Average shift length Info Average shift length. Calculated as total hours divided by days worked and average staff per day. 8.1 hours
Licensed Practical Nurse

Assists with medical care and medications.

LPN Staff Info All 32 LPN Staff are full-time employees. No contractors work on this role. 32
Average shift length Info Average shift length. Calculated as total hours divided by days worked and average staff per day. 8.3 hours
Certified Nursing Assistant

Helps with daily care and mobility.

CNA Staff Info All 107 CNA Staff are full-time employees. No contractors work on this role. 107
Average shift length Info Average shift length. Calculated as total hours divided by days worked and average staff per day. 7.4 hours

Contractor staffing

Q4 2025 · Oct 1 – Dec 31 More info This data comes from the CMS Payroll-Based Journal report covering October 1 – December 31, 2025.

Total hours from contractors

8.7%

4,538 contractor hours this quarter

Qualified Social Worker: 6 Respiratory Therapy Technician: 4 Speech Language Pathologist: 4 Physical Therapy Aide: 3 Physical Therapy Assistant: 3

Staff by category

Q4 2025 · Oct 1 – Dec 31 More info This data comes from the CMS Payroll-Based Journal report covering October 1 – December 31, 2025.
Certified Nursing Assistant107010726,98992100%7.4
Licensed Practical Nurse3203210,22292100%8.3
Clinical Nurse Specialist160163,65892100%6.9
RN Director of Nursing5051,9657582%8
Registered Nurse9091,4308896%8.1
Physical Therapy Aide0331,3407076%7.4
Speech Language Pathologist0441,0207076%7.7
Physical Therapy Assistant0339686874%8
Other Dietary Services Staff3038428693%7.3
Respiratory Therapy Technician0447077076%7.8
Qualified Social Worker0665035964%7.9
Administrator1014616065%7.7
Mental Health Service Worker1014605964%7.8
Dietitian1014576166%7.5
Dental Services Staff1014475863%7.7
Nurse Practitioner1014225459%7.8
Occupational Therapist1013244%8
107 Certified Nursing Assistant
% of Days 100%
32 Licensed Practical Nurse
% of Days 100%
16 Clinical Nurse Specialist
% of Days 100%
5 RN Director of Nursing
% of Days 82%
9 Registered Nurse
% of Days 96%
3 Physical Therapy Aide
% of Days 76%
4 Speech Language Pathologist
% of Days 76%
3 Physical Therapy Assistant
% of Days 74%
3 Other Dietary Services Staff
% of Days 93%
4 Respiratory Therapy Technician
% of Days 76%
6 Qualified Social Worker
% of Days 64%
1 Administrator
% of Days 65%
1 Mental Health Service Worker
% of Days 64%
1 Dietitian
% of Days 66%
1 Dental Services Staff
% of Days 63%
1 Nurse Practitioner
% of Days 59%
1 Occupational Therapist
% of Days 4%

Penalties and fines

Includes penalties issued in 2024-2025

Federal penalties imposed by CMS for regulatory violations, including civil money penalties (fines) and denials of payment for new Medicare/Medicaid admissions.

Source: CMS Penalties Database (Data as of Jan 2026)

Total fines amount $94K Rank #32 / 39Federal fines — State benchmarkedThis home is ranked 32nd out of 39 homes in Delaware. Shows this facility's cumulative CMS federal fine dollars versus the Delaware average among facilities with fines, and where it ranks among 39 facilities in the pool. Lower total dollars mean a better rank.Click the rank badge to see the full State ranking.Click here to see the full State ranking.
In line with Delaware average

Delaware average: $98K

Number of fines 2
7% more fines than Delaware average

Delaware average: 1.9

Payment Denials Info Serious action where Medicare and/or Medicaid temporarily stops payments for new residents until issues are fixed. 0
100% fewer payment denials than Delaware average

Delaware average: 0.2

Fines amount comparison
This facility $94K
Delaware average $98K
Penalty History

Penalties are imposed by CMS for violations of federal nursing home regulations.

2 penalties in the past 3 years

Multiple penalties were reported in the last 3 years.

Civil Money Penalty Info Fines imposed for noncompliance, which can be assessed per day or per instance of violation. Apr 17, 2025
$17K
Civil Money Penalty Info Fines imposed for noncompliance, which can be assessed per day or per instance of violation. May 30, 2024
$77K

Last updated: Jan 2026

Quality of care over time

These measures show how residents usually do over time at this home, based on health outcomes and preventive care.

High-risk clinical events score Info A composite score based on pressure ulcers, falls with injury, weight loss, walking ability decline, and activities of daily living decline. 8.5
12% better than Delaware average

Delaware average: 9.6

Functional decline score Info A composite score based on activities of daily living decline, walking ability decline, and incontinence. 18.8
In line with Delaware average

Delaware average: 19.0

Long-stay resident measures
Need for Help with Daily Activities Increased Info Percent of long-stay residents whose need for help with daily activities has increased 14.0%
9% better than Delaware average

Delaware average: 15.4%

Walking Ability Worsened Info Percent of long-stay residents whose ability to move independently worsened 16.4%
17% better than Delaware average

Delaware average: 19.8%

Low Risk Residents with Bowel/Bladder Incontinence Info Percent of low risk long-stay residents who lose control of their bowels or bladder 25.8%
17% worse than Delaware average

Delaware average: 22.1%

Falls with Major Injury Info Percent of long-stay residents experiencing one or more falls with major injury 3.1%
In line with Delaware average

Delaware average: 3.0%

High Risk Residents with Pressure Ulcers Info Percent of long-stay high risk residents with pressure ulcers 6.1%
38% worse than Delaware average

Delaware average: 4.4%

Urinary Tract Infection Info Percent of long-stay residents with a urinary tract infection 1.1%
48% better than Delaware average

Delaware average: 2.1%

Lost Too Much Weight Info Percent of long-stay residents who lose too much weight 2.7%
53% better than Delaware average

Delaware average: 5.8%

Depressive Symptoms Info Percent of long-stay residents who have depressive symptoms 3.8%
37% better than Delaware average

Delaware average: 6.0%

Antipsychotic Use Info Percent of long-stay residents who received an antipsychotic medication 20.4%
86% worse than Delaware average

Delaware average: 11.0%

Pneumococcal Vaccine Info Percent of long-stay residents assessed and appropriately given the pneumococcal vaccine 97.6%
In line with Delaware average

Delaware average: 95.3%

Influenza Vaccine Info Percent of long-stay residents assessed and appropriately given the seasonal influenza vaccine 97.6%
In line with Delaware average

Delaware average: 97.4%

Short-stay resident measures
Pneumococcal Vaccine Info Percent of short-stay residents assessed and appropriately given the pneumococcal vaccine 93.7%
14% better than Delaware average

Delaware average: 82.1%

Antipsychotic medication increase Info Percent of short-stay residents who newly received an antipsychotic medication 0.5%
41% better than Delaware average

Delaware average: 0.9%

Influenza Vaccine Info Percent of short-stay residents assessed and appropriately given the seasonal influenza vaccine 97.2%
17% better than Delaware average

Delaware average: 83.1%

Breakdown by payment type

Medicare

30% of new residents, usually for short-term rehab.

Typical stay 1 months

Private pay

47% of new residents, often for short stays.

Typical stay 23 days

Medicaid

23% of new residents, often for long-term daily care.

Typical stay 10 - 11 months

Facility Characteristics

Source: CMS Long-Term Care Facility Characteristics (Data as of Jan 2026)

Total residents 135
Private pay or other
135
100% of residents
Programs & Services
Residents Group

Residents meet regularly to discuss policies, care quality, and activities

Active Resident Council

Organized group of residents that meets regularly to discuss facility policies, quality of life, and activities.

Finances and operations

Based on the 2023 CMS SNF Cost Report.

Privately-owned community
Operated by a single business entity.
Home revenue
$30.6M
Operating loss
-$1.1M
Privately-owned community Operated by a single business entity.
Home revenue
$30.6M Rank #6 / 35Revenue — State benchmarkedThis home is ranked 6th out of 35 homes in Delaware. Shows this facility's annual revenue compared to the Delaware average. Higher revenue generally means more resources for staffing and capital — read alongside Payroll %.Click the rank badge to see the full State ranking.Click here to see the full State ranking.
Operating loss
-$1.1M
Payroll costs Info The portion of the home's budget spent on staff, including nurses, caregivers, and other employees who support care and operations. Rank #7 / 35Payroll — State benchmarkedThis home is ranked 7th out of 35 homes in Delaware. Shows total annual staff payroll benchmarked to the Delaware average. Higher payroll investment relative to peers often signals better staffing and less reliance on cheaper contract labor.Click the rank badge to see the full State ranking.Click here to see the full State ranking.
$10.2M
33.4% of revenue Rank #31 / 35Payroll % — State benchmarkedThis home is ranked 31st out of 35 homes in Delaware. Shows payroll as a percentage of revenue versus the Delaware average. Well-run Delaware facilities typically land around 52–60% — the top third Statewide. Below 25% may signal understaffing or heavy agency use — read with Staffing ratings.Click the rank badge to see the full State ranking.Click here to see the full State ranking.
Other operating costs Info All remaining costs needed to run the home, such as food, utilities, building maintenance, supplies and administrative expenses.
$21.5M
Total costs $31.7M

Who this home usually serves

TYPE OF STAY

Mix of rehab and long-term care

This home supports both short-term rehab and long-term care, with residents staying for a wide range of durations.

New residents most often arrive under private pay (47% of admissions), and a typical private pay stay runs around 23 days.

Admissions
533 total

Coverage residents most often arrive under.

Medicare 30%
Private pay 47%
Medicaid 23%
Discharges
542 total

Coverage residents most often leave under.

Medicare 22%
Private pay 43%
Medicaid 35%

Places of interest near Pinnacle Rehabilitation & Health Center

Address 3.0 miles from city center Info Estimated distance in miles from Smyrna's city center to Pinnacle Rehabilitation & Health Center's address, calculated via Google Maps. — 2.77 miles to nearest hospital (The Delaware Center for Maternal and Fetal Medicine of Christina Care, Inc.)

Calculate Travel Distance to Pinnacle Rehabilitation & Health Center

Add your location

Address

Financial Assistance for
Nursing Home in Delaware

Pinnacle Rehabilitation & Health Center is located in Smyrna, Delaware.
Here are the financial assistance programs available to residents in Delaware.

Get Financial aid guidance

Elderly and Disabled Waiver

Delaware Medicaid E&D Waiver

Age 65+ or disabled
General Delaware resident, Medicaid- eligible, nursing home-level care need.
Income Limits (2025) ~$2,829/month 300% FBR, individual
Asset Limits $2,000 (individual), $3,000 (couple).
DE

Small state, faster processing in some areas.

Benefits
Personal care (5-7 hours/day) Respite (240 hours/year) Adult day care (~$60/day) Home modifications

Delaware Caregiver Support Program

DE Caregiver Support (NFCSP)

Age Caregiver of someone 60+
General Delaware resident.
Income Limits No strict limit; prioritizes low-income.
Asset Limits Not applicable.
DE

Limited slots; rural focus.

Benefits
In-home respite (4-6 hours/day) Adult day care (~$60/day) Short-term facility care (up to 5 days)

Program of All-Inclusive Care for the Elderly (PACE)

Delaware Medicaid PACE

Age 55+
General Delaware resident, nursing home-level care need, safe with PACE support.
Income Limits (2025) ~$2,829/month 300% FBR
Asset Limits $2,000 (individual), $3,000 (couple).
DE

Limited to specific areas (e.g., New Castle County); few providers.

Benefits
Personal care (5-7 hours/day) Medical care Meals Transportation Therapy

Medicare Savings Program (MSP)

Delaware Medicare Savings Program

Age 65+ or disabled
General Delaware resident, enrolled in Medicare Part A/B.
Income Limits (2025) ~$2,510/month (QMB), ~$3,380/month (SLMB), ~$3,598/month (QI)—individual, adjusted annually.
Asset Limits $9,430 (individual), $14,130 (couple).
DE

Three tiers; broader limits than some states.

Benefits
Covers Medicare Part B premiums ($174.70/month) Deductibles ($240/year) Copays (~20% of services)

Compare Nursing Home around Smyrna

The information below is reported by the Delaware Department of Health and Social Services, Division of Health Care Quality.

2 facilities compared · CMS & DE Dept. of Health data

Pinnacle Rehabilitation & Health Center
NH

Nursing Home Licensed facility providing 24/7 skilled nursing care for residents with complex, ongoing medical needs. Staffed by RNs, LPNs, and CNAs. Inspected and star-rated annually by CMS. Accepts Medicare (short-term rehab) and Medicaid (long-term care).

AL

Assisted Living A licensed, long-term care setting for seniors or individuals with disabilities who need help with daily activities — like bathing, dressing, and medication management — but not 24-hour skilled nursing. Offers housing, meals, and around-the-clock support while aiming to maximize resident independence.

HC

Home Care Professional care delivered in the person's own home — from companionship and errands to skilled nursing and therapy. Allows seniors to age in place. Medicare covers skilled home health when medically necessary.

RC

Respite Care Short-term temporary care — days to weeks — to give family caregivers a break. Full care provided during the stay. Often used after hospitalization or to trial a facility before a permanent placement decision.

Smyrna (South Dupont Boulevard)
151
Facility 151
DE AVG 102
Rank #8 / 73
88.2%
Facility 88.2%
DE AVG 80.7%
Rank #18 / 44
+9%
4.05
Facility 4.05
DE AVG 4.66
Rank #23 / 38
-64%-13%
$94.2k
Facility $94.2k
DE AVG $96.1k
Rank #32 / 39
68
Facility 68
DE AVG 38.9
Rank #34 / 39
11.3
Facility 11.3
DE AVG 8.7
Rank #29 / 39
6130-
24
Facility 24
DE AVG 40
Rank #78 / 110
Efraim Rooz
$30.6M
Facility $30.6M
DE AVG $19.5M
Rank #6 / 35
$10.2M
Facility $10.2M
DE AVG $6.3M
Rank #7 / 35
33.4%
Facility 33.4%
DE AVG 35.2%
Rank #31 / 35
85020
Delaware Hospital for the Chronically Ill
NH

Nursing Home Licensed facility providing 24/7 skilled nursing care for residents with complex, ongoing medical needs. Staffed by RNs, LPNs, and CNAs. Inspected and star-rated annually by CMS. Accepts Medicare (short-term rehab) and Medicaid (long-term care).

AL

Assisted Living A licensed, long-term care setting for seniors or individuals with disabilities who need help with daily activities — like bathing, dressing, and medication management — but not 24-hour skilled nursing. Offers housing, meals, and around-the-clock support while aiming to maximize resident independence.

N

Nursing

Smyrna
205
Facility 205
DE AVG 102
Rank #1 / 73
37.1%
Facility 37.1%
DE AVG 80.7%
Rank #43 / 44
-54%
10.95
Facility 10.95
DE AVG 4.66
Rank #1 / 38
-+135%
$59.9k
Facility $59.9k
DE AVG $96.1k
Rank #19 / 39
11
Facility 11
DE AVG 38.9
Rank #3 / 39
3.7
Facility 3.7
DE AVG 8.7
Rank #3 / 39
274-
18
Facility 18
DE AVG 40
Rank #85 / 110
State Of Delaware---85035

Frequently Asked Questions about Pinnacle Rehabilitation & Health Center

What neighborhood is Pinnacle Rehabilitation & Health Center in?

Pinnacle Rehabilitation & Health Center is in the South Dupont Boulevard neighborhood.

Is Pinnacle Rehabilitation & Health Center in a walkable area?

Pinnacle Rehabilitation & Health Center has a walk score of 24. Car-dependent. Most errands require a car, with limited nearby walkable options.

What is the occupancy rate at Pinnacle Rehabilitation & Health Center?

Pinnacle Rehabilitation & Health Center's occupancy is 88.2%.

Are there photos of Pinnacle Rehabilitation & Health Center?

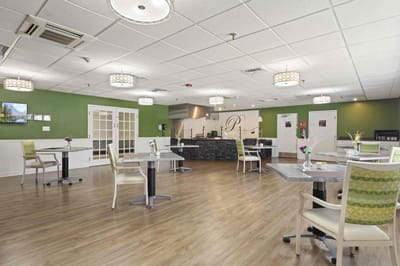
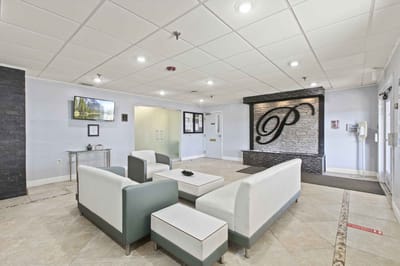
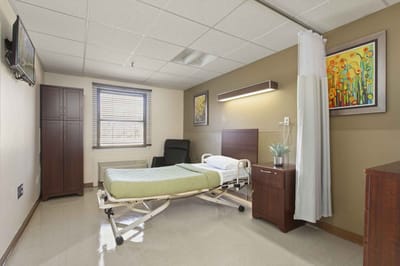
Yes — there are 5 photos of Pinnacle Rehabilitation & Health Center in the photo gallery on this page.

What is the phone number of Pinnacle Rehabilitation & Health Center?

(302) 653-5085 will put you in contact with the team at Pinnacle Rehabilitation & Health Center.

Is Pinnacle Rehabilitation & Health Center Medicare or Medicaid certified?

Yes — Pinnacle Rehabilitation & Health Center is a CMS-certified provider of Medicare and Medicaid.

Guides for Better Senior Living

Care Cost Calculator: See Prices in Your Area

Nursing Home Data Explorer

Don’t Wait Too Long: 7 Red Flag Signs Your Parent Needs Assisted Living Now

The True Cost of Assisted Living in 2025 – And How Families Are Paying For It

Understanding Senior Living Costs: Pricing Models, Discounts & Financial Assistance

Explore Open Rooms
1 Contact details
2 What type of senior care service are you looking for?
3 What budget do you have in mind for senior care?
4 How soon do you need to find care?
5 Additional details

Thank you for your interest!

Our team will be in touch shortly to help with next steps.