PLYMOUTH PLACE, INC. (Assisted Living)
Nursing Home · Illinois, IL
CMS overall rating Info The Overall CMS Rating is scored from 1 to 5 stars and combines results from health inspections, staffing levels, and quality measures. Health inspections carry the most weight. Staffing and quality scores can increase or decrease the final rating based on performance compared to state and national standards.

PLYMOUTH PLACE, INC. (Assisted Living)

Nursing Home · Illinois, IL
CMS overall rating Info The Overall CMS Rating is scored from 1 to 5 stars and combines results from health inspections, staffing levels, and quality measures. Health inspections carry the most weight. Staffing and quality scores can increase or decrease the final rating based on performance compared to state and national standards.
Calculator: See prices in your area
PLYMOUTH PLACE, INC. (Assisted Living) accepts Medicare and private pay.

Overview of Plymouth Place, Inc. (assisted Living)

Plymouth Place is a nonprofit retirement community in La Grange Park, offering a full continuum of compassionate senior care including independent living, assisted living, memory care, and skilled nursing. The community features a state-of-the-art wellness hub, exquisite dining options, and a variety of amenities designed to enhance the quality of life for its residents. Plymouth Place is committed to fostering independence and providing a welcoming environment for all residents.

Quality ratings

Measured by Centers for Medicare & Medicaid Services (CMS)

Overall rating Info The Overall CMS Rating combines results from health inspections, staffing levels and quality measures. Health inspections carry the most weight. Staffing and quality scores can increase or decrease the final rating based on performance compared to state and national standards.
▼ 36.5% Below IL avg. ▼ 36.5% Below IL avg.Click the badge to see the full State ranking.Click here to see the full State ranking.
Health Inspection Info Based on the results of the facility's three most recent standard inspections and any complaint investigations. CMS reviews the number, scope, and severity of deficiencies, with more recent findings weighted more heavily.
▼ 34.2% Below IL avg. ▼ 34.2% Below IL avg.Click the badge to see the full State ranking.Click here to see the full State ranking.
Staffing Info Measures average nursing staff hours per resident per day, including Registered Nurses (RNs) and total nursing staff. Ratings are adjusted based on the level of care residents require and are compared to state and national benchmarks.
▲ 20.1% Above IL avg. ▲ 20.1% Above IL avg.Click the badge to see the full State ranking.Click here to see the full State ranking.
Quality Measures Info Based on clinical and physical health indicators reported to CMS, such as hospital readmissions, falls, pressure ulcers, and improvements in mobility. These measures reflect how well residents' health needs are being managed.
▲ 25.4% Above IL avg. ▲ 25.4% Above IL avg.Click the badge to see the full State ranking.Click here to see the full State ranking.

Staffing hours breakdown

Info Daily nursing hours per resident by staff type, reported to CMS. Higher is generally better — compare this facility to state and national averages to see where staffing stands.

Hours per resident per day — compared to Illinois state averages

Total nursing care / resident Info This home is ranked 21st out of 167 homes in Illinois. Total adjusted nursing hours per resident per day, combining RN, LPN, and aide time. CMS adjusts this for case-mix so facilities can be fairly compared.
4h 40m per day
Rank #21 / 167Nurse hours — State benchmarkedThis home is ranked 21st out of 167 homes in Illinois. Shows adjusted nurse hours per resident per day benchmarked to the Illinois average, with a ranking across 167 Illinois SNFs. More hours mean more direct care. The national average is about 3.5 hrs; below 3.0 is a red flag.Click the rank badge to see the full State ranking.Click here to see the full State ranking.
This facility Illinois avg (3h 57m per day)
vs Illinois avg
+18%
Staff typeHours / Day / Residentvs state avg
Weekend Total Nursing Info Combined nursing hours (RN + LPN + Nurse Aide) per resident per day on weekends. Staffing often drops on weekends — this figure reveals whether the facility maintains adequate coverage outside of weekday hours. 4h 28m per day

Capacity and availability

This home usually has availability

Occupancy lower than 85% suggests more openings may be available.

Higher occupancy than the Illinois average: 69.3%
Occupancy rate 82.9% Rank #71 / 199Occupancy rate — State benchmarkedThis home is ranked 71st out of 199 homes in Illinois. Shows this facility's occupancy rate versus the Illinois average, with its Statewide rank out of 199. Higher occupancy signals strong local demand and financial stability.Click the rank badge to see the full State ranking.Click here to see the full State ranking.
Avg. Length of Stay 48 days
Occupancy rate
82.9% Rank #71 / 199Occupancy rate — State benchmarkedThis home is ranked 71st out of 199 homes in Illinois. Shows this facility's occupancy rate versus the Illinois average, with its Statewide rank out of 199. Higher occupancy signals strong local demand and financial stability.Click the rank badge to see the full State ranking.Click here to see the full State ranking.
Avg. Length of Stay
48 days
Bed community size
78-bed community Rank #195 / 430Bed count — State benchmarkedThis home is ranked 195th out of 430 homes in Illinois. Shows this facility's certified or reported bed count compared to other Illinois SNFs. Larger communities may offer more amenities, programs, and on-site services for residents and families.Click the rank badge to see the full State ranking.Click here to see the full State ranking.
A larger shared setting that may offer more common spaces and organized community services.
Years in operation
1 year in operation Rank #128 / 251Years in operation — State benchmarkedThis home is ranked 128th out of 251 homes in Illinois. Shows how long this facility has been in operation compared to other Illinois SNFs. Longer operating histories may benefit residents, families, and staff.Click the rank badge to see the full State ranking.Click here to see the full State ranking.
A newer community that may feature more recent facilities and programs.
Walk Score
Walk Score: 74 / 100 Rank #135 / 647Walk Score — State benchmarkedThis home is ranked 135th out of 647 homes in Illinois. Shows how walkable this facility's neighborhood is compared to the average Walk Score across Illinois SNFs. Higher scores benefit residents, families, and staff.Click the rank badge to see the full State ranking.Click here to see the full State ranking.
Very walkable. Most errands can be accomplished on foot, and many essentials are within a short walk.

About this community

License Details

Facility TypeAssisted Living/shared Housing Establishment
StatusActive
IssuanceMay 8, 2025
CountyCook
CMS Certification Number146128

Ownership & Operating Entity

Owner NamePlymouth Place, Inc.

Therapy & Rehabilitation

2 services
Rehabilitation Services
Respite Care

Contact Information

Amenities & Lifestyle

Center For Healthy Living
Gardens
Arboretum
Greenhouse
Putting Green
Pickle Ball Court
Dining Options Including Bistro And Thirty North
Specific ProgramsShort-Term Rehabilitation, Culinary Destinations, Neighborhood Events, Local Attractions, Exceptional Care, Therapy and Rehab, Philanthropy

Dining & Nutrition

Food DescriptionPlymouth Place offers a variety of dining options including a complimentary continental breakfast, an award-winning Bistro, and several themed dining experiences.

Contact PLYMOUTH PLACE, INC. (Assisted Living)

Inspection History

In Illinois, the Department of Public Health, Office of Health Care Regulation conducts annual unannounced surveys to assess compliance with state and federal healthcare facility standards.

Since 2023 · 3 years of data 2 deficiencies

Inspection Scorecard Info This scorecard compares key inspection, citation, and complaint metrics at this facility against the Illinois state average. Metrics rated ≥15% worse than average are highlighted in red; those ≥15% better are highlighted in green.

Since 2023 vs. Illinois state average
Overall vs. IL average 0 Worse No metrics in this bucket. 2 Better Metrics better than Illinois average:
• Total deficiencies (71% below)
• Deficiencies per year (70% below)
Latest Inspection July 21, 2025 Annual Inspection

Deficiencies Info Deficiencies are formal regulatory issues recorded during state inspections.

This FacilityIL Averagevs. IL Avg
Total deficiencies Info Formal regulatory issues recorded by inspectors across all inspection types. 27 This facility has 71% fewer total deficiencies than a typical Illinois nursing home (2 vs. IL avg 7).↓ 71% better
Deficiencies per year Info Average deficiencies per year since 2023. 0.72.3 This facility has 70% fewer deficiencies per year than a typical Illinois nursing home (0.7 vs. IL avg 2.3).↓ 70% better

Inspection Reports Summary Info An editor-reviewed summary of the themes and findings across this facility's recent inspection reports.

The most recent inspection on July 21, 2025, identified deficiencies related to revising service plans for residents’ physical and behavioral needs and ensuring required dementia-specific orientation training for staff. The prior inspection on August 22, 2024, found the facility in compliance with applicable assisted living regulations. Earlier deficiencies focused on care planning and staff training specific to the memory care unit. No complaint investigations were noted in the available reports. The record shows a recent emergence of issues after a previously clean inspection.

Read the full inspection reports for this facility, including detailed findings and corrective actions.

Show Inspection Reports

Health Inspection History

Inspections since 2023
Total health inspections 4

Illinois average 10.4


Last Health inspection on Jan 2025

Total health citations
21 Rank #45 / 167Health citations — State benchmarkedThis home is ranked 45th out of 167 homes in Illinois. Shows this facility's total health deficiency citations benchmarked to the Illinois State average, with a ranking across all 167 IL SNFs. Lower citation counts earn a better rank.Click the rank badge to see the full State ranking.Click here to see the full State ranking.

Illinois average 36.8

Citations per inspection
5.25 Rank #150 / 167Citations per inspection — State benchmarkedThis home is ranked 150th out of 167 homes in Illinois. Shows average deficiency citations per CMS inspection for this facility versus the Illinois mean across 167 SNFs with citation data. Lower is better.Click the rank badge to see the full State ranking.Click here to see the full State ranking.

Illinois average 3.68


Health citations are formal notices following inspections when they fail to comply with safety and care standards.

19 of 21 citations resulted from standard inspections; and 2 of 21 resulted from complaint investigations.

Breakdown of citation severity (last 3 years)
Critical Health citations
0
100% better than Illinois average

Illinois average: 0.7


Serious Health citations
3 Rank #60 / 135Serious citations (G–I) — State benchmarkedThis home is ranked 60th out of 135 homes in Illinois. Shows G–I scope serious health citations for this facility versus other Illinois SNFs. Lower counts rank better.Click the rank badge to see the full State ranking.Click here to see the full State ranking.
17% better than Illinois average

Illinois average: 3.6

0 critical citations Illinois average: 0.7

3 serious citations Illinois average: 3.6

17 moderate citations Illinois average: 32

1 minor citation Illinois average: 0.5
Citations history (last 3 years)
Environmental moderate citation Jan 24, 2025
Corrected

Environmental moderate citation Jan 24, 2025
Corrected

Nutrition moderate citation Jan 24, 2025
Corrected

Quality of Care moderate citation Jan 24, 2025
Corrected

Staffing Data

Reporting period: October 1 – December 31, 2025 (Q4 2025). Source: CMS Payroll-Based Journal report.

Total staff 193
Employees 110
Contractors 83
Staff to resident ratio 2.51:1
39% better than Illinois average
Illinois average ratio: 1.80:1 Illinois average ratio: 1.80:1See full Illinois ranking
Avg staff/day 54
Average shift 8.1 hours
7% better than Illinois average
Illinois average: 7.6 hours Illinois average shift: 7.6 hoursSee full Illinois ranking
Total staff hours (quarter) 40,434

Nursing staff breakdown

Q4 2025 · Oct 1 – Dec 31 More info This data comes from the CMS Payroll-Based Journal report covering October 1 – December 31, 2025.
Registered Nurse

Manages medical care and health needs.

RN Staff 30
Average shift length Info Average shift length. Calculated as total hours divided by days worked and average staff per day. 9.5 hours

This role is partially covered by contractors.

Licensed Practical Nurse

Assists with medical care and medications.

LPN Staff 34
Average shift length Info Average shift length. Calculated as total hours divided by days worked and average staff per day. 10 hours

This role is partially covered by contractors.

Certified Nursing Assistant

Helps with daily care and mobility.

CNA Staff 77
Average shift length Info Average shift length. Calculated as total hours divided by days worked and average staff per day. 8.7 hours

This role is partially covered by contractors.

Contractor staffing

Q4 2025 · Oct 1 – Dec 31 More info This data comes from the CMS Payroll-Based Journal report covering October 1 – December 31, 2025.

Total hours from contractors

15.5%

6,258 contractor hours this quarter

Licensed Practical Nurse: 28 Certified Nursing Assistant: 16 Speech Language Pathologist: 12 Respiratory Therapy Technician: 8 Physical Therapy Aide: 5 Physical Therapy Assistant: 5 Registered Nurse: 4 Qualified Social Worker: 3 Occupational Therapy Assistant: 1 Medical Director: 1

Staff by category

Q4 2025 · Oct 1 – Dec 31 More info This data comes from the CMS Payroll-Based Journal report covering October 1 – December 31, 2025.
Certified Nursing Assistant61167716,42492100%8.7
Registered Nurse264308,74892100%9.5
Licensed Practical Nurse628343,73692100%10
Dietitian7072,79692100%7.5
Clinical Nurse Specialist5051,5308795%8
Speech Language Pathologist012121,3438795%4.8
Physical Therapy Aide0551,2647582%6.2
Dental Services Staff2021,0086470%8
Respiratory Therapy Technician0889718087%5.8
Physical Therapy Assistant0556057076%4.9
Occupational Therapy Aide1015286672%8
Administrator1014686368%7.4
Qualified Social Worker0334356773%5.7
Nurse Practitioner1014325459%8
Occupational Therapy Assistant0111133740%3
Medical Director011362830%1.3
77 Certified Nursing Assistant
% of Days 100%
30 Registered Nurse
% of Days 100%
34 Licensed Practical Nurse
% of Days 100%
7 Dietitian
% of Days 100%
5 Clinical Nurse Specialist
% of Days 95%
12 Speech Language Pathologist
% of Days 95%
5 Physical Therapy Aide
% of Days 82%
2 Dental Services Staff
% of Days 70%
8 Respiratory Therapy Technician
% of Days 87%
5 Physical Therapy Assistant
% of Days 76%
1 Occupational Therapy Aide
% of Days 72%
1 Administrator
% of Days 68%
3 Qualified Social Worker
% of Days 73%
1 Nurse Practitioner
% of Days 59%
1 Occupational Therapy Assistant
% of Days 40%
1 Medical Director
% of Days 30%

Penalties and fines

Includes penalties issued in 2025

Federal penalties imposed by CMS for regulatory violations, including civil money penalties (fines) and denials of payment for new Medicare/Medicaid admissions.

Source: CMS Penalties Database (Data as of Jan 2026)

Total fines amount $77K Rank #117 / 168Federal fines — State benchmarkedThis home is ranked 117th out of 168 homes in Illinois. Shows this facility's cumulative CMS federal fine dollars versus the Illinois average among facilities with fines, and where it ranks among 168 skilled nursing facilities in the pool. Lower total dollars mean a better rank.Click the rank badge to see the full State ranking.Click here to see the full State ranking.
46% lower than Illinois average

Illinois average: $143K

Number of fines 2
33% fewer fines than Illinois average

Illinois average: 3.0

Payment Denials Info Serious action where Medicare and/or Medicaid temporarily stops payments for new residents until issues are fixed. 2
89% more payment denials than Illinois average

Illinois average: 1.1

Fines amount comparison
This facility $77K
Illinois average $143K
Penalty History

Penalties are imposed by CMS for violations of federal nursing home regulations.

2 penalties in the past 3 years

Multiple penalties were reported in the last 3 years.

Civil Money Penalty Info Fines imposed for noncompliance, which can be assessed per day or per instance of violation. Jan 2, 2025
$47K
Payment Denial Info Serious action where Medicare and/or Medicaid temporarily stops payments for new residents until issues are fixed. Jan 2, 2025
19 days

Last updated: Jan 2026

Quality of care over time

These measures show how residents usually do over time at this home, based on health outcomes and preventive care.

High-risk clinical events score Info A composite score based on pressure ulcers, falls with injury, weight loss, walking ability decline, and activities of daily living decline. 19.9
105% worse than Illinois average

Illinois average: 9.7

Functional decline score Info A composite score based on activities of daily living decline, walking ability decline, and incontinence. 39.7
114% worse than Illinois average

Illinois average: 18.6

Long-stay resident measures
Need for Help with Daily Activities Increased Info Percent of long-stay residents whose need for help with daily activities has increased 37.0%
139% worse than Illinois average

Illinois average: 15.5%

Walking Ability Worsened Info Percent of long-stay residents whose ability to move independently worsened 49.2%
167% worse than Illinois average

Illinois average: 18.4%

Low Risk Residents with Bowel/Bladder Incontinence Info Percent of low risk long-stay residents who lose control of their bowels or bladder 32.9%
52% worse than Illinois average

Illinois average: 21.6%

Falls with Major Injury Info Percent of long-stay residents experiencing one or more falls with major injury 0.0%
100% better than Illinois average

Illinois average: 3.4%

High Risk Residents with Pressure Ulcers Info Percent of long-stay high risk residents with pressure ulcers 4.8%
9% better than Illinois average

Illinois average: 5.3%

Urinary Tract Infection Info Percent of long-stay residents with a urinary tract infection 1.9%
8% worse than Illinois average

Illinois average: 1.8%

Lost Too Much Weight Info Percent of long-stay residents who lose too much weight 8.6%
31% worse than Illinois average

Illinois average: 6.5%

Depressive Symptoms Info Percent of long-stay residents who have depressive symptoms 7.1%
85% better than Illinois average

Illinois average: 48.1%

Antipsychotic Use Info Percent of long-stay residents who received an antipsychotic medication 17.5%
13% better than Illinois average

Illinois average: 20.2%

Pneumococcal Vaccine Info Percent of long-stay residents assessed and appropriately given the pneumococcal vaccine 98.8%
11% better than Illinois average

Illinois average: 89.2%

Influenza Vaccine Info Percent of long-stay residents assessed and appropriately given the seasonal influenza vaccine 75.0%
18% worse than Illinois average

Illinois average: 91.6%

Short-stay resident measures
Pneumococcal Vaccine Info Percent of short-stay residents assessed and appropriately given the pneumococcal vaccine 90.7%
33% better than Illinois average

Illinois average: 68.3%

Antipsychotic medication increase Info Percent of short-stay residents who newly received an antipsychotic medication 0.6%
76% better than Illinois average

Illinois average: 2.3%

Influenza Vaccine Info Percent of short-stay residents assessed and appropriately given the seasonal influenza vaccine 85.8%
36% better than Illinois average

Illinois average: 63.0%

Breakdown by payment type

Medicare

70% of new residents, usually for short-term rehab.

Typical stay 22 days

Private pay

30% of new residents, often for short stays.

Typical stay 3 - 4 months

Facility Characteristics

Source: CMS Long-Term Care Facility Characteristics (Data as of Jan 2026)

Total residents 77
Medicare
35
45.5% of residents
Private pay or other
42
54.5% of residents
Programs & Services
Residents Group

Residents meet regularly to discuss policies, care quality, and activities

Nurse Aide Training

State-approved Nurse Aide Training and Competency Evaluation Program on-site

CCRC

Part of a Continuing Care Retirement Community offering multiple care levels

Active Resident Council

Organized group of residents that meets regularly to discuss facility policies, quality of life, and activities.

Finances and operations

Voluntary non-profit community
Home revenue
$39.4M
Operating deficit
-$2.9M
Voluntary non-profit community
Home revenue
$39.4M Rank #8 / 166Revenue — State benchmarkedThis home is ranked 8th out of 166 homes in Illinois. Shows this facility's annual revenue compared to the Illinois SNF average. Higher revenue generally means more resources for staffing and capital — read alongside Payroll %.Click the rank badge to see the full State ranking.Click here to see the full State ranking.
Operating deficit
-$2.9M
Payroll costs Info The portion of the home's budget spent on staff, including nurses, caregivers, and other employees who support care and operations. Rank #3 / 166Payroll — State benchmarkedThis home is ranked 3rd out of 166 homes in Illinois. Shows total annual staff payroll benchmarked to the Illinois average. Higher payroll investment relative to peers often signals better staffing and less reliance on cheaper contract labor.Click the rank badge to see the full State ranking.Click here to see the full State ranking.
$18.3M
46.5% of revenue Rank #87 / 166Payroll % — State benchmarkedThis home is ranked 87th out of 166 homes in Illinois. Shows payroll as a percentage of revenue versus the Illinois average. Well-run Illinois SNFs typically land around 54–67% — the top third Statewide. Below 25% may signal understaffing or heavy agency use — read with Staffing ratings.Click the rank badge to see the full State ranking.Click here to see the full State ranking.
Other operating costs Info All remaining costs needed to run the home, such as food, utilities, building maintenance, supplies and administrative expenses.
$24.0M
Total costs $42.3M

Who this home usually serves

TYPE OF STAY

Mostly short-term rehab stays

Most residents typically stay for a few weeks or months before returning home or moving on.

Places of interest near PLYMOUTH PLACE, INC. (Assisted Living)

Address 5.3 miles from city center Info Estimated distance in miles from Lagrange Park's city center to PLYMOUTH PLACE, INC. (Assisted Living)'s address, calculated via Google Maps.

Calculate Travel Distance to PLYMOUTH PLACE, INC. (Assisted Living)

Add your location

Address

Financial Assistance for
Nursing Home in Illinois

PLYMOUTH PLACE, INC. (Assisted Living) is located in LaGrange Park, Illinois.
Here are the financial assistance programs available to residents in Illinois.

Get Financial aid guidance

Community Care Program

Illinois CCP

Age 60+
General Illinois resident, at risk of nursing home placement.
Income Limits (2025) ~$1,215/month individual
Asset Limits $17,500 individual, excludes home, car
IL

High demand in urban areas; waitlists possible.

Benefits
In-home care (3-5 hours/day) Adult day services ($65/day) Emergency home response systems ($30/month)

Illinois Respite Program

IL Respite (via NFCSP)

Age Caregiver of someone 60+ (or with dementia)
General Illinois resident.
Income Limits No strict limit; prioritizes low-income.
Asset Limits Not applicable.
IL

Limited slots; urban/rural balance.

Benefits
In-home respite (4-6 hours/day) Adult day care (~$65/day) Short-term facility care (up to 5 days)

Supportive Living Program (SLP)

Illinois Medicaid Supportive Living Program

Age 65+ or 22-64 with disability
General Illinois resident, Medicaid-eligible, needs moderate assistance (not nursing home-level).
Income Limits (2025) ~$2,829/month (300% FBR, individual); QIT allowed.
Asset Limits $2,000 (individual), $3,000 (couple) (excludes home, car).
IL

~200 SLP sites statewide; room/board not covered.

Benefits
Personal care (5-7 hours/day, e.g., bathing, mobility) Meals Housekeeping Medication management Respite (~240 hours/year)

Persons Who Are Elderly Waiver

Illinois Medicaid Elderly Waiver

Age 65+
General Illinois resident, Medicaid-eligible, nursing home-level care need.
Income Limits (2025) ~$2,829/month 300% FBR, individual
Asset Limits $2,000 (individual), $3,000 (couple).
IL

Part of HealthChoice Illinois; consumer-directed options available.

Benefits
Personal care (5-7 hours/day, e.g., dressing, eating) Homemaker Adult day care (~$60/day) Respite (240 hours/year) Home mods ($1,000 avg.)

Medicare Savings Program (MSP)

Illinois Medicare Savings Program

Age 65+ or disabled
General Illinois resident, Medicare Part A/B.
Income Limits (2025) ~$2,510/month (QMB), ~$3,380/month (SLMB), ~$3,598/month (QI)—individual.
Asset Limits $9,430 (individual), $14,130 (couple).
IL

Three tiers; no waitlist.

Benefits
Covers Part B premiums ($174.70/month) Deductibles ($240/year) Copays (~20%)

Optional State Supplementation (OSS)

Illinois Optional State Supplementation

Age 65+ or disabled
General Illinois resident, in approved facility, SSI recipient or low-income.
Income Limits (2025) ~$1,004/month including SSI
Asset Limits $2,000 (individual), $3,000 (couple).
IL

~$50-$500/month based on facility type.

Benefits
Cash (~$50-$500/month) for room/board in personal care homes or SLFs

VA Aid and Attendance (A&A) and Housebound Benefits

Illinois VA Aid and Attendance/Housebound

Age 65+ or disabled veteran/spouse
General Illinois resident, wartime service, need for ADL help (A&A) or homebound.
Income Limits (2025) Net income < ~$1,984/month (veteran with dependent, A&A); pension offsets income.
Asset Limits ~$155,356 net worth limit
IL

High veteran demand in urban/rural areas.

Benefits
Cash (~$1,433-$2,642/month veteran, ~$951-$1,318 spouse) for care costs (e.g., in-home, assisted living)

Frequently Asked Questions about PLYMOUTH PLACE, INC. (Assisted Living)

What neighborhood is PLYMOUTH PLACE, INC. (Assisted Living) in?

PLYMOUTH PLACE, INC. (Assisted Living) is in the Orland Township neighborhood of LaGrange Park.

Who is the owner of PLYMOUTH PLACE, INC. (Assisted Living)?

The legal owner and operator of PLYMOUTH PLACE, INC. (Assisted Living) is Plymouth Place, Inc..

Is PLYMOUTH PLACE, INC. (Assisted Living) in a walkable area?

PLYMOUTH PLACE, INC. (Assisted Living) has a walk score of 74. Very walkable. Most errands can be accomplished on foot, and many essentials are within a short walk.

What is the best email address for PLYMOUTH PLACE, INC. (Assisted Living)?

The team at PLYMOUTH PLACE, INC. (Assisted Living) can be reached at [email protected].

How many beds does PLYMOUTH PLACE, INC. (Assisted Living) have?

PLYMOUTH PLACE, INC. (Assisted Living) has 78 beds.

Are there photos of PLYMOUTH PLACE, INC. (Assisted Living)?

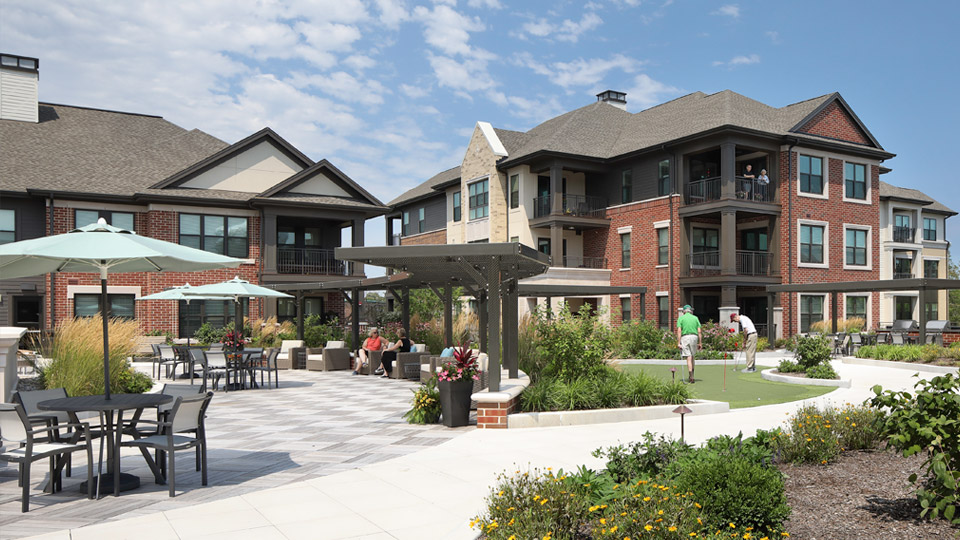
Yes — there are 3 photos of PLYMOUTH PLACE, INC. (Assisted Living) in the photo gallery on this page.

What is the address of PLYMOUTH PLACE, INC. (Assisted Living)?

PLYMOUTH PLACE, INC. (Assisted Living) is located at 315 N LaGrange Rd.

Guides for Better Senior Living

Care Cost Calculator: See Prices in Your Area

Nursing Home Data Explorer

Don’t Wait Too Long: 7 Red Flag Signs Your Parent Needs Assisted Living Now

The True Cost of Assisted Living in 2025 – And How Families Are Paying For It

Understanding Senior Living Costs: Pricing Models, Discounts & Financial Assistance

Explore Open Rooms
1 Contact details
2 What type of senior care service are you looking for?
3 What budget do you have in mind for senior care?
4 How soon do you need to find care?
5 Additional details

Thank you for your interest!

Our team will be in touch shortly to help with next steps.