ProMedica Skilled Nursing And Rehabilitation (Voorhees)
Nursing Home & Assisted Living · Voorhees Township, NJ
CMS overall rating Info CMS (the Centers for Medicare & Medicaid Services) is the federal agency that rates nursing home quality. Its Overall Rating runs from 1 to 5 stars, combining health inspections, staffing, and quality measures, with inspections weighted most heavily.

ProMedica Skilled Nursing And Rehabilitation (Voorhees)

Nursing Home & Assisted Living · Voorhees Township, NJ
CMS overall rating Info CMS (the Centers for Medicare & Medicaid Services) is the federal agency that rates nursing home quality. Its Overall Rating runs from 1 to 5 stars, combining health inspections, staffing, and quality measures, with inspections weighted most heavily.
Calculator: See prices in your area
ProMedica Skilled Nursing And Rehabilitation (Voorhees) accepts Medicare, Medicaid, and private pay.

Overview of Promedica Skilled Nursing and Rehabilitation (voorhees)

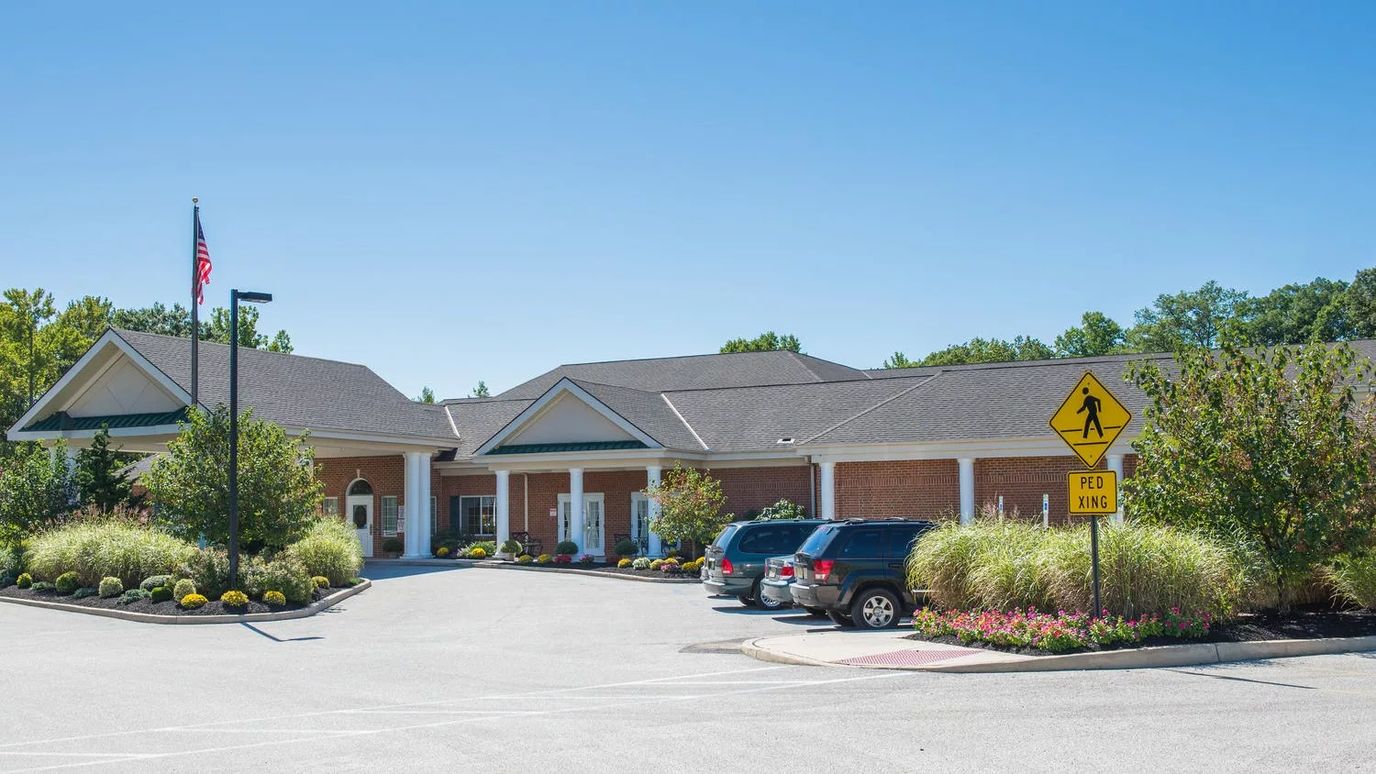
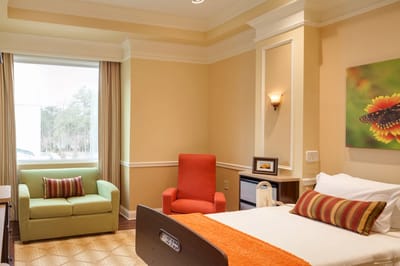
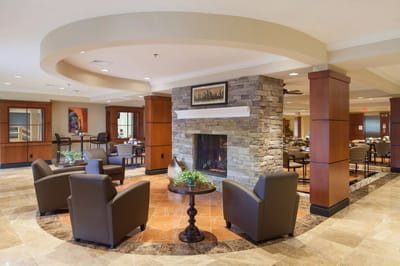
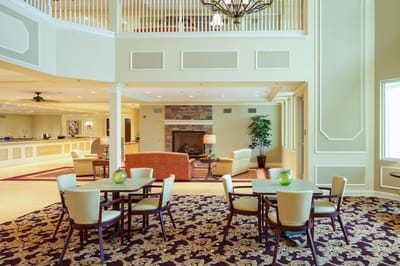
Promedica Nursing and Rehabilitation in Vorhees, New Jersey, provides one of the most trusted facilities that deliver exceptional care. The community offers an inviting atmosphere with refined hospitality. With an emphasis on skilled nursing and rehabilitation care, the staff is ready to attend to any need with compassion and dignity. The nursing center maintains its residents’ sense of individuality while being able to enhance their quality of life in a nurturing environment.

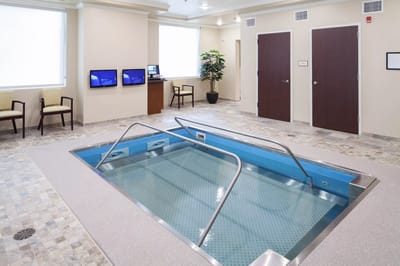
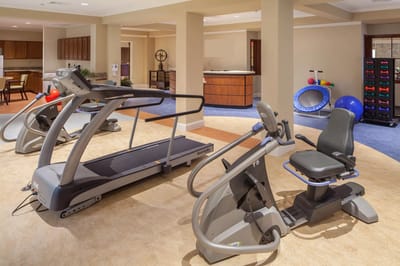
Promedica’s services are focused on its residents’ cognitive health and overall wellness– 24-hour supervision, housekeeping, scheduled activities, engaging programs, social clubs, and religious services. Its comprehensive medical programs include rehabilitative therapies (physical, occupational, speech), registered nurses available, a nutritionist, and individualized care plans.

Quality ratings

Measured by Centers for Medicare & Medicaid Services (CMS)

Overall rating Info The Overall CMS Rating combines results from health inspections, staffing levels and quality measures. Health inspections carry the most weight. Staffing and quality scores can increase or decrease the final rating based on performance compared to state and national standards.
▼ 38.6% Below NJ avg. ▼ 38.6% Below NJ avg.NJ average: 3.3Click the badge to see the full State ranking.Click here to see the full State ranking.
Health Inspection Info Based on the results of the facility's three most recent standard inspections and any complaint investigations. CMS reviews the number, scope, and severity of deficiencies, with more recent findings weighted more heavily.
▼ 64.0% Below NJ avg. ▼ 64.0% Below NJ avg.NJ average: 2.8Click the badge to see the full State ranking.Click here to see the full State ranking.
Staffing Info Measures average nursing staff hours per resident per day, including Registered Nurses (RNs) and total nursing staff. Ratings are adjusted based on the level of care residents require and are compared to state and national benchmarks.
▼ 67.2% Below NJ avg. ▼ 67.2% Below NJ avg.NJ average: 3.0Click the badge to see the full State ranking.Click here to see the full State ranking.
Quality Measures Info Based on clinical and physical health indicators reported to CMS, such as hospital readmissions, falls, pressure ulcers, and improvements in mobility. These measures reflect how well residents' health needs are being managed.
▲ 16.1% Above NJ avg. ▲ 16.1% Above NJ avg.NJ average: 4.3Click the badge to see the full State ranking.Click here to see the full State ranking.

Staffing hours breakdown

Info Daily nursing hours per resident by staff type, reported to CMS. Higher is generally better — compare this facility to state and national averages to see where staffing stands.

Hours per resident per day — compared to New Jersey state averages

Total nursing care / resident Info This home is ranked 160th out of 294 homes in New Jersey for nurse hours. Total adjusted nursing hours per resident per day, combining RN, LPN, and aide time. CMS adjusts this for case-mix so facilities can be fairly compared.
3h 35m per day
Rank #160 / 294Nurse hours — State benchmarkedThis home is ranked 160th out of 294 homes in New Jersey. Shows adjusted nurse hours per resident per day benchmarked to the New Jersey average, with a ranking across 294 New Jersey facilities. More hours mean more direct care. The national average is about 3.5 hrs; below 3.0 is a red flag.Rankings are based only on facilities in New Jersey that report data for that category. Facilities without available data are excluded from the ranking.Click the rank badge to see the full State ranking.Click here to see the full State ranking.
This facility New Jersey avg (3h 53m per day)
vs New Jersey avg
-7%

2 of 6 metrics below state avg

Standout metric Physical Therapist is +114% above state avg
Staff typeHours / Day / Residentvs state avg
Registered Nurse (RN) Info RNs hold the highest nursing license and can assess residents, interpret test results, and direct care plans. More RN hours per day often signals stronger clinical oversight and faster response to health changes. 21m per day ▼ 48% State avg: 41m per day · National avg: 41m per day
LPN / LVN Info Licensed Practical Nurses (LPNs) or Licensed Vocational Nurses (LVNs) deliver routine hands-on care — medication administration, wound dressing, and monitoring vital signs. They work under RN supervision and make up a large share of daily bedside care. 1h 55m per day ▲ 105% State avg: 56m per day · National avg: 52m per day
Nurse Aide Info Certified Nurse Aides (CNAs) provide the most direct day-to-day assistance: bathing, dressing, feeding, and mobility. Nurse aide hours are typically the largest staffing category and directly affect residents' quality of life. 2h 13m per day ■ Avg State avg: 2h 14m per day · National avg: 2h 21m per day
Weekend Total Nursing Info Combined nursing hours (RN + LPN + Nurse Aide) per resident per day on weekends. Staffing often drops on weekends — this figure reveals whether the facility maintains adequate coverage outside of weekday hours. 4h 8m per day ▲ 20% State avg: 3h 27m per day · National avg: 3h 26m per day
Physical Therapist Info Hours per resident per day provided by licensed Physical Therapists (PTs) or PT Assistants. PT services help residents recover mobility after injury or illness and are especially important for post-acute (short-stay) rehabilitation. 13m per day ▲ 114% State avg: 6m per day · National avg: 4m per day
Weekend RN Info Registered nurse hours specifically on weekends. Facilities sometimes reduce RN presence on Saturdays and Sundays — a low weekend RN figure compared to weekday hours can indicate reduced clinical oversight when most administrative staff are absent. 14m per day ▼ 53% State avg: 29m per day · National avg: 29m per day

Capacity and availability

This home usually has availability

Similar occupancy to the New Jersey average: 77%
Occupancy rate
76.5% Rank #276 / 496Occupancy rate — State benchmarkedThis home is ranked 276th out of 496 homes in New Jersey. Shows this facility's occupancy rate versus the New Jersey average, with its Statewide rank out of 496. Higher occupancy signals strong local demand and financial stability.Rankings are based only on facilities in New Jersey that report data for that category. Facilities without available data are excluded from the ranking.Click the rank badge to see the full State ranking.Click here to see the full State ranking.
Avg. Length of Stay
42 days
Bed community size
124-bed community Rank #219 / 561Bed count — State benchmarkedThis home is ranked 219th out of 561 homes in New Jersey. Shows this facility's certified or reported bed count compared to other New Jersey facilities. Larger communities may offer more amenities, programs, and on-site services for residents and families.Rankings are based only on facilities in New Jersey that report data for that category. Facilities without available data are excluded from the ranking.Click the rank badge to see the full State ranking.Click here to see the full State ranking.
A larger shared setting that may offer more common spaces and organized community services.
Walk Score
Walk Score: 41 / 100 Rank #354 / 640Walk Score — State benchmarkedThis home is ranked 354th out of 640 homes in New Jersey. Shows how walkable this facility's neighborhood is compared to the average Walk Score across New Jersey facilities. Higher scores benefit residents, families, and staff.Rankings are based only on facilities in New Jersey that report data for that category. Facilities without available data are excluded from the ranking.Click the rank badge to see the full State ranking.Click here to see the full State ranking.
Somewhat walkable. A few nearby services may be reachable on foot, but most trips require transportation.

Contact ProMedica Skilled Nursing And Rehabilitation (Voorhees)

Staffing Data

Reporting period: October 1 – December 31, 2025 (Q4 2025). Source: CMS Payroll-Based Journal report.

Total staff 576
Employees 114
Contractors 462
Staff to resident ratio 5.49 : 1
206% more staff per resident than New Jersey average
New Jersey average ratio: 1.79 : 1 New Jersey average ratio: 1.79 : 1See full New Jersey ranking
Avg staff/day 83
Average shift 7.8 hours
0% compared with New Jersey average
New Jersey average: 8 hours New Jersey average shift: 8 hoursSee full New Jersey ranking
Total staff hours (quarter) 59,660

Nursing staff breakdown

Q4 2025 · Oct 1 – Dec 31 More info This data comes from the CMS Payroll-Based Journal report covering October 1 – December 31, 2025.
Registered Nurse

Manages medical care and health needs.

RN Staff Info All 8 RN Staff are full-time employees. No contractors work on this role. 8
Average shift length Info Average shift length. Calculated as total hours divided by days worked and average staff per day. 9.4 hours
Licensed Practical Nurse

Assists with medical care and medications.

LPN Staff Info 227 total: 33 full-time employees and 194 contractors. 227
Average shift length Info Average shift length. Calculated as total hours divided by days worked and average staff per day. 7.9 hours
Certified Nursing Assistant

Helps with daily care and mobility.

CNA Staff Info 282 total: 52 full-time employees and 230 contractors. 282
Average shift length Info Average shift length. Calculated as total hours divided by days worked and average staff per day. 8 hours

Contractor staffing

Q4 2025 · Oct 1 – Dec 31 More info This data comes from the CMS Payroll-Based Journal report covering October 1 – December 31, 2025.

Total hours from contractors

39.9%

23,801 contractor hours this quarter

Certified Nursing Assistant: 230 Licensed Practical Nurse: 194 Physical Therapy Assistant: 12 Respiratory Therapy Technician: 9 Speech Language Pathologist: 7 Physical Therapy Aide: 6 Qualified Social Worker: 4

Staff by category

Q4 2025 · Oct 1 – Dec 31 More info This data comes from the CMS Payroll-Based Journal report covering October 1 – December 31, 2025.
Certified Nursing Assistant5223028223,04792100%8
Licensed Practical Nurse3319422717,56892100%7.9
Registered Nurse8082,7329199%9.4
RN Director of Nursing5052,3428087%8.4
Respiratory Therapy Technician0992,2249098%7.7
Dental Services Staff5052,2177379%7.5
Physical Therapy Assistant012122,0229199%6.7
Physical Therapy Aide0661,8446975%6.8
Speech Language Pathologist0771,4507379%7.3
Other Dietary Services Staff6061,34092100%6.8
Qualified Social Worker0441,0207379%7.1
Administrator1015286672%8
Clinical Nurse Specialist2024696065%7.7
Nurse Practitioner1014656166%7.6
Dietitian1013925358%7.4
282 Certified Nursing Assistant
% of Days 100%
227 Licensed Practical Nurse
% of Days 100%
8 Registered Nurse
% of Days 99%
5 RN Director of Nursing
% of Days 87%
9 Respiratory Therapy Technician
% of Days 98%
5 Dental Services Staff
% of Days 79%
12 Physical Therapy Assistant
% of Days 99%
6 Physical Therapy Aide
% of Days 75%
7 Speech Language Pathologist
% of Days 79%
6 Other Dietary Services Staff
% of Days 100%
4 Qualified Social Worker
% of Days 79%
1 Administrator
% of Days 72%
2 Clinical Nurse Specialist
% of Days 65%
1 Nurse Practitioner
% of Days 66%
1 Dietitian
% of Days 58%

Penalties and fines

Includes penalties issued in 2024

Federal penalties imposed by CMS for regulatory violations, including civil money penalties (fines) and denials of payment for new Medicare/Medicaid admissions.

Source: CMS Penalties Database (Data as of Jan 2026)

Total fines amount $10K Rank #272 / 297Federal fines — State benchmarkedThis home is ranked 272nd out of 297 homes in New Jersey. Shows this facility's cumulative CMS federal fine dollars versus the New Jersey average among facilities with fines, and where it ranks among 297 facilities in the pool. Lower total dollars mean a better rank.Rankings are based only on facilities in New Jersey that report data for that category. Facilities without available data are excluded from the ranking.Click the rank badge to see the full State ranking.Click here to see the full State ranking.
87% lower than New Jersey average

New Jersey average: $77K

Number of fines 1
50% fewer fines than New Jersey average

New Jersey average: 2.0

Payment Denials Info Serious action where Medicare and/or Medicaid temporarily stops payments for new residents until issues are fixed. 0
100% fewer payment denials than New Jersey average

New Jersey average: 0.1

Fines amount comparison
This facility $10K
New Jersey average $77K
Penalty History

Penalties are imposed by CMS for violations of federal nursing home regulations.

1 penalty in the past 3 years

Nov 27, 2024 · $10K

Civil Money Penalty Info Fines imposed for noncompliance, which can be assessed per day or per instance of violation. Nov 27, 2024
$10K

Last updated: Jan 2026

Quality of care over time

These measures show how residents usually do over time at this home, based on health outcomes and preventive care.

High-risk clinical events score Info A composite score based on pressure ulcers, falls with injury, weight loss, walking ability decline, and activities of daily living decline. 8.3
21% worse than New Jersey average

New Jersey average: 6.8

Functional decline score Info A composite score based on activities of daily living decline, walking ability decline, and incontinence. 11.0
11% better than New Jersey average

New Jersey average: 12.4

Long-stay resident measures
Significantly above average New Jersey avg: 4.5 Info CMS star rating based on long-stay quality measure performance. 5 stars = significantly above average, 1 star = significantly below average.
Need for Help with Daily Activities Increased Info Percent of long-stay residents whose need for help with daily activities has increased 8.8%
13% better than New Jersey average

New Jersey average: 10.1%

Walking Ability Worsened Info Percent of long-stay residents whose ability to move independently worsened 12.7%
15% worse than New Jersey average

New Jersey average: 11.0%

Low Risk Residents with Bowel/Bladder Incontinence Info Percent of low risk long-stay residents who lose control of their bowels or bladder 11.7%
27% better than New Jersey average

New Jersey average: 16.0%

Falls with Major Injury Info Percent of long-stay residents experiencing one or more falls with major injury 0.0%
100% better than New Jersey average

New Jersey average: 2.4%

High Risk Residents with Pressure Ulcers Info Percent of long-stay high risk residents with pressure ulcers 14.8%
143% worse than New Jersey average

New Jersey average: 6.1%

Urinary Tract Infection Info Percent of long-stay residents with a urinary tract infection 0.0%
100% better than New Jersey average

New Jersey average: 1.0%

Lost Too Much Weight Info Percent of long-stay residents who lose too much weight 5.1%
9% worse than New Jersey average

New Jersey average: 4.6%

Depressive Symptoms Info Percent of long-stay residents who have depressive symptoms 17.8%
58% worse than New Jersey average

New Jersey average: 11.3%

Antipsychotic Use Info Percent of long-stay residents who received an antipsychotic medication 14.5%
31% worse than New Jersey average

New Jersey average: 11.1%

Pneumococcal Vaccine Info Percent of long-stay residents assessed and appropriately given the pneumococcal vaccine 100.0%
8% better than New Jersey average

New Jersey average: 93.0%

Influenza Vaccine Info Percent of long-stay residents assessed and appropriately given the seasonal influenza vaccine 100.0%
In line with New Jersey average

New Jersey average: 97.2%

Hospitalizations per 1,000 days Info Number of hospitalizations per 1,000 long-stay resident days. 1.12
46% better than New Jersey average

New Jersey average: 2.08

ED visits per 1,000 days Info Number of outpatient emergency department visits per 1,000 long-stay resident days. 0.82
27% better than New Jersey average

New Jersey average: 1.12

Short-stay resident measures
Significantly above average New Jersey avg: 3.8 Info CMS star rating based on short-stay quality measure performance. 5 stars = much above average, 1 star = much below average.
Pneumococcal Vaccine Info Percent of short-stay residents assessed and appropriately given the pneumococcal vaccine 92.0%
17% better than New Jersey average

New Jersey average: 78.9%

Antipsychotic medication increase Info Percent of short-stay residents who newly received an antipsychotic medication 1.1%
5% better than New Jersey average

New Jersey average: 1.2%

Influenza Vaccine Info Percent of short-stay residents assessed and appropriately given the seasonal influenza vaccine 97.2%
21% better than New Jersey average

New Jersey average: 80.1%

Re-hospitalized after SNF stay Info Percentage of short-stay residents who were re-hospitalized after their nursing home admission. 34.9%
37% worse than New Jersey average

New Jersey average: 25.4%

Emergency department visits Info Percentage of short-stay residents who had an outpatient emergency department visit. 9.2%
12% worse than New Jersey average

New Jersey average: 8.2%

Falls with major injury Info Percentage of SNF residents who experience falls with major injury during their stay. 0.7%
5% better than New Jersey average

New Jersey average: 0.8%

Ability to care for self at discharge Info Percentage of residents at or above expected ability to care for themselves at discharge. 62.7%
17% better than New Jersey average

New Jersey average: 53.7%

Successful return to home or community Info Rate of successful return to home or community from a skilled nursing facility. 60.7%
20% better than New Jersey average

New Jersey average: 50.6%

Breakdown by payment type

Medicare

32% of new residents, usually for short-term rehab.

Typical stay 2 months

Private pay

45% of new residents, often for short stays.

Typical stay 1 - 2 months

Medicaid

23% of new residents, often for long-term daily care.

Typical stay 18 days

Facility Characteristics

Source: CMS Long-Term Care Facility Characteristics (Data as of Jan 2026)

Total residents 105
Medicare
81
77.1% of residents
Medicaid
24
22.9% of residents
Programs & Services
Residents Group

Residents meet regularly to discuss policies, care quality, and activities

Active Resident Council

Organized group of residents that meets regularly to discuss facility policies, quality of life, and activities.

Finances and operations

Based on CMS SNF Cost Report for fiscal year ending in 12/2023.

For-profit
Individual
Net patient revenue Info Net patient revenue — what the home actually collects for resident care, after contractual allowances, bad debt and discounts are subtracted from its gross charges (CMS cost report, Worksheet G-3). It covers resident care only; money the home earns from other sources is shown separately as "Other income."
$16.2M
Net patient income Info Net patient income: net patient revenue minus the home's total operating expenses. A positive figure means it earns more from resident care than it spends to deliver it; a negative figure means the opposite. It excludes non-operating "other income."
-$2.3M
For-profit Individual
Net patient revenue Info Net patient revenue — what the home actually collects for resident care, after contractual allowances, bad debt and discounts are subtracted from its gross charges (CMS cost report, Worksheet G-3). It covers resident care only; money the home earns from other sources is shown separately as "Other income."
$16.2M Rank #134 / 292Revenue — State benchmarkedThis home is ranked 134th out of 292 homes in New Jersey. Shows this facility's annual revenue compared to the New Jersey average. Higher revenue generally means more resources for staffing and capital — read alongside Payroll %.Rankings are based only on facilities in New Jersey that report data for that category. Facilities without available data are excluded from the ranking.Click the rank badge to see the full State ranking.Click here to see the full State ranking.
Net patient income Info Net patient income: net patient revenue minus the home's total operating expenses. A positive figure means it earns more from resident care than it spends to deliver it; a negative figure means the opposite. It excludes non-operating "other income."
-$2.3M
Other income Info Money the home earns outside of resident care — such as investments, grants, rentals and other non-operating sources (CMS cost report, Worksheet G-3). It is tracked separately from net patient revenue: it is not part of that figure, and it is not included in net patient income.
$646.0K
Payroll costs Info Staff salaries plus wage-related costs — benefits such as payroll taxes, health insurance and retirement — from the home's own accounting records (CMS cost report, Worksheet A). Contract or agency labor is counted separately, under other operating costs. Rank #175 / 292Payroll — State benchmarkedThis home is ranked 175th out of 292 homes in New Jersey. Shows total annual staff payroll benchmarked to the New Jersey average. Higher payroll investment relative to peers often signals better staffing and less reliance on cheaper contract labor.Rankings are based only on facilities in New Jersey that report data for that category. Facilities without available data are excluded from the ranking.Click the rank badge to see the full State ranking.Click here to see the full State ranking.
$6.5M 40% of net patient revenue Info Payroll as a share of revenue: staff salaries and wage-related benefits divided by net patient revenue. A higher figure means more of each revenue dollar goes to staff pay. Rank #241 / 292Payroll % — State benchmarkedThis home is ranked 241st out of 292 homes in New Jersey. Shows payroll as a percentage of revenue versus the New Jersey average. Well-run New Jersey facilities typically land around 55–65% — the top third Statewide. Below 25% may signal understaffing or heavy agency use — read with Staffing ratings.Rankings are based only on facilities in New Jersey that report data for that category. Facilities without available data are excluded from the ranking.Click the rank badge to see the full State ranking.Click here to see the full State ranking.
Other operating costs Info Everything it costs to run the home apart from payroll — food, utilities, supplies, maintenance, contract labor and administration. Calculated as total operating expense minus payroll (staff salaries and wage-related benefits).
$12.1M
Total costs Info The home's total operating expense for the year — all the costs of running it, salaries included (CMS cost report, Worksheet G-3).
$18.5M

Who this home usually serves

TYPE OF STAY

Mix of rehab and long-term care

This home supports both short-term rehab and long-term care, with residents staying for a wide range of durations.

New residents most often arrive under private pay (45% of admissions), and a typical private pay stay runs around 1 - 2 months.

Admissions
580 total

Coverage residents most often arrive under.

Medicare 32%
Private pay 45%
Medicaid 23%
Discharges
666 total

Coverage residents most often leave under.

Medicare 40%
Private pay 54%
Medicaid 6%

Matterport

Experience a digital walkthrough
Loading tour...

Places of interest near ProMedica Skilled Nursing And Rehabilitation (Voorhees)

Address 1.2 miles from city center Info Estimated distance in miles from Voorhees Township's city center to ProMedica Skilled Nursing And Rehabilitation (Voorhees)'s address, calculated via Google Maps. — 8.18 miles to nearest hospital (Jefferson Cherry Hill Hospital)

Calculate Travel Distance to ProMedica Skilled Nursing And Rehabilitation (Voorhees)

Add your location

Address

Compare Nursing Homes around Trenton

The information below is reported by the New Jersey Department of Health, Health Facilities Evaluation and Licensing.

5 facilities compared · CMS & NJ Dept. of Health data

Complete Care at Mercerville
NH
HC
NC
PC
RC
Mercerville
114
Facility 114
NJ AVG 125
Rank #303 / 561
96.5%
Facility 96.5%
NJ AVG 77%
Rank #23 / 496
+25%
3.58
Facility 3.58
NJ AVG 3.88
Rank #160 / 294
-50%-8%
$0
Facility $0
NJ AVG $76.4k
Rank #1 / 297
21
Facility 21
NJ AVG 20.9
Rank #162 / 296
4.2
Facility 4.2
NJ AVG 5.3
Rank #106 / 296
-103-
62
Facility 62
NJ AVG 47
Rank #212 / 640
Complete Care At Mercerville LLC
$13.1M
Facility $13.1M
NJ AVG $19.6M
Rank #212 / 292
$5.7M
Facility $5.7M
NJ AVG $7.1M
Rank #221 / 292
43.6%
Facility 43.6%
NJ AVG 39.3%
Rank #160 / 292
315094
Avant Rehabilitation & Care Center
NH
HC
PC
Trenton (Top Road)
149
Facility 149
NJ AVG 125
Rank #153 / 561
88.6%
Facility 88.6%
NJ AVG 77%
Rank #124 / 496
+15%
3.13
Facility 3.13
NJ AVG 3.88
Rank #259 / 294
-71%-19%
$0
Facility $0
NJ AVG $76.4k
Rank #1 / 297
48
Facility 48
NJ AVG 20.9
Rank #291 / 296
16.0
Facility 16.0
NJ AVG 5.3
Rank #295 / 296
5139-
72
Facility 72
NJ AVG 47
Rank #144 / 640
Riten Pandya
$9.0M
Facility $9.0M
NJ AVG $19.6M
Rank #259 / 292
$4.5M
Facility $4.5M
NJ AVG $7.1M
Rank #216 / 292
49.8%
Facility 49.8%
NJ AVG 39.3%
Rank #22 / 292
315455
Preferred Care at Mercer
NH
HC
NC
RC
Ewing Township (Fernwood)
100
Facility 100
NJ AVG 125
Rank #368 / 561
81.0%
Facility 81.0%
NJ AVG 77%
Rank #231 / 496
+5%
3.37
Facility 3.37
NJ AVG 3.88
Rank #197 / 294
-35%-13%
$0
Facility $0
NJ AVG $76.4k
Rank #1 / 297
14
Facility 14
NJ AVG 20.9
Rank #74 / 296
3.5
Facility 3.5
NJ AVG 5.3
Rank #73 / 296
-88-
64
Facility 64
NJ AVG 47
Rank #198 / 640
Preferred Care At Mercer LLC
$12.7M
Facility $12.7M
NJ AVG $19.6M
Rank #196 / 292
$7.1M
Facility $7.1M
NJ AVG $7.1M
Rank #187 / 292
55.9%
Facility 55.9%
NJ AVG 39.3%
Rank #125 / 292
315487
ProMedica Skilled Nursing And Rehabilitation (Voorhees)
NH
AL
Voorhees Township
124
Facility 124
NJ AVG 125
Rank #219 / 561
76.5%
Facility 76.5%
NJ AVG 77%
Rank #276 / 496
-1%
3.59
Facility 3.59
NJ AVG 3.88
Rank #160 / 294
-85%-7%
$130.2k
Facility $130.2k
NJ AVG $76.4k
Rank #272 / 297
22
Facility 22
NJ AVG 20.9
Rank #172 / 296
3.1
Facility 3.1
NJ AVG 5.3
Rank #53 / 296
5113-
41
Facility 41
NJ AVG 47
Rank #354 / 640
-
$16.2M
Facility $16.2M
NJ AVG $19.6M
Rank #134 / 292
$6.5M
Facility $6.5M
NJ AVG $7.1M
Rank #175 / 292
40%
Facility 40%
NJ AVG 39.3%
Rank #241 / 292
315513
Belle Care Nursing & Rehabilitation Center
NH
HC
MC
PC
Trenton (Stuyvesant/Prospect)
106
Facility 106
NJ AVG 125
Rank #349 / 561
88.7%
Facility 88.7%
NJ AVG 77%
Rank #121 / 496
+15%
3.95
Facility 3.95
NJ AVG 3.88
Rank #85 / 294
-72%+2%
$27.6k
Facility $27.6k
NJ AVG $76.4k
Rank #219 / 297
64
Facility 64
NJ AVG 20.9
Rank #296 / 296
16.0
Facility 16.0
NJ AVG 5.3
Rank #295 / 296
7100-
69
Facility 69
NJ AVG 47
Rank #163 / 640
Joseph Perlow
$7.8M
Facility $7.8M
NJ AVG $19.6M
Rank #271 / 292
$3.5M
Facility $3.5M
NJ AVG $7.1M
Rank #245 / 292
44.9%
Facility 44.9%
NJ AVG 39.3%
Rank #17 / 292
315124

Financial Assistance for
Nursing Home in New Jersey

ProMedica Skilled Nursing And Rehabilitation (Voorhees) is located in Voorhees Township, New Jersey.
Here are the financial assistance programs available to residents in New Jersey.

Get Financial aid guidance

Managed Long Term Services and Supports

NJ Medicaid MLTSS

Age 65+ or disabled
General New Jersey resident, Medicaid- eligible, nursing home-level care need.
Income Limits (2025) ~$2,829/month 300% FBR, individual
Asset Limits $2,000 (individual), $3,000 (couple).
NJ

High urban demand; managed care model.

Benefits
In-home care (5-7 hours/day) Assisted living Respite (240 hours/year) Medical services

JACC (Jersey Assistance for Community Caregiving)

NJ JACC

Age 60+
General New Jersey resident, at risk of nursing home.
Income Limits ~$2,500/month individual, varies
Asset Limits $40,000 individual
NJ

Higher asset limit; limited funding.

Benefits
In-home care (3-5 hours/week) Respite (up to 10 days/year) Home modifications (~$1,000 avg.)

Pharmaceutical Assistance to the Aged and Disabled (PAAD)

New Jersey PAAD

Age 65+
General NJ resident, enrolled in Medicare Part D or eligible.
Income Limits (2025) ~$42,142/year (individual), ~$49,209/year (couple).
Asset Limits Not assessed.
NJ

Copays $5 (generic), $7 (brand); covers Part D premiums up to benchmark.

Benefits
Prescription cost reduction ($500-$1,000/year savings) Premium assistance ($20/month above benchmark)

Senior Gold Prescription Discount Program

New Jersey Senior Gold

Age 65+
General NJ resident, enrolled in Medicare Part D or eligible.
Income Limits (2025) ~$42,142-$52,142/year (individual), ~$49,209-$59,209/year (couple).
Asset Limits Not assessed.
NJ

Copays $15 + 50% of remaining cost; no premium assistance.

Benefits
Prescription cost reduction (~$300-$800/year savings)

Medicare Savings Program (MSP)

New Jersey Medicare Savings Program

Age 65+ or disabled
General NJ resident, Medicare Part A/B.
Income Limits (2025) ~$2,510/month (QMB), ~$3,380/month (SLMB), ~$3,598/month (QI)—individual.
Asset Limits $9,430 (individual), $14,130 (couple).
NJ

Three tiers; no waitlist; includes Extra Help for Part D.

Benefits
Covers Part B premiums ($174.70/month) Deductibles ($240/year) Copays (~20%)

Senior Freeze (Property Tax Reimbursement)

New Jersey Senior Freeze

Age 65+ by Dec 31 prior year
General NJ resident, homeowner, paid property taxes.
Income Limits (2025) ~$150,000/year combined household, projected
Asset Limits Not assessed; home ownership required.
NJ

Combines with ANCHOR/Stay NJ via PAS-1; annual application.

Benefits
Tax reimbursement (~$500-$2,000/year) for increases since base year

ANCHOR (Affordable NJ Communities for Homeowners and Renters)

New Jersey ANCHOR

Age 65+ prioritized
General NJ resident, homeowner/renter, paid property taxes/rent.
Income Limits (2025) ~$150,000/year (homeowners), ~$75,000/year (renters).
Asset Limits Not assessed.
NJ

Combines with Senior Freeze/Stay NJ; broader than prior Homestead program.

Benefits
Tax relief (~$700-$1,500/year homeowners, ~$250-$450 renters)

Stay NJ

New Jersey Stay NJ

Age 65+ by Dec 31 prior year
General NJ resident, homeowner, lived in home 10+ years.
Income Limits (2025) ~$500,000/year projected, subject to final regs
Asset Limits Not assessed; home ownership required.
NJ

Up to 50% tax credit (max $6,500); phased implementation.

Benefits
Tax credit (~$3,000-$6,500/year, projected) starting 2026

Universal Service Fund (USF)

New Jersey Universal Service Fund

Age 65+ prioritized
General NJ resident, utility customer, low-income.
Income Limits (2025) ~$3,970/month individual, 185% FPL
Asset Limits Not assessed; income-focused.
NJ

Must owe >$25 on bill; combines with LIHEAP if eligible.

Benefits
Bill credits (~$300-$1,500/year) to cap energy costs at 6% of income

NJ Family Caregiver Support Program (via NFCSP)

New Jersey Family Caregiver Support Program

Age
General Caregivers of 60+ needing care or 55+ caregivers of others; NJ resident; functional needs (2+ ADLs).
Income Limits (2025) Prioritizes ~$24,980/year (individual); no strict cap.
Asset Limits Not assessed; need-based.
NJ

21 AAAs; rural/low-income priority.

Benefits
Respite (4-6 hours/week or 5 days/year) Adult day care ($60/day) Training Supplies (~$500/year)

VA Aid and Attendance (A&A) and Housebound Benefits

New Jersey VA Aid and Attendance/Housebound

Age 65+ or disabled veteran/spouse
General NJ resident, wartime service, need for ADL help (A&A) or homebound.
Income Limits (2025) Net income < ~$1,984/month (veteran with dependent, A&A); pension offsets income.
Asset Limits ~$155,356 net worth limit
NJ

High veteran demand in urban/rural areas.

Benefits
Cash (~$1,433-$2,642/month veteran, ~$951-$1,318 spouse) for care costs (e.g., in-home, assisted living)

Frequently Asked Questions about ProMedica Skilled Nursing And Rehabilitation (Voorhees)

Is ProMedica Skilled Nursing And Rehabilitation (Voorhees) in a walkable area?

ProMedica Skilled Nursing And Rehabilitation (Voorhees) has a walk score of 41. Somewhat walkable. A few nearby services may be reachable on foot, but most trips require transportation.

What is the occupancy rate at ProMedica Skilled Nursing And Rehabilitation (Voorhees)?

ProMedica Skilled Nursing And Rehabilitation (Voorhees)'s occupancy is 76.5%.

Does ProMedica Skilled Nursing And Rehabilitation (Voorhees) operate as a for-profit or non-profit?

ProMedica Skilled Nursing And Rehabilitation (Voorhees) is registered as a for-profit.

Are there photos of ProMedica Skilled Nursing And Rehabilitation (Voorhees)?

Yes — there are 8 photos of ProMedica Skilled Nursing And Rehabilitation (Voorhees) in the photo gallery on this page.

What is the address of ProMedica Skilled Nursing And Rehabilitation (Voorhees)?

ProMedica Skilled Nursing And Rehabilitation (Voorhees) is located at 113 Nj-73, Voorhees Township, NJ 08043.

What is the phone number of ProMedica Skilled Nursing And Rehabilitation (Voorhees)?

(856) 809-3500 will put you in contact with the team at ProMedica Skilled Nursing And Rehabilitation (Voorhees).

Is ProMedica Skilled Nursing And Rehabilitation (Voorhees) Medicare or Medicaid certified?

Yes — ProMedica Skilled Nursing And Rehabilitation (Voorhees) is a CMS-certified provider of Medicare and Medicaid.

Guides for Better Senior Living

Care Cost Calculator: See Prices in Your Area

Nursing Home Data Explorer

Don’t Wait Too Long: 7 Red Flag Signs Your Parent Needs Assisted Living Now

The True Cost of Assisted Living in 2025 – And How Families Are Paying For It

Understanding Senior Living Costs: Pricing Models, Discounts & Financial Assistance