


Promenade Commons
Promenade Commons
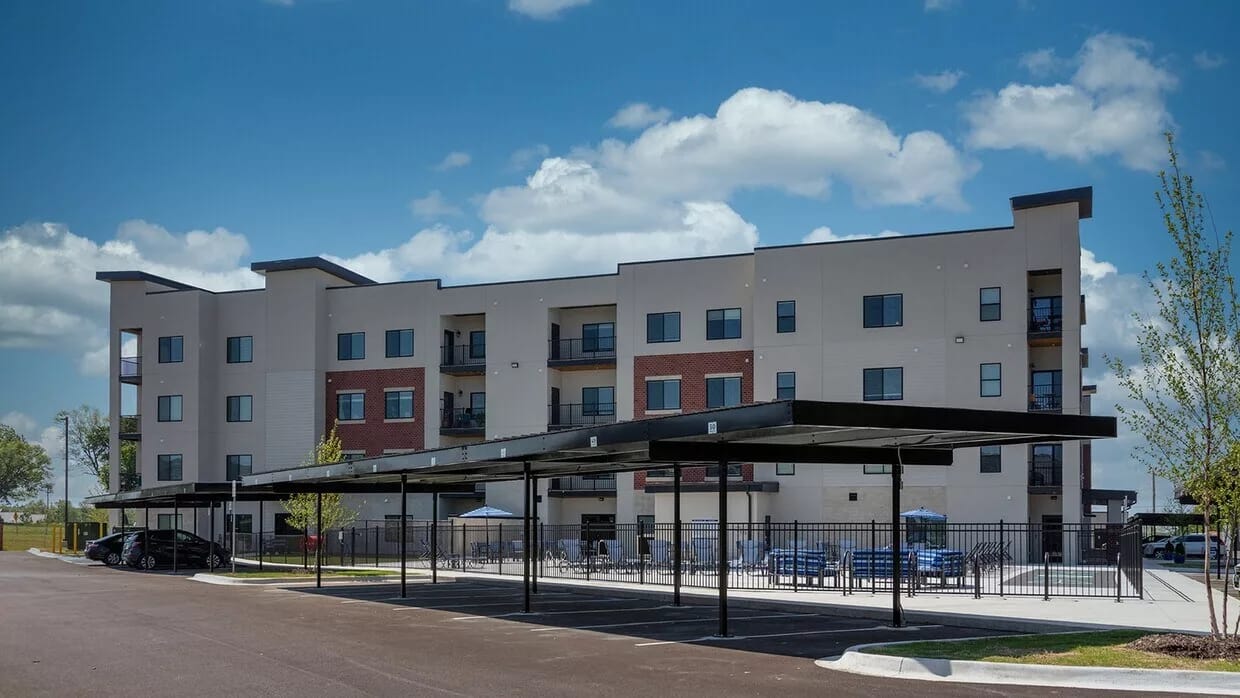
Overview of Promenade Commons
Ideally positioned on Promenade Boulevard in Rogers, Arkansas, Promenade Commons is a modern, welcoming 55+ independent living community. Within the Promenade Commons, senior residents can immerse themselves in a vibrant culture of togetherness and enjoy many amenities designed to enhance their senior living experience.
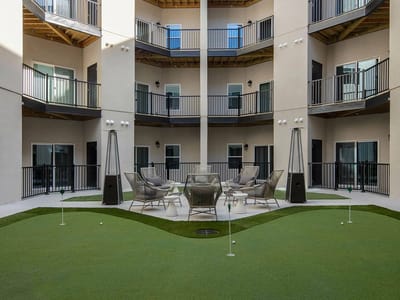
Senior residents of Promenade Commons get access to a fully-equipped fitness center, a dog park, a hot tub, a saltwater pool, and so much more. Along the renowned Razorback Trail, their strategic location offers effortless access to shopping, delightful dining options, and outdoor walking opportunities. Experience a fulfilling and active lifestyle in the heart of Rogers, Arkansas, with Promenade Commons as your welcoming and modern 55+ community.
Walk Score: 28 / 100 Rank #246 / 416Walk Score — State benchmarkedThis home is ranked 246th out of 416 homes in Arkansas for Walk Score. Shows how walkable this facility's neighborhood is compared to the average Walk Score across Arkansas facilities. Higher scores benefit residents, families, and staff.Facilities with the same value for a metric share the same rank. Rankings are based only on facilities in Arkansas that report data for that category. Facilities without available data are excluded from the ranking.Click the rank badge to see the full State ranking.Click here to see the full State ranking.
Somewhat walkable. A few nearby services may be reachable on foot, but most trips require transportation.
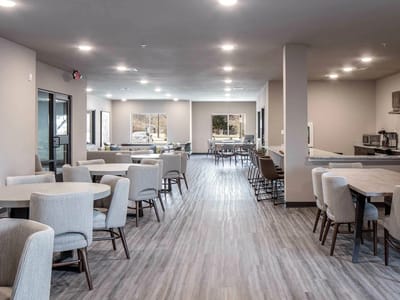
Community Amenities
Touring HoursMonday: 9 AM to 5 PM, Tuesday: 9 AM to 6 PM, Wednesday: 9 AM to 6 PM, Thursday: 9 AM to 7:30 PM, Friday: 9 AM to 5 PM, Saturday: 10 AM to 5 PM, Sunday: Closed
What does this home offer?
Minimum Age: 55 Years Old
Pets Allowed
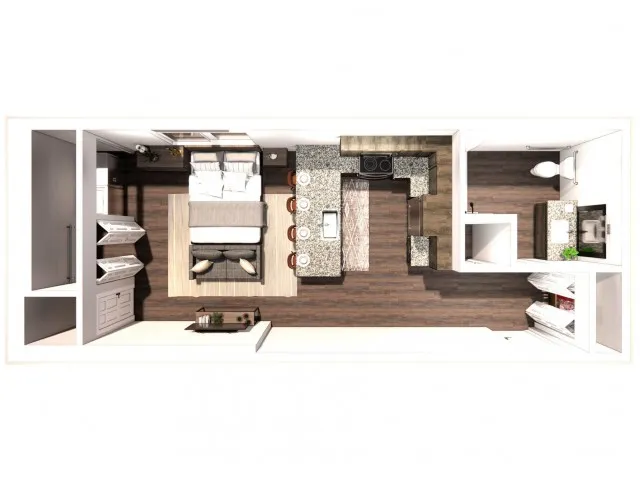
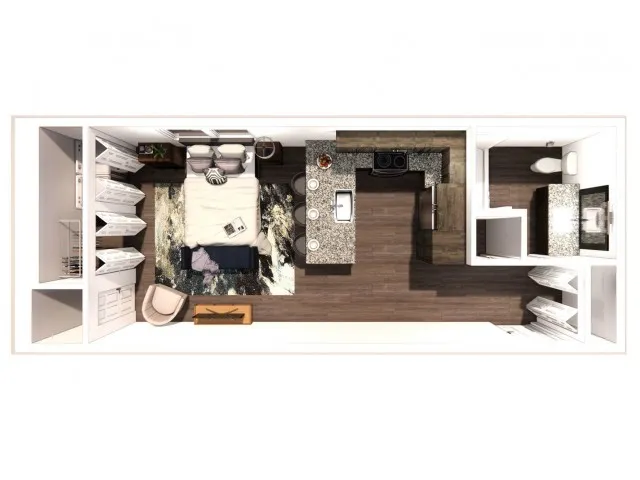
Housing Options: Studio / 1 Bed / 2 Bed / 3 Bed
Building Type: Mid-rise
Transportation Services
Fitness and Recreation
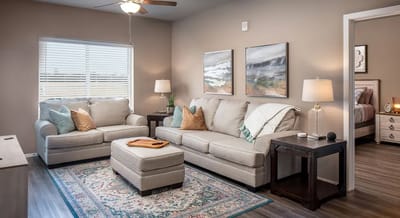
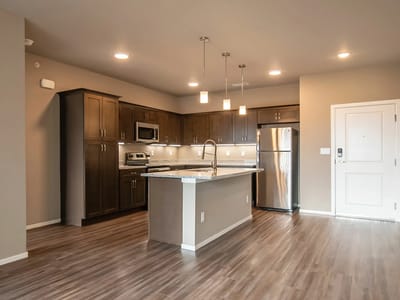
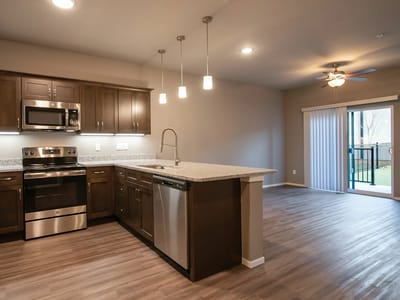
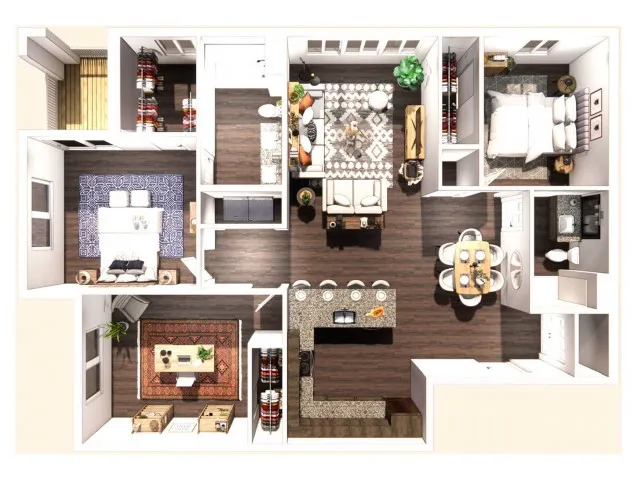
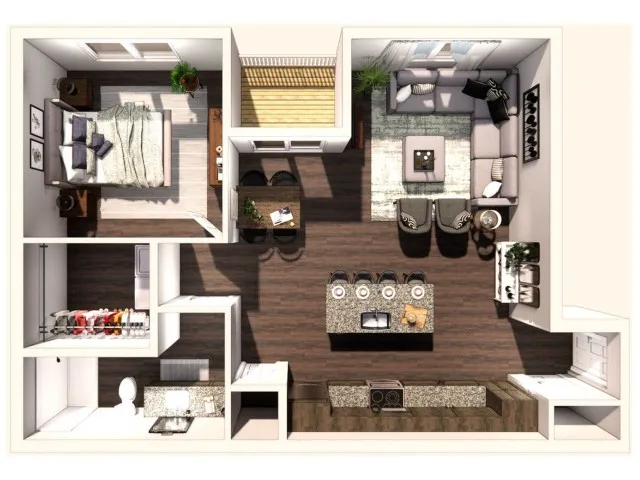
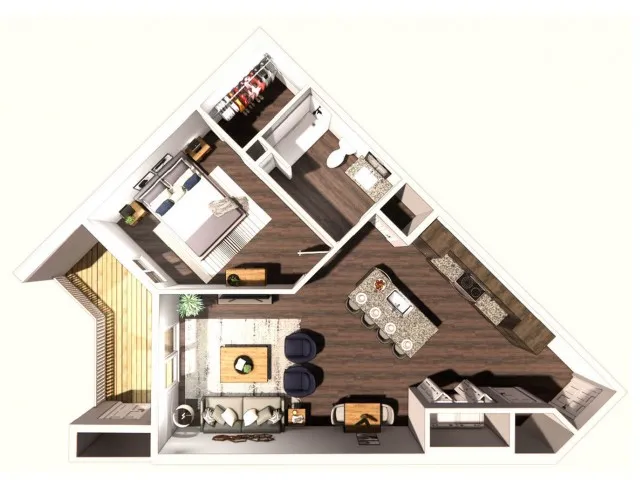
Living Spaces & Floor Plans for Promenade Commons
Places of interest near Promenade Commons
![]() 3.0 miles from city center
3.0 miles from city center
![]() Estimated distance in miles from Rogers's city center to Promenade Commons's address, calculated via Google Maps.
— 1.03 miles to nearest hospital (Northwest Medical Center - Bentonville)
Estimated distance in miles from Rogers's city center to Promenade Commons's address, calculated via Google Maps.
— 1.03 miles to nearest hospital (Northwest Medical Center - Bentonville)
Calculate Travel Distance to Promenade Commons
Add your location
Compare Independent Living around Holiday Island
| Promenade Commons | IL | Rogers | -
Facility
-
AR AVG
84
Rank
#87 / 331 | Yes |
28
Facility
28
AR AVG
34
Rank
#246 / 416 | Studio / 1 Bed / 2 Bed / 3 Bed |
| Primrose Retirement Community of Rogers | IL AL MC RC | Rogers | - | Yes |
32
Facility
32
AR AVG
34
Rank
#218 / 416 | Studio / 1 Bed / 2 Bed |
| The Meadows Independent & Assisted Living Community | IL AL | Bentonville | - | Yes |
29
Facility
29
AR AVG
34
Rank
#238 / 416 | Studio / 1 Bed / 2 Bed |
Financial Assistance for
Independent Living in Arkansas
Promenade Commons is located in Rogers, Arkansas.
Here are the financial assistance programs available to residents in Arkansas.
Frequently Asked Questions about Promenade Commons
Is Promenade Commons in a walkable area?
Promenade Commons has a walk score of 28. Somewhat walkable. A few nearby services may be reachable on foot, but most trips require transportation.
Are there photos of Promenade Commons?
Yes — there are 6 photos of Promenade Commons in the photo gallery on this page.
What is the address of Promenade Commons?
Promenade Commons is located at 750 S Promenade Blvd, Rogers, AR 72758.
What is the phone number of Promenade Commons?
(479) 335-1075 will put you in contact with the team at Promenade Commons.
Does Promenade Commons provide medical or personal care assistance?
No — Promenade Commons is an independent living community. Residents live on their own in private apartments with access to amenities, dining, and social activities.
Guides for Better Senior Living
Updated on
