Redlands Healthcare Center

Care Home
Overview of Redlands Healthcare Center

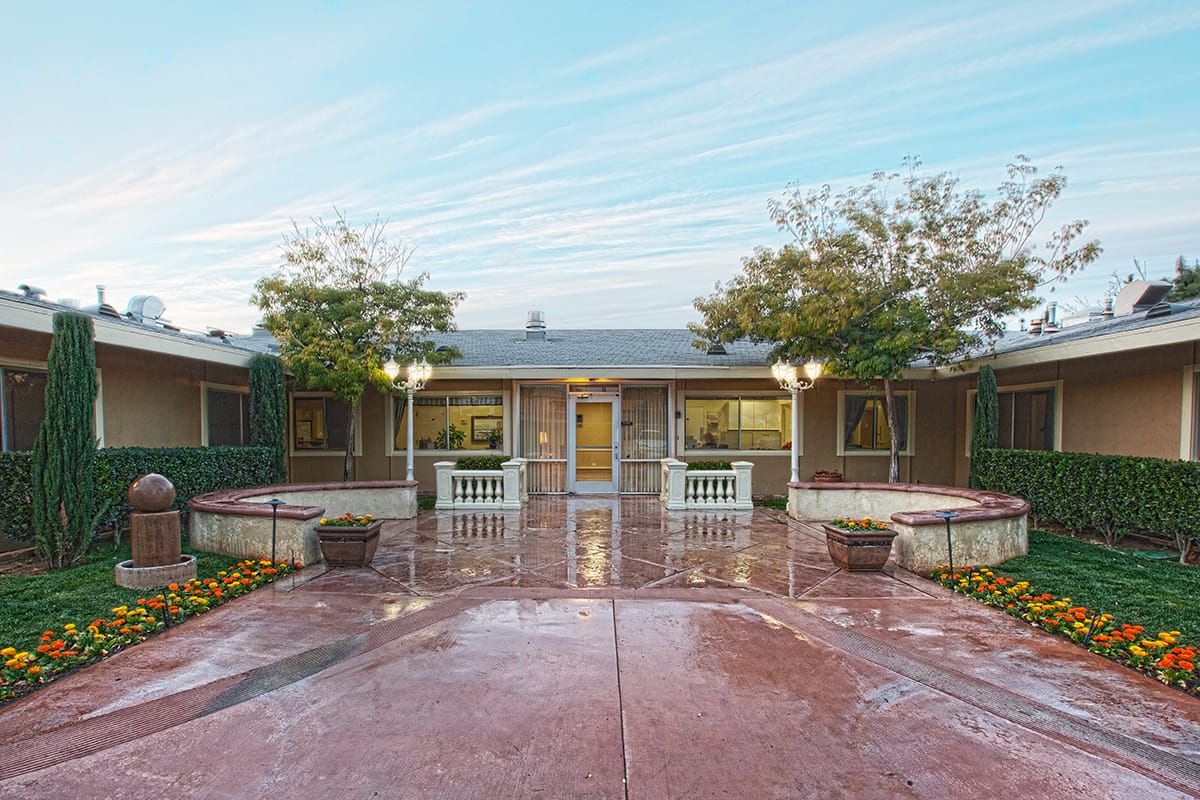
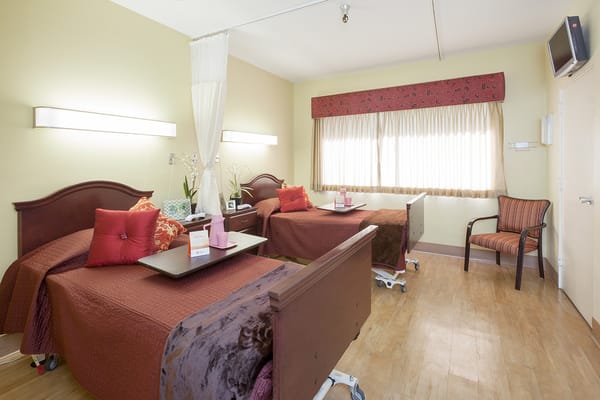
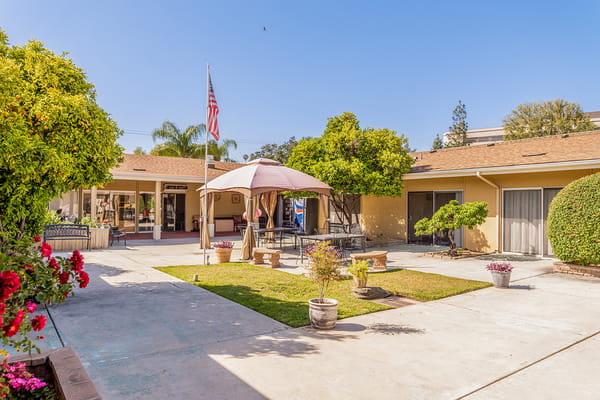
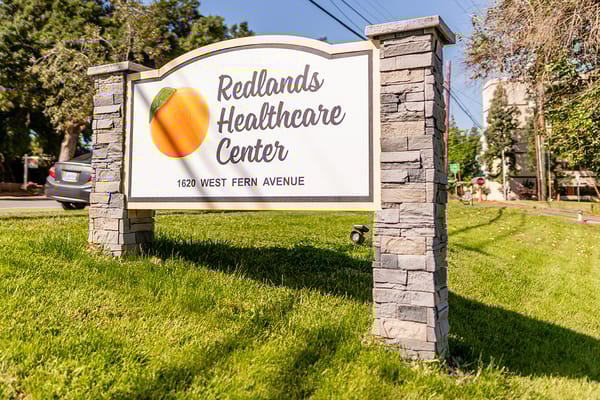
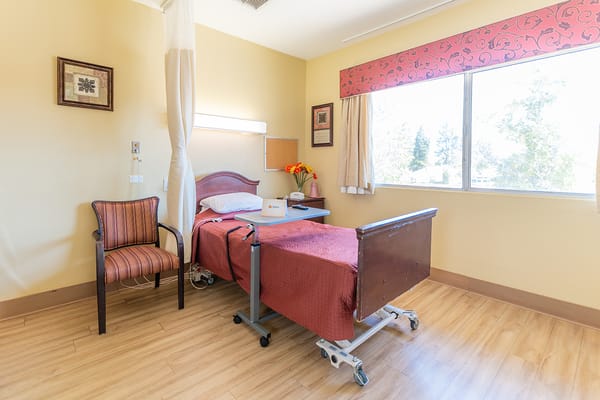
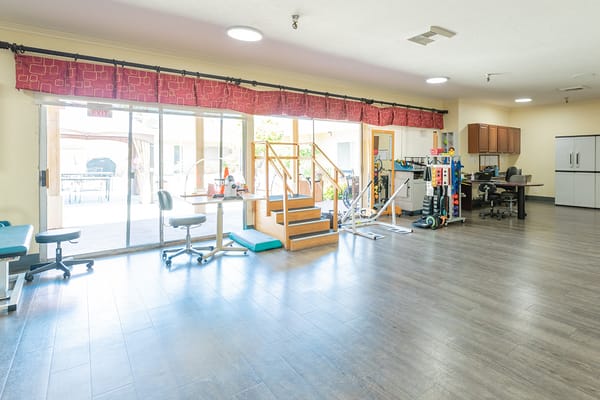
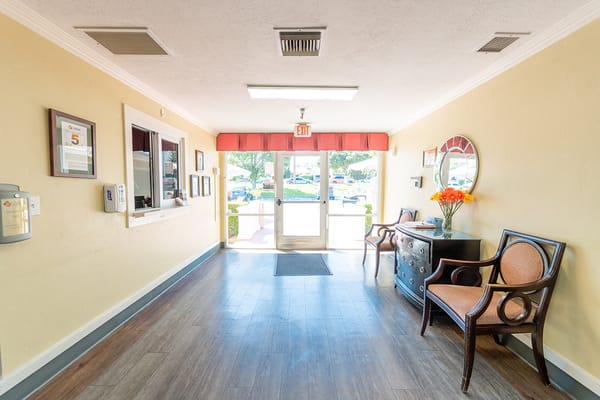
Ideally situated near Redlands Community Hospital on West Fern Avenue, Redlands, CA, Redlands Healthcare Center is a distinct community that offers therapy and restorative nursing programs. Committed to improving residents’ well-being, the community provides exceptional care and support 24/7 for their comfort and convenience. Alongside a cozy and nurturing environment, beautifully designed and spacious accommodations are also provided so residents can easily adapt to their surroundings.

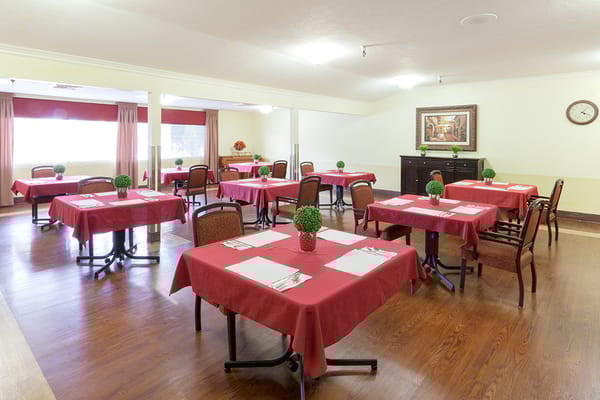
Fun activities and enriching programs are also conducted to keep residents active and socially engaged. Healthy meals are important for residents’ wellness, so delightful and nutritious meals are served to satisfy dietary needs and preferences. Find the care you need for a worry-free retirement with the community’s top-notch care and state-of-the-art amenities.

(909) 793-2609

Quality ratings

Measured by Centers for Medicare & Medicaid Services (CMS)

Overall rating Info Official CMS rating based on health inspections, staffing and quality measures.
5/5
California average: 3.1/5
Health Inspection Info Official CMS rating based on deficiencies found during state health inspections.
5/5
California average: 2.8/5
Staffing Info Official CMS rating based on nurse staffing hours per resident per day.
2/5
California average: 3.1/5
Quality Measures Info Official CMS rating based on clinical outcomes for residents.
4/5
California average: 4.1/5

Nursing care per resident

Info Average daily nursing hours per resident (adjusted for acuity). Higher values indicate more nursing time per resident.
3h 6m per day

This home provides 26% less nursing time per resident than the state average.

California average: 4h 13m per day

Staffing hours breakdown

Info Hours of care per resident per day, broken down by staff type. Data from CMS Medicare.
Staff type Facility State avg National avg
Registered Nurse (RN) Info Registered nurse hours per resident per day. 23m per day 39m per day 41m per day
LPN / LVN Info Licensed Practical Nurse / Licensed Vocational Nurse hours per resident per day. 1h 14m per day 1h 13m per day 52m per day
Nurse Aide Info Nurse aide hours per resident per day. 2h 36m per day 2h 39m per day 2h 21m per day
Total Nursing (Weekend) Info Total number of nurse staff hours per resident per day on weekends. 3h 48m per day 4h 5m per day 3h 26m per day
Physical Therapist Info Physical therapist staff hours per resident per day. 8m per day 5m per day 4m per day
RN (Weekend) Info Registered nurse hours per resident per day on weekends. 14m per day 30m per day 29m per day

Capacity and availability

Smaller home

May offer a more intimate, personalized care environment.

Total beds 78

This home usually has limited availability

Occupancy is moderate, suggesting balanced demand.

Similar demand to the California average
Occupancy rate 94.6%
Residents per day (avg) 75
Occupancy rate
94.6%
Residents per day (avg)
75

Who this home usually serves

TYPE OF STAY

Mix of rehab and long-term care

This home supports both short-term rehab and long-term care, with residents staying for a wide range of durations.

Breakdown by payment type

Medicare

45% of new residents, usually for short-term rehab.

Typical stay 2 - 3 months

Private pay

54% of new residents, often for short stays.

Typical stay 2 - 3 months

Medicaid

1% of new residents, often for long-term daily care.

Typical stay 9 - 10 months

Finances and operations

Proprietary home
Partnership
Home revenue
$17.6M
Profit
$3.3M
Proprietary home Partnership
Home revenue
$17,555,504.00
Profit
$3,261,803.00
Payroll costs Info The portion of the home's budget spent on staff, including nurses, caregivers, and other employees who support care and operations.
$5.8M
33.3% of revenue
Other operating costs Info All remaining costs needed to run the home, such as food, utilities, building maintenance, supplies and administrative expenses.
$8.5M
Total costs $14.3M

What does this home offer?

Housing options icon

Housing Options: Private / Shared Rooms

Building type icon
Building type icon

Building Type: Single-story

Dining services icon

Dining Services

Beauty services icon

Beauty Services

Transportation services icon

Transportation Services

Housekeeping icon
Housekeeping icon

Housekeeping Services

Recreational activities icon

Recreational Activities

Exercise program icon

Exercise Programs

Types of Care at Redlands Healthcare Center

Nursing Home
Contact Redlands Healthcare Center

Compare Care Homes around San Bernardino County

The information below is reported by the California Department of Social Services and Department of Public Health.
Redlands Healthcare Center
CH

Care Homes

SNF

Nursing Homes 24/7 care needed

Redlands (South Redlands)
78
No
26
BAI, SHUANG
94.6%
$17,546,957.00
$5,840,292.00
33.3%
74.90
5/5
3.1075
5/5
2/5
4/5
17
-54%
-26%
+12%
Private / Shared Rooms
Cassandra’s Care Home Inc.
CH

Care Homes

Rancho Cucamonga
6
Yes
32
CASSANDRA'S CARE HOME, INC.
66.7%
-
-
-
-
-
-
-
-
-
-
-
-
-21%
Private / Shared Rooms
Hope Home Assisted Living Facility
AL

Assisted Living For seniors needing help with daily tasks but not full-time nursing.

CH

Care Homes

Diamond Bar
6
No
53
KIM, JUNG HYUN
100.0%
-
-
-
-
-
-
-
-
-
-
-
-
+18%
Private / Shared Rooms
Rose Valley Redlands Residential Care Facility For The Elderly
CH

Care Homes

Redlands (South Redlands)
6
No
32
3P PROPERTY II LLC
100.0%
-
-
-
-
-
-
-
-
-
-
-
-
+18%
Private Rooms

Places of interest near Redlands Healthcare Center

Address 2.1 miles from city center

Address 1620 W Fern Ave, Redlands, CA 92373

Calculate Travel Distance to Redlands Healthcare Center

Add your location

Address

Staffing Data

Source: CMS Payroll-Based Journal (Q2 2025)

129
Total Staff
129
Employees
0
Contractors
34,416
Total Hours (Quarter)
51
Avg Staff/Day
7.4
Avg Shift (hrs)
Nursing Staff Breakdown
Role Count Avg Shift (hrs) Uses Contractors?
Registered Nurse58.1 No
Licensed Practical Nurse227.7 No
Certified Nursing Assistant657.4 No
Staff by Category
Administration
1 staff
4hs shift avg
Nursing Staff
95 staff
7.5hs shift avg
Physicians & Practitioners
2 staff
8.2hs shift avg
Therapy Services
25 staff
6.5hs shift avg
Activities & Recreation
1 staff
8hs shift avg
Social Services
1 staff
3.7hs shift avg
Dietary Services
2 staff
7.8hs shift avg
Other Services
2 staff
8.6hs shift avg
Role Employees Contractors Total Staff Total Hours Days Worked % of Days Avg Shift (hrs)
Certified Nursing Assistant6506517,04791100%7.4
Licensed Practical Nurse220227,08991100%7.7
Speech Language Pathologist100101,9967684%6.9
Registered Nurse5051,57191100%8.1
Physical Therapy Aide6061,0716571%6.5
Dental Services Staff2021,0236470%8.6
RN Director of Nursing3039976875%7.7
Respiratory Therapy Technician8088357481%6
Clinical Nurse Specialist1015336470%8.3
Qualified Activities Professional1015126470%8
Nurse Practitioner1015046369%8
Other Dietary Services Staff1014906268%7.9
Dietitian1014646066%7.7
Administrator1012566470%4
Physical Therapy Assistant1011889%2.2
Qualified Social Worker1011133%3.7

Health Inspection History

Inspections
Total health inspections 4

California average 12.5


Last Health inspection on Feb 2025

Total health citations 17
Citations per inspection
4.25

Health citations are formal notices following inspections when they fail to comply with safety and care standards.

15 of 17 citations resulted from standard inspections; 1 of 17 resulted from complaint investigations; and 1 of 17 came from combined inspections (standard and complaint).

Breakdown of citation severity (last 3 years)
Critical Health citations More info 0
100% better than California average

California average: 0.4


Serious Health citations More info 0
100% better than California average

California average: 1

0 critical citations More info California average: 0.4

0 serious citations More info California average: 1

17 moderate citations More info California average: 47.2

0 minor citations More info California average: 1.5
Citations history (last 3 years)
Environmental moderate citation Feb 06, 2025
Corrected

Infection Control moderate citation Feb 06, 2025
Corrected

Quality of Care moderate citation Apr 17, 2024
Corrected

Nutrition moderate citation Feb 02, 2024
Corrected

Facility Characteristics

Source: CMS Long-Term Care Facility Characteristics (Data as of Jan 2026)

Ownership: For-Profit LLC
Resident Census by Payment Source
76 Total Residents
Medicare 30 (39.5%)
Medicaid 27 (35.5%)
Private Pay/Other 19 (25%)
Programs & Services
Residents' Group
Family Engagement

Active councils help families stay involved in care decisions and facility operations.

Quality of care over time

These measures show how residents usually do over time at this home, based on health outcomes and preventive care.

High-risk clinical events score Info A composite score based on pressure ulcers, falls with injury, weight loss, walking ability decline, and activities of daily living decline. 4.5
32% better than California average

California average: 6.6

Functional decline score Info A composite score based on activities of daily living decline, walking ability decline, and incontinence. 10.6
7% better than California average

California average: 11.3

Long-stay resident measures
Need for Help with Daily Activities Increased Info Percent of long-stay residents whose need for help with daily activities has increased 9.0%
18% better than California average

California average: 11.1%

Walking Ability Worsened Info Percent of long-stay residents whose ability to move independently worsened 8.8%
27% better than California average

California average: 12.0%

Low Risk Residents with Bowel/Bladder Incontinence Info Percent of low risk long-stay residents who lose control of their bowels or bladder 13.9%
23% worse than California average

California average: 11.3%

Falls with Major Injury Info Percent of long-stay residents experiencing one or more falls with major injury 0.6%
66% better than California average

California average: 1.7%

High Risk Residents with Pressure Ulcers Info Percent of long-stay high risk residents with pressure ulcers 3.6%
28% better than California average

California average: 5.0%

Urinary Tract Infection Info Percent of long-stay residents with a urinary tract infection 0.0%
100% better than California average

California average: 1.2%

Lost Too Much Weight Info Percent of long-stay residents who lose too much weight 0.8%
82% better than California average

California average: 4.2%

Depressive Symptoms Info Percent of long-stay residents who have depressive symptoms 32.4%
384% worse than California average

California average: 6.7%

Antipsychotic Use Info Percent of long-stay residents who received an antipsychotic medication 4.5%
56% better than California average

California average: 10.1%

Pneumococcal Vaccine Info Percent of long-stay residents assessed and appropriately given the pneumococcal vaccine 100.0%
In line with California average

California average: 98.5%

Influenza Vaccine Info Percent of long-stay residents assessed and appropriately given the seasonal influenza vaccine 100.0%
In line with California average

California average: 98.2%

Hospitalizations per 1,000 days Info Number of hospitalizations per 1,000 long-stay resident days. 2.00
11% better than California average

California average: 2.25

ED visits per 1,000 days Info Number of outpatient emergency department visits per 1,000 long-stay resident days. 2.70
70% worse than California average

California average: 1.59

Short-stay resident measures
Pneumococcal Vaccine Info Percent of short-stay residents assessed and appropriately given the pneumococcal vaccine 100.0%
6% better than California average

California average: 94.0%

Antipsychotic medication increase Info Percent of short-stay residents who newly received an antipsychotic medication 0.0%
100% better than California average

California average: 1.5%

Influenza Vaccine Info Percent of short-stay residents assessed and appropriately given the seasonal influenza vaccine 100.0%
7% better than California average

California average: 93.2%

Re-hospitalized after SNF stay Info Percentage of short-stay residents who were re-hospitalized after their nursing home admission. 20.7%
11% better than California average

California average: 23.2%

Emergency department visits Info Percentage of short-stay residents who had an outpatient emergency department visit. 16.9%
51% worse than California average

California average: 11.2%

Falls with major injury Info Percentage of SNF residents who experience falls with major injury during their stay. 0.0%
100% better than California average

California average: 0.8%

Ability to care for self at discharge Info Percentage of residents at or above expected ability to care for themselves at discharge. 17.8%
67% worse than California average

California average: 53.7%

Successful return to home or community Info Rate of successful return to home or community from a skilled nursing facility. 53.3%
5% better than California average

California average: 50.6%

Guides for Better Senior Living

Care Cost Calculator: See Prices in Your Area

Nursing Home Data Explorer

Don’t Wait Too Long: 7 Red Flag Signs Your Parent Needs Assisted Living Now

The True Cost of Assisted Living in 2025 – And How Families Are Paying For It

Understanding Senior Living Costs: Pricing Models, Discounts & Financial Assistance

Financial Aid for California Seniors

Get financial aid guidance

Multipurpose Senior Services Program

MSSP (Medi-Cal Waiver)

Age 65+, California resident, Medi-Cal eligible, nursing home risk.

~$2,829/month (300% FBR, individual).

$2,000 (individual), $3,000 (couple).

County-managed; waitlists possible.

In-Home Supportive Services (IHSS)

California IHSS

Age 65+, California resident, Medicaid-eligible or low-income.

~$1,732/month (individual, Medi-Cal threshold).

$2,000 (individual).

Can hire family as caregivers.

Multipurpose Senior Services Program (MSSP)

CA MSSP

Age 65+, California resident, Medi-Cal-eligible, nursing home-eligible but community-capable.

~$2,829/month (300% FBR, individual).

$2,000 (individual).

Available in 38 counties; waitlists common.

Property Tax Postponement Program (PTP)

CA PTP

Age 62+, California resident, own and live in home, 40% equity.

~$51,500/year (household, adjusted annually).

Equity-based; no strict asset cap.

Deferred taxes accrue interest (5% as of 2024); repaid upon sale/death.

Assisted Living Waiver (ALW)

CA ALW

Age 65+ or disabled, California resident, Medi-Cal-eligible, nursing home-eligible.

~$2,829/month (300% FBR, individual).

$2,000 (individual).

Available in 15 counties (e.g., LA, Sacramento); waitlists common.

California CARES Program

CA CARES

Caregivers of California residents 60+ needing help with 3+ daily activities; no caregiver age limit.

No strict limit; cost-sharing above ~$2,500/month threshold.

Not applicable; need-based.

High demand in urban areas; complements IHSS respite.

Low-Income Home Energy Assistance Program (LIHEAP)

CA LIHEAP

Age 60+ priority, California resident, low-income, utility/heating need.

~$2,510/month (200% of poverty level, individual).

Not applicable; income-focused.

High demand in inland/coastal extremes; weatherization capped at $5,000/home.

Who we are

Your Senior Care Partner, Every Step of the Way

We help families find affordable senior communities and unlock same day discounts, Medicaid, and Medicare options tailored to your needs.

Contact us Today
Tour Icon
Planning a tour? Check our touring checklist.
Chat Icon
Thinking of living here? We can help you speak to a current resident