Regent Park Rehabilitation and Healthcare

Nursing Home

Regent Park Rehabilitation and Healthcare

10604 E 13th St N, Wichita, KS 67206 View Map
Nursing Home
icon
Care Cost Calculator: See Prices in Your Area Care Cost Calculator: See Prices in Your Area icon
Overview of Regent Park Rehabilitation and Healthcare

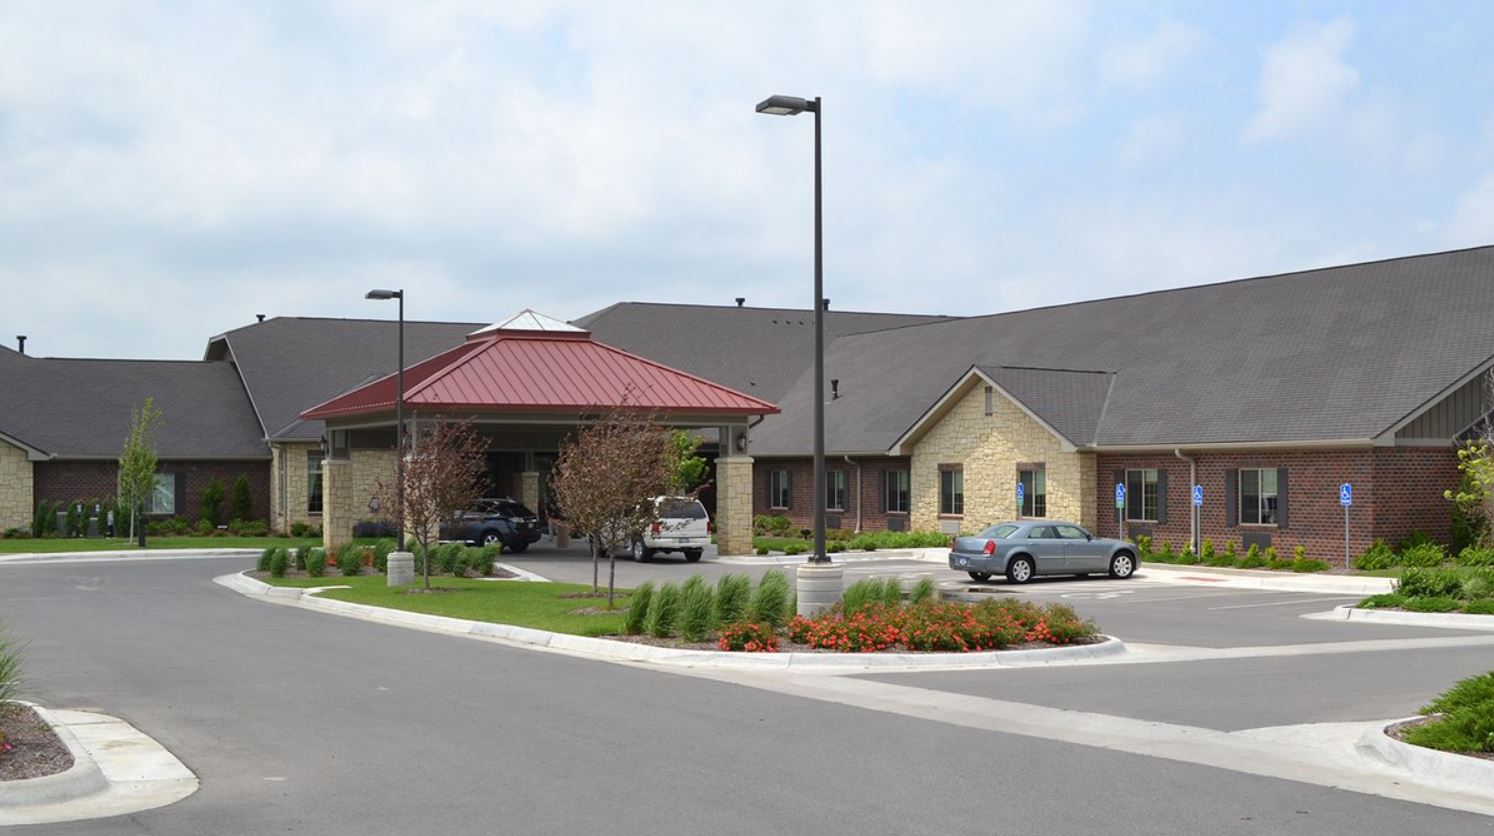
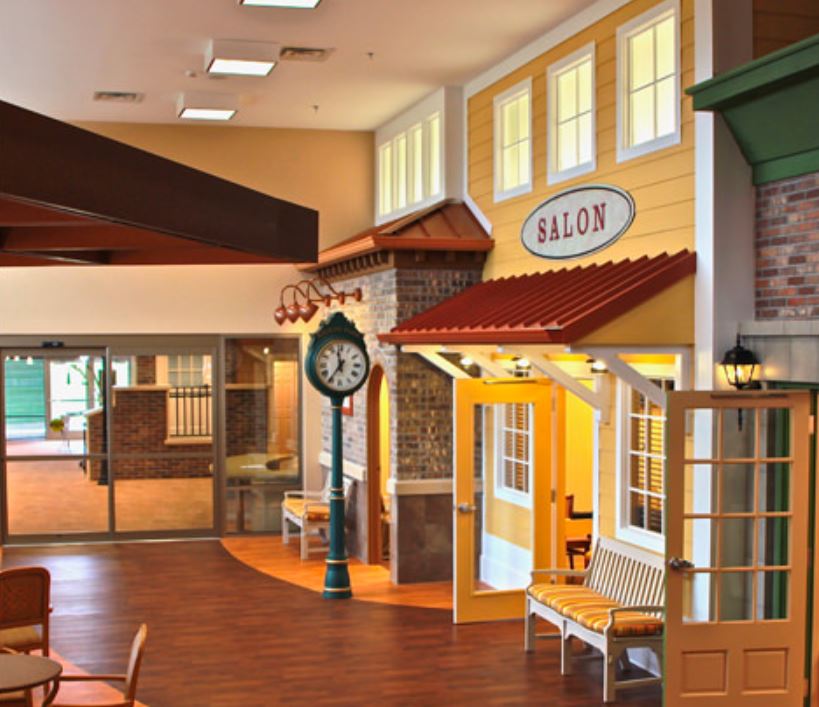
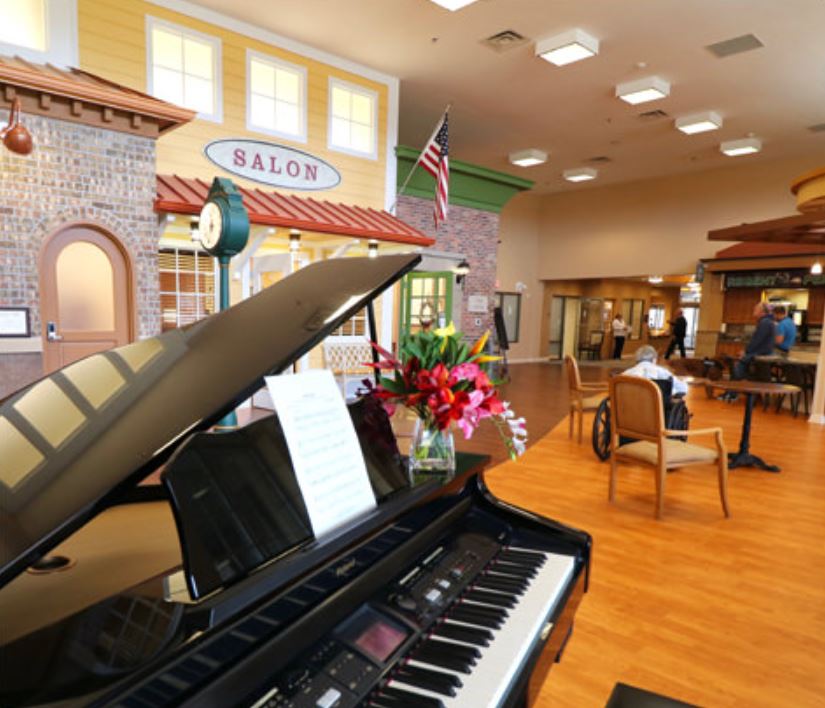
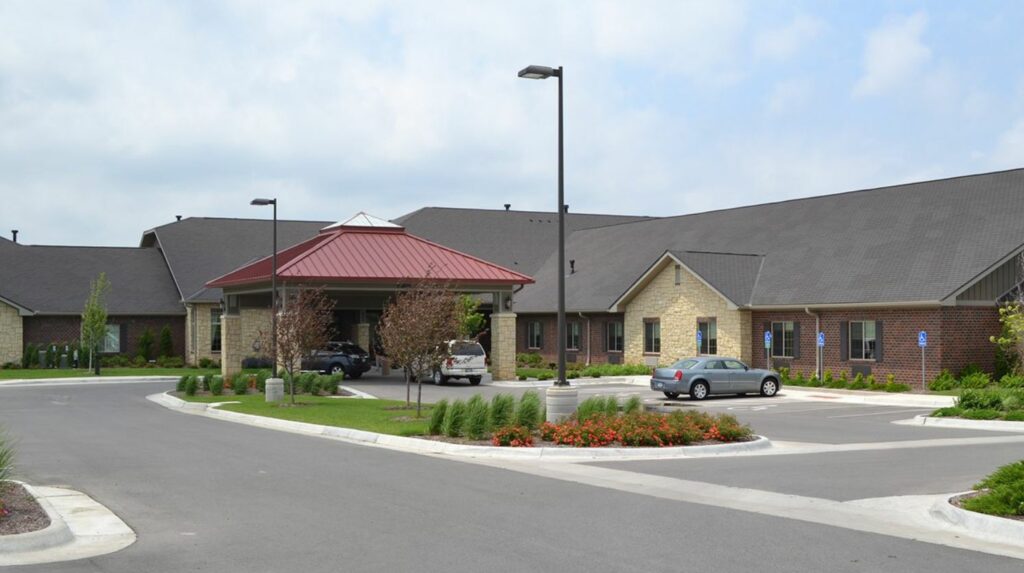
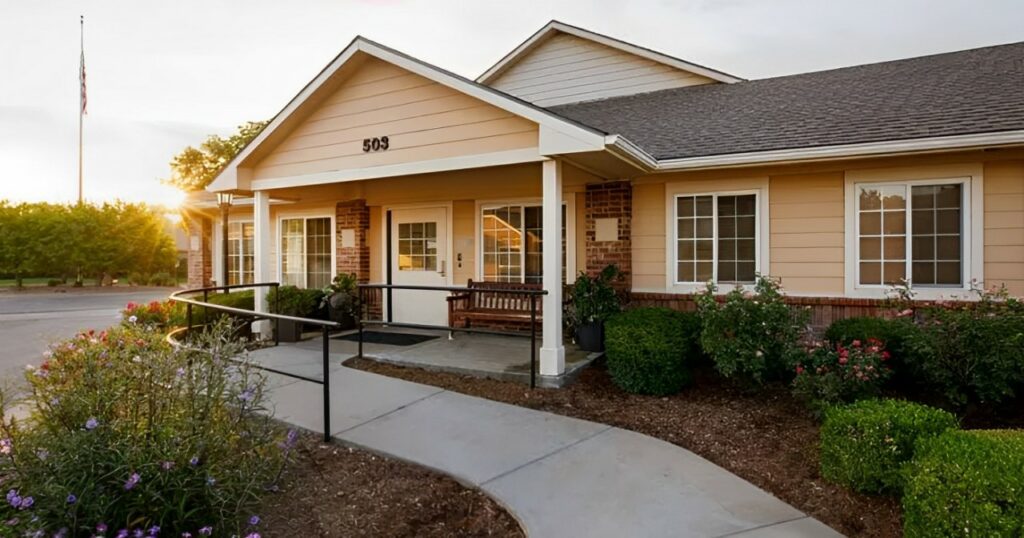
Based in the enchanting lands of Wichita, KS, Regent Park Rehabilitation and Healthcare is an astounding senior living community offering a wide array of care options including short-term and long-term, hospital care, rehabilitation, therapy, and nursing services. With cozy and welcoming private suites, residents enjoy a safe and relaxed retirement. A team of reliable and experienced professionals strives to provide the highest quality of care and assistance around the clock.

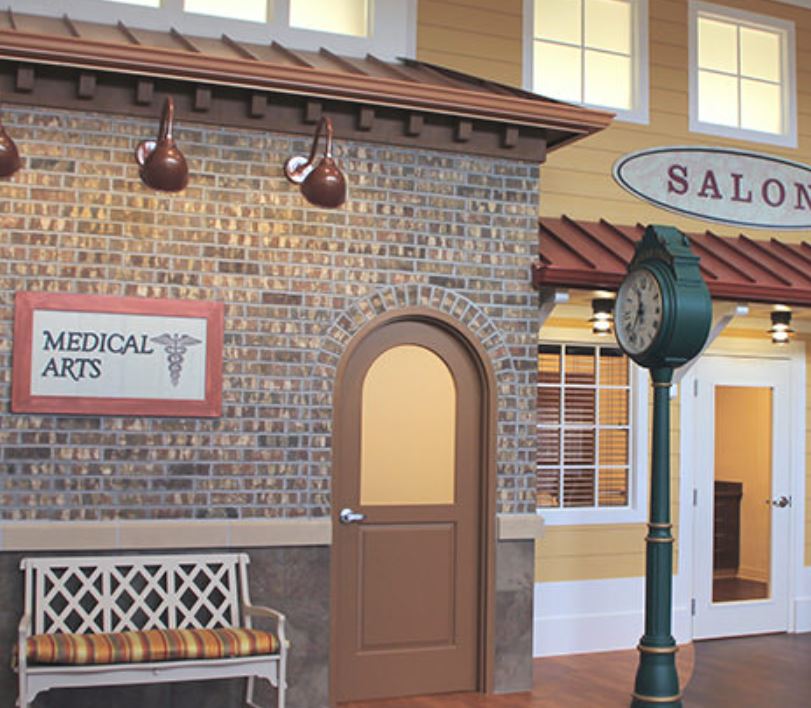
Regent Park Rehabilitation and Healthcare promotes a vibrant and welcoming environment, paving the way for seniors to flourish and experience new things. Fun activities and enjoyable events are conducted to maintain seniors’ wellness and happiness. Dining is something to anticipate with healthy and delicious meals prepared to cater to seniors’ nutritional requirements and tastes. The community’s peaceful grounds and convenient amenities ensure seniors are well-cared for.

(316) 337-5450

Quality ratings

Measured by Centers for Medicare & Medicaid Services (CMS)

Overall rating Info Official CMS rating based on health inspections, staffing and quality measures.
5/5
Kansas average: 2.9/5
Health Inspection Info Official CMS rating based on deficiencies found during state health inspections.
4/5
Kansas average: 2.8/5
Staffing Info Official CMS rating based on nurse staffing hours per resident per day.
4/5
Kansas average: 3.5/5
Quality Measures Info Official CMS rating based on clinical outcomes for residents.
5/5
Kansas average: 3.1/5

Nursing care per resident

Info Average daily nursing hours per resident (adjusted for acuity). Higher values indicate more nursing time per resident.
5h 10m per day

This home provides 12% more nursing time per resident than the state average.

Kansas average: 4h 38m per day

Staffing hours breakdown

Info Hours of care per resident per day, broken down by staff type. Data from CMS Medicare.
Staff type Facility State avg National avg
Registered Nurse (RN) Info Registered nurse hours per resident per day. 56m per day 43m per day 41m per day
LPN / LVN Info Licensed Practical Nurse / Licensed Vocational Nurse hours per resident per day. 59m per day 40m per day 52m per day
Nurse Aide Info Nurse aide hours per resident per day. 2h 45m per day 2h 42m per day 2h 21m per day
Total Nursing (Weekend) Info Total number of nurse staff hours per resident per day on weekends. 3h 55m per day 3h 35m per day 3h 26m per day
Physical Therapist Info Physical therapist staff hours per resident per day. 9m per day 2m per day 4m per day
RN (Weekend) Info Registered nurse hours per resident per day on weekends. 36m per day 29m per day 29m per day

Capacity and availability

Smaller home

May offer a more intimate, personalized care environment.

Total beds 84

This home usually has availability

Lower occupancy suggests more openings may be available.

Lower demand than the Kansas average
Occupancy rate 83.1%
Residents per day (avg) 71
Occupancy rate
83.1%
Residents per day (avg)
71

Who this home usually serves

TYPE OF STAY

Mostly short-term rehab stays

Most residents typically stay for a few weeks or months before returning home or moving on.

Might be optimal for
Short stays Recovery Medicare-covered care

Breakdown by payment type

Medicare

51% of new residents, usually for short-term rehab.

Typical stay 21 days

Private pay

48% of new residents, often for short stays.

Typical stay 1 - 2 months

Medicaid

1% of new residents, often for long-term daily care.

Typical stay 2 years

Finances and operations

Proprietary home
Corporation
Home revenue
$15.9M
Profit
$1.7M
Proprietary home Corporation
Home revenue
$15,946,120.00
Profit
$1,729,211.00
Payroll costs Info The portion of the home's budget spent on staff, including nurses, caregivers, and other employees who support care and operations.
$6.0M
37.7% of revenue
Other operating costs Info All remaining costs needed to run the home, such as food, utilities, building maintenance, supplies and administrative expenses.
$8.2M
Total costs $14.2M

What does this home offer?

Housing options icon

Housing Options: Private Rooms

Building type icon
Building type icon

Building Type: Single-story

Fitness and recreation icon

Fitness and Recreation

Types of Care at Regent Park Rehabilitation and Healthcare

Nursing Home
Contact Regent Park Rehabilitation and Healthcare

Compare Nursing Homes around Wichita

The information below is reported by the Kansas Department for Aging and Disability Services.
Regent Park Rehabilitation and Healthcare
SNF

Nursing Homes 24/7 care needed

Wichita
84
No
28
LEGEND SENIOR PROPERTIES
83.1%
$13,823,793.00
$6,019,191.00
43.5%
70.60
5/5
5.1669
4/5
4/5
5/5
-
14
-
-30%
+12%
+5%
Private Rooms
Legacy at College Hill
AL

Assisted Living For seniors needing help with daily tasks but not full-time nursing.

IL

Independent Living For self-sufficient seniors seeking community and minimal assistance.

MC

Memory Care Specialized care for those with Memory Loss, Alzheimer's, or dementia, ensuring safety and support.

SNF

Nursing Homes 24/7 care needed

Wichita (Chisholm Creek)
75
No
43
KS PORTFOLIO MASTER SNF HOLDCO, LLC
88.3%
$6,434,521.00
$2,965,205.00
46.1%
68.10
1/5
4.4423
1/5
3/5
2/5
4
71
8
-66%
-4%
+11%
Private Rooms
The Manor Skilled Nursing
SNF

Nursing Homes 24/7 care needed

Wichita
-
No
58
-
-
-
-
-
-
-
-
-
-
-
-
-
-
-
-
-
Private Rooms

Places of interest near Regent Park Rehabilitation and Healthcare

Address 9.5 miles from city center — 1.28 miles to nearest hospital (Love Deborah S)

Address 10604 E 13th St N, Wichita, KS 67206

Calculate Travel Distance to Regent Park Rehabilitation and Healthcare

Add your location

Address

Staffing Data

Source: CMS Payroll-Based Journal (Q2 2025)

169
Total Staff
166
Employees
3
Contractors
39,038
Total Hours (Quarter)
53
Avg Staff/Day
8.1
Avg Shift (hrs)
Nursing Staff Breakdown
Role Count Avg Shift (hrs) Uses Contractors?
Registered Nurse 12 8.9 No
Licensed Practical Nurse 23 9.9 No
Certified Nursing Assistant 53 8.9 No
Staff by Category
Administration
2 staff
5hs shift avg
Nursing Staff
110 staff
9hs shift avg
Physicians & Practitioners
9 staff
7.1hs shift avg
Therapy Services
30 staff
6.1hs shift avg
Activities & Recreation
0 staff
0hs shift avg
Social Services
10 staff
5.4hs shift avg
Dietary Services
7 staff
6.9hs shift avg
Other Services
1 staff
8hs shift avg
Contractor Analysis
0.5%
of total hours from contractors
197 contractor hours this quarter
Medical Director: 1 Occupational Therapy Aide: 1 Occupational Therapy Assistant: 1
Role Employees Contractors Total Staff Total Hours Days Worked % of Days Avg Shift (hrs)
Certified Nursing Assistant 53 0 53 15,977 91 100% 8.9
Licensed Practical Nurse 23 0 23 5,745 91 100% 9.9
Registered Nurse 12 0 12 3,286 91 100% 8.9
Medication Aide/Technician 16 0 16 2,227 90 99% 9.2
Clinical Nurse Specialist 8 0 8 2,016 72 79% 6.9
RN Director of Nursing 6 0 6 1,505 70 77% 7.3
Physical Therapy Assistant 6 0 6 1,128 80 88% 5.8
Physical Therapy Aide 8 0 8 1,117 79 87% 6.1
Respiratory Therapy Technician 7 0 7 1,088 81 89% 5.7
Other Dietary Services Staff 6 0 6 1,047 90 99% 6.5
Speech Language Pathologist 7 0 7 986 81 89% 6.5
Qualified Social Worker 10 0 10 909 76 84% 5.4
Nurse Practitioner 1 0 1 512 64 70% 8
Mental Health Service Worker 1 0 1 512 64 70% 8
Dietitian 1 0 1 480 60 66% 8
Administrator 1 0 1 308 52 57% 5.9
Occupational Therapy Aide 0 1 1 160 13 14% 12.3
Occupational Therapy Assistant 0 1 1 22 7 8% 3.1
Medical Director 0 1 1 15 12 13% 1.3

Health Inspection History

Inspections
Total health inspections 3

Kansas average 4.5


Last Health inspection on Jul 2025

Total health citations 14
Citations per inspection
4.67

Health citations are formal notices following inspections when they fail to comply with safety and care standards.

3 of 14 citations resulted from standard inspections; 1 of 14 resulted from complaint investigations; and 10 of 14 came from combined inspections (standard and complaint).

Breakdown of citation severity (last 3 years)
Critical Health citations More info 0
100% better than Kansas average

Kansas average: 0.9


Serious Health citations More info 0
100% better than Kansas average

Kansas average: 0.9

0 critical citations More info Kansas average: 0.9

0 serious citations More info Kansas average: 0.9

13 moderate citations More info Kansas average: 24.6

1 minor citation More info Kansas average: 0.5
Citations history (last 3 years)
Quality of Care moderate citation Jul 07, 2025
Corrected

Administration moderate citation Apr 10, 2024
Corrected

Environmental moderate citation Apr 10, 2024
Corrected

Nursing Services minor citation Apr 10, 2024
Corrected

Facility Characteristics

Source: CMS Long-Term Care Facility Characteristics (Data as of Jan 2026)

Ownership: For-Profit Corporation
Resident Census by Payment Source
68 Total Residents
Medicare 32 (47.1%)
Medicaid 15 (22.1%)
Private Pay/Other 21 (30.9%)
Programs & Services
Residents' Group
CCRC
Family Engagement

Active councils help families stay involved in care decisions and facility operations.

Quality of care over time

These measures show how residents usually do over time at this home, based on health outcomes and preventive care.

High-risk clinical events score Info A composite score based on pressure ulcers, falls with injury, weight loss, walking ability decline, and activities of daily living decline. 6.9
34% better than Kansas average

Kansas average: 10.5

Functional decline score Info A composite score based on activities of daily living decline, walking ability decline, and incontinence. 15.9
23% better than Kansas average

Kansas average: 20.7

Long-stay resident measures
Need for Help with Daily Activities Increased Info Percent of long-stay residents whose need for help with daily activities has increased 14.7%
23% better than Kansas average

Kansas average: 19.0%

Walking Ability Worsened Info Percent of long-stay residents whose ability to move independently worsened 9.1%
53% better than Kansas average

Kansas average: 19.4%

Low Risk Residents with Bowel/Bladder Incontinence Info Percent of low risk long-stay residents who lose control of their bowels or bladder 23.7%
In line with Kansas average

Kansas average: 23.8%

Falls with Major Injury Info Percent of long-stay residents experiencing one or more falls with major injury 3.0%
31% better than Kansas average

Kansas average: 4.4%

High Risk Residents with Pressure Ulcers Info Percent of long-stay high risk residents with pressure ulcers 3.0%
36% better than Kansas average

Kansas average: 4.6%

Urinary Tract Infection Info Percent of long-stay residents with a urinary tract infection 3.1%
In line with Kansas average

Kansas average: 3.1%

Lost Too Much Weight Info Percent of long-stay residents who lose too much weight 4.7%
8% better than Kansas average

Kansas average: 5.1%

Depressive Symptoms Info Percent of long-stay residents who have depressive symptoms 6.4%
24% worse than Kansas average

Kansas average: 5.2%

Antipsychotic Use Info Percent of long-stay residents who received an antipsychotic medication 6.4%
62% better than Kansas average

Kansas average: 16.9%

Pneumococcal Vaccine Info Percent of long-stay residents assessed and appropriately given the pneumococcal vaccine 100.0%
9% better than Kansas average

Kansas average: 91.9%

Influenza Vaccine Info Percent of long-stay residents assessed and appropriately given the seasonal influenza vaccine 100.0%
5% better than Kansas average

Kansas average: 95.5%

Hospitalizations per 1,000 days Info Number of hospitalizations per 1,000 long-stay resident days. 1.57
15% better than Kansas average

Kansas average: 1.84

ED visits per 1,000 days Info Number of outpatient emergency department visits per 1,000 long-stay resident days. 0.71
67% better than Kansas average

Kansas average: 2.16

Short-stay resident measures
Pneumococcal Vaccine Info Percent of short-stay residents assessed and appropriately given the pneumococcal vaccine 99.4%
31% better than Kansas average

Kansas average: 75.6%

Antipsychotic medication increase Info Percent of short-stay residents who newly received an antipsychotic medication 0.5%
78% better than Kansas average

Kansas average: 2.2%

Influenza Vaccine Info Percent of short-stay residents assessed and appropriately given the seasonal influenza vaccine 91.5%
24% better than Kansas average

Kansas average: 73.5%

Re-hospitalized after SNF stay Info Percentage of short-stay residents who were re-hospitalized after their nursing home admission. 21.0%
9% better than Kansas average

Kansas average: 23.0%

Emergency department visits Info Percentage of short-stay residents who had an outpatient emergency department visit. 7.3%
38% better than Kansas average

Kansas average: 11.7%

Falls with major injury Info Percentage of SNF residents who experience falls with major injury during their stay. 0.2%
70% better than Kansas average

Kansas average: 0.8%

Ability to care for self at discharge Info Percentage of residents at or above expected ability to care for themselves at discharge. 59.9%
12% better than Kansas average

Kansas average: 53.7%

Successful return to home or community Info Rate of successful return to home or community from a skilled nursing facility. 58.0%
15% better than Kansas average

Kansas average: 50.6%

Guides for Better Senior Living

Care Cost Calculator: See Prices in Your Area

Nursing Home Data Explorer

Don’t Wait Too Long: 7 Red Flag Signs Your Parent Needs Assisted Living Now

The True Cost of Assisted Living in 2025 – And How Families Are Paying For It

Understanding Senior Living Costs: Pricing Models, Discounts & Financial Assistance

Financial Aid for Kansas Seniors

Get financial aid guidance

Frail Elderly Waiver

Kansas Medicaid FE Waiver

Age 65+, Kansas resident, Medicaid-eligible, nursing home- level care need.

~$2,829/month (300% FBR, individual).

$2,000 (individual), $3,000 (couple).

Requires care level assessment.

Senior Care Act

Kansas SCA

Age 60+, Kansas resident, at risk of nursing home.

~$1,800/month (individual, varies).

$2,000 (individual).

Limited funding; waitlists common.

Medicare Savings Program (MSP)

Kansas Medicare Savings Program

Age 65+ or disabled, Kansas resident, Medicare Part A/B.

~$2,510/month (QMB), ~$3,380/month (SLMB), ~$3,598/month (QI)—individual.

$9,430 (individual), $14,130 (couple).

Three tiers; no waitlist.

National Family Caregiver Support Program (NFCSP) Respite

Kansas NFCSP Respite Care

Caregivers of 60+ needing care or 55+ caregivers of others; Kansas resident; functional needs (2+ ADLs).

Prioritizes ~$24,980/year (individual); no strict cap.

Not assessed; need-based.

11 AAAs; prioritizes low-income, rural caregivers.

Senior Community Service Employment Program (SCSEP)

Kansas SCSEP

Age 55+, unemployed, low-income, Kansas resident.

~$1,983/month (125% FPL).

Not specified; income-focused.

Priority for veterans, rural residents.

VA Aid and Attendance (A&A) and Housebound Benefits

Kansas VA Aid and Attendance/Housebound

Age 65+ or disabled veteran/spouse, Kansas resident, wartime service, need for ADL help (A&A) or homebound.

Net income < ~$1,984/month (veteran with dependent, A&A); pension offsets income.

~$155,356 (net worth limit).

High veteran demand in rural/urban areas.

Who we are

Your Senior Care Partner, Every Step of the Way

We help families find affordable senior communities and unlock same day discounts, Medicaid, and Medicare options tailored to your needs.

Contact us Today