Explore Open Rooms
1 Contact details
2 What type of senior care service are you looking for?
3 What budget do you have in mind for senior care?
4 How soon do you need to find care?
5 Additional details

Thank you for your interest!

Our team will be in touch shortly to help with next steps.

Nursing Home in Jefferson City

CMS overall rating Info The Overall CMS Rating combines results from health inspections, staffing levels and quality measures. Health inspections carry the most weight. Staffing and quality scores can increase or decrease the final rating based on performance compared to state and national standards.

River City Living Community

Overview of River City Living Community

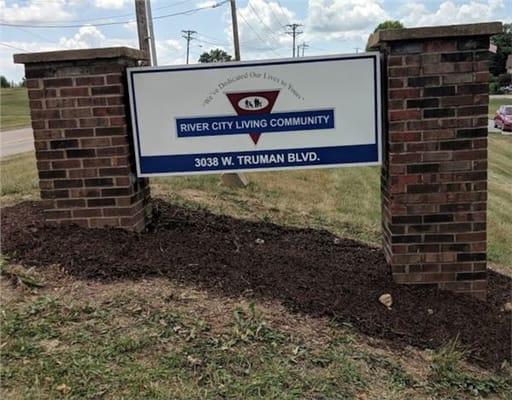
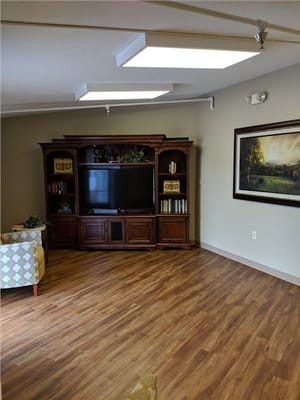
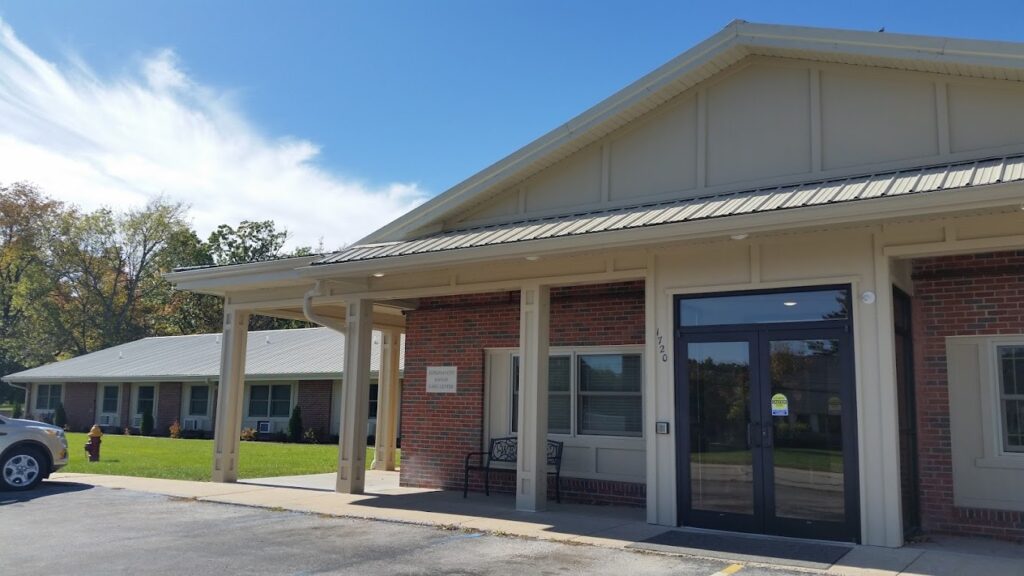
Tucked in Jefferson City, Missouri, River City Living Community stands as a stronghold of comprehensive and top-tier senior care. With a commitment to holistic well-being encompassing physical, mental, and psychosocial dimensions, this community takes seniors’ health and happiness to heart. What sets this haven apart is not just its reliability, but also its charming blend of classic elegance and warm ambiance.
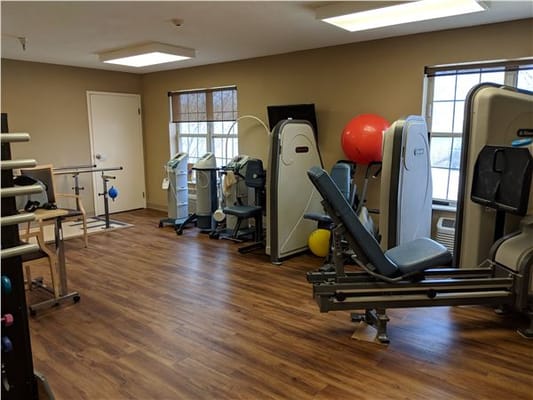
At River City Living Community, a wide array of in-house services are at residents’ fingertips, including skilled nursing care, physical and occupational therapy, personalized dietary guidance, memory care, and hospice care. Amidst a bustling calendar of diverse activities, this community ensures that no facet of wellness is overlooked. A vigilant team, led by experienced physicians and medical directors, maintains a watchful eye on residents’ safety and quality of life.

(573) 893-3404

Quality ratings

Measured by Centers for Medicare & Medicaid Services (CMS)

Overall rating Info The Overall CMS Rating combines results from health inspections, staffing levels and quality measures. Health inspections carry the most weight. Staffing and quality scores can increase or decrease the final rating based on performance compared to state and national standards.
1/5
Missouri average: 2.6/5
Health Inspection Info Based on the results of the facility's three most recent standard inspections and any complaint investigations. CMS reviews the number, scope, and severity of deficiencies, with more recent findings weighted more heavily.
2/5
Missouri average: 2.9/5
Staffing Info Measures average nursing staff hours per resident per day, including Registered Nurses (RNs) and total nursing staff. Ratings are adjusted based on the level of care residents require and are compared to state and national benchmarks.
2/5
Missouri average: 2.2/5
Quality Measures Info Based on clinical and physical health indicators reported to CMS, such as hospital readmissions, falls, pressure ulcers, and improvements in mobility. These measures reflect how well residents' health needs are being managed.
1/5
Missouri average: 2.8/5

Nursing care per resident

Info This shows how many total hours of nursing staff time are available per resident each day. Higher numbers usually mean more staff support.
5h 23m per day

This home provides 42% more nursing time per resident than the Missouri average.

Missouri average: 3h 48m per day

Staffing hours breakdown

Info Hours of care per resident per day, broken down by staff type. Data from CMS Medicare.
Staff type Facility State avg National avg
Registered Nurse (RN) Info Registered nurse hours per resident per day. 18m per day 28m per day 41m per day
Nurse Aide Info Nurse aide hours per resident per day. 3h 39m per day 2h 20m per day 2h 21m per day
Total Nursing (Weekend) Info Total number of nurse staff hours per resident per day on weekends. 4h 21m per day 3h 3m per day 3h 26m per day
Physical Therapist Info Physical therapist staff hours per resident per day. 7m per day 2m per day 4m per day
RN (Weekend) Info Registered nurse hours per resident per day on weekends. 20m per day 20m per day 29m per day

Capacity and availability

Smaller home

May offer a more intimate, personalized care environment.

Total beds 87

This home usually has availability

Lower occupancy suggests more openings may be available.

Lower demand than the Missouri average
Occupancy rate 50.6%
Residents per day (avg) 38
Occupancy rate
50.6%
Residents per day (avg)
38

Who this home usually serves

TYPE OF STAY

Primarily long-term care, limited rehab

Most residents stay long-term, while a smaller portion are admitted for short-term rehab.

Might be optimal for
Long-term residence Daily assistance Occasional rehab needs

Breakdown by payment type

Medicare

12% of new residents, usually for short-term rehab.

Typical stay 20 days

Private pay

66% of new residents, often for short stays.

Typical stay 2 - 3 months

Medicaid

22% of new residents, often for long-term daily care.

Typical stay 1 years

Finances and operations

Privately-owned community
Operated by a business corporation.
Home revenue
$4.1M
Operating loss
-$852.8K
Privately-owned community Operated by a business corporation.
Home revenue
$4.1M
Operating loss
-$852.8K
Payroll costs Info The portion of the home's budget spent on staff, including nurses, caregivers, and other employees who support care and operations.
$1.7M
40.4% of revenue
Other operating costs Info All remaining costs needed to run the home, such as food, utilities, building maintenance, supplies and administrative expenses.
$3.3M
Total costs $4.9M
Bed community size
87-bed community
A larger shared setting that may offer more common spaces and organized community services.
Walk Score
Walk Score: 17 / 100
Car-dependent. Most errands require a car, with limited nearby walkable options.

About this community

Occupancy

Occupancy rate
51%
In line with Missouri average
Occupied beds
44 / 87
Average residents 72 per day

License Details

Facility TypeSnf
CountyCOLE

Additional Licensing Details

CMS Certification Number265482

Ownership & Operating Entity

River City Living Community is legally operated by N & R Of Jefferson City, Llc, and administrated by Patton.

Corporate EntityN & R OF JEFFERSON CITY, LLC

Therapy & Rehabilitation

1 service
Rehabilitation Services

Staffing & Medical

1 service
Skilled Nursing

Additional Services

6 services
Skilled Nursing Care
Physical And Occupational Therapies
Dietitians
Behavioral And Alzheimer’s Care
Activities
Hospice

Amenities & Lifestyle

0 amenities
Specific ProgramsAbout Us, Services, Calendar, Virtual Tour, Resident Transportation, Careers, Contact Us

Types of Care at River City Living Community

Nursing Home

Contact River City Living Community

Access & Eligibility

Ways to qualify for care at this community, including accepted programs and payment options.

Medicare Accepted

This facility is certified for eligible Medicare services.

Payment & Funding Options

Medicare

Inspection History

In Missouri, the Department of Health and Senior Services, Division of Regulation and Licensure performs the inspections and unannounced surveys required for all long-term care providers.

11 visits/inspections

5 visits/inspections triggered by complaints

3 routine inspections

Results

11 with issues

0 without issues

Latest inspection

Date November 18, 2025
Plan Of Correction

48 deficiencies

Deficiencies indicate regulatory issues. A higher number implies the facility had several areas requiring improvement.

Missouri average: 35 deficiencies

Health Inspection History

Inspections
Total health inspections 10

Missouri average 6.6


Last Health inspection on May 2025

Total health citations 44

Missouri average 36.5

Citations per inspection
4.4

Missouri average 5.67


Health citations are formal notices following inspections when they fail to comply with safety and care standards.

32 of 44 citations resulted from standard inspections; and 12 of 44 resulted from complaint investigations.

Breakdown of citation severity (last 3 years)
Critical Health citations More info 2
186% worse than Missouri average

Missouri average: 0.7


Serious Health citations More info 0
100% better than Missouri average

Missouri average: 1

2 critical citations More info Missouri average: 0.7

0 serious citations More info Missouri average: 1

37 moderate citations More info Missouri average: 33.6

5 minor citations More info Missouri average: 1.2
Citations history (last 3 years)
Care Planning moderate citation Info Issues related to creating and updating personalized care plans for residents based on their needs and conditions. May 06, 2025
Corrected

Resident Rights moderate citation Info Issues related to resident's rights, including dignity, privacy, and the ability to make decisions about their care. May 06, 2025
Corrected

Nursing Services moderate citation Info Issues related to the availability and quality of nursing staff and the care they provide. Feb 13, 2025
Corrected

Care Planning moderate citation Info Issues related to creating and updating personalized care plans for residents based on their needs and conditions. Feb 13, 2025
Corrected

Compare Nursing Homes around Jefferson City The information below is reported by the Missouri Department of Health and Senior Services, Division of Regulation and Licensure.

5 facilities compared · CMS & MO Dept. of Health data · Updated Apr 2026

Filter by care type
Jefferson City Manor
NH

Nursing Home Licensed facility providing 24/7 skilled nursing care for residents with complex, ongoing medical needs. Staffed by RNs, LPNs, and CNAs. Inspected and star-rated annually by CMS. Accepts Medicare (short-term rehab) and Medicaid (long-term care).

AL

Assisted Living A licensed, long-term care setting for seniors or individuals with disabilities who need help with daily activities — like bathing, dressing, and medication management — but not 24-hour skilled nursing. Offers housing, meals, and around-the-clock support while aiming to maximize resident independence.

Jefferson City
102
70.2%
+5%
3.53
-26%
-5%
1
34
3.4
2
61
4
Juckette, Cynthia
$13.0M
$2.4M
18.3%
265285
1 Bed
Stonebridge Adams Street
NH

Nursing Home Licensed facility providing 24/7 skilled nursing care for residents with complex, ongoing medical needs. Staffed by RNs, LPNs, and CNAs. Inspected and star-rated annually by CMS. Accepts Medicare (short-term rehab) and Medicaid (long-term care).

AL

Assisted Living A licensed, long-term care setting for seniors or individuals with disabilities who need help with daily activities — like bathing, dressing, and medication management — but not 24-hour skilled nursing. Offers housing, meals, and around-the-clock support while aiming to maximize resident independence.

Jefferson City
120
44.9%
-33%
3.67
-14%
-2%
1
37
4.6
1
49
54
Volkart, Ruth
$5.1M
$2.3M
44.4%
265810
1 Bed
River City Living Community
NH

Nursing Home Licensed facility providing 24/7 skilled nursing care for residents with complex, ongoing medical needs. Staffed by RNs, LPNs, and CNAs. Inspected and star-rated annually by CMS. Accepts Medicare (short-term rehab) and Medicaid (long-term care).

AL

Assisted Living A licensed, long-term care setting for seniors or individuals with disabilities who need help with daily activities — like bathing, dressing, and medication management — but not 24-hour skilled nursing. Offers housing, meals, and around-the-clock support while aiming to maximize resident independence.

Jefferson City
87
52.6%
-21%
5.38
+6%
+44%
2
44
4.4
2
38
17
-
$4.0M
$1.7M
41.5%
265482
1 Bed
Stonebridge Villa Marie
NH

Nursing Home Licensed facility providing 24/7 skilled nursing care for residents with complex, ongoing medical needs. Staffed by RNs, LPNs, and CNAs. Inspected and star-rated annually by CMS. Accepts Medicare (short-term rehab) and Medicaid (long-term care).

AL

Assisted Living A licensed, long-term care setting for seniors or individuals with disabilities who need help with daily activities — like bathing, dressing, and medication management — but not 24-hour skilled nursing. Offers housing, meals, and around-the-clock support while aiming to maximize resident independence.

Jefferson City
120
53.0%
-20%
3.82
-36%
+2%
0
36
5.1
1
70
53
Lierman, Mark
$6.1M
$2.4M
38.5%
265208
1 Bed
Capitol River Wellness & Rehabilitation
-
NH

Nursing Home Licensed facility providing 24/7 skilled nursing care for residents with complex, ongoing medical needs. Staffed by RNs, LPNs, and CNAs. Inspected and star-rated annually by CMS. Accepts Medicare (short-term rehab) and Medicaid (long-term care).

AL

Assisted Living A licensed, long-term care setting for seniors or individuals with disabilities who need help with daily activities — like bathing, dressing, and medication management — but not 24-hour skilled nursing. Offers housing, meals, and around-the-clock support while aiming to maximize resident independence.

Jefferson City
120
-
-
-
-
-
-
-
-
0
0
0.0
0
-
-
-
-
-
-
-
-

Places of interest near River City Living Community

Address 3.8 miles from city center — 1.87 miles to nearest hospital (MOCPS)

Calculate Travel Distance to River City Living Community

Add your location

Address

Staffing Data (Q2 2025)

This data corresponds to Q2 2025 and is based on CMS Payroll-Based Journal.

Total staff 120
Employees 46
Contractors 74
Staff to resident ratio 3.08:1
80% better than Missouri average

Missouri average ratio: 1.71:1

Avg staff/day 24
Average shift 8.3 hours
0% compared with Missouri average

Missouri average: 8.1 hours

Total staff hours (quarter) 18,046
Nursing staff breakdown
Registered Nurse

Manages medical care and health needs.

Total count 10
Average shift length Info Average shift length. Calculated as total hours divided by days worked and average staff per day. 9.9 hours

This role is partially covered by contractors.

Licensed Practical Nurse

Assists with medical care and medications.

Total count 21
Average shift length Info Average shift length. Calculated as total hours divided by days worked and average staff per day. 8 hours

This role is partially covered by contractors.

Certified Nursing Assistant

Helps with daily care and mobility.

Total count 44
Average shift length Info Average shift length. Calculated as total hours divided by days worked and average staff per day. 8.3 hours

This role is partially covered by contractors.

Contractor staffing

Total hours from contractors

15.3%

2,765 contractor hours this quarter

Certified Nursing Assistant: 26 Licensed Practical Nurse: 16 Registered Nurse: 8 Medication Aide/Technician: 7 Physical Therapy Aide: 5 Speech Language Pathologist: 3 Respiratory Therapy Technician: 2 Physical Therapy Assistant: 2 Clinical Nurse Specialist: 2 Qualified Social Worker: 1 Occupational Therapy Aide: 1 Occupational Therapy Assistant: 1
Staff by category
Certified Nursing Assistant1826446,90591100%8.3
Medication Aide/Technician127194,00891100%9.5
Licensed Practical Nurse516212,00291100%8
Nurse Aide in Training4041,6288796%8.2
Registered Nurse28106025763%9.9
Administrator1015156673%7.8
Dental Services Staff1014666066%7.8
Respiratory Therapy Technician0224356167%7.1
Dietitian1013625560%6.6
Physical Therapy Assistant0223406268%5.5
Nurse Practitioner1013314044%8.3
RN Director of Nursing1012693741%7.3
Physical Therapy Aide055561719%3.1
Clinical Nurse Specialist0224944%8.1
Speech Language Pathologist033411415%2.9
Occupational Therapy Aide0112433%8
Occupational Therapy Assistant0111233%3.8
Qualified Social Worker011322%1.6
44 Certified Nursing Assistant
% of Days 100%
19 Medication Aide/Technician
% of Days 100%
21 Licensed Practical Nurse
% of Days 100%
4 Nurse Aide in Training
% of Days 96%
10 Registered Nurse
% of Days 63%
1 Administrator
% of Days 73%
1 Dental Services Staff
% of Days 66%
2 Respiratory Therapy Technician
% of Days 67%
1 Dietitian
% of Days 60%
2 Physical Therapy Assistant
% of Days 68%
1 Nurse Practitioner
% of Days 44%
1 RN Director of Nursing
% of Days 41%
5 Physical Therapy Aide
% of Days 19%
2 Clinical Nurse Specialist
% of Days 4%
3 Speech Language Pathologist
% of Days 15%
1 Occupational Therapy Aide
% of Days 3%
1 Occupational Therapy Assistant
% of Days 3%
1 Qualified Social Worker
% of Days 2%

Facility Characteristics

Source: CMS Long-Term Care Facility Characteristics (Data as of Jan 2026)

Total census
39 residents
Residents by payment source
Medicaid
38 residents (97.4%)
Private pay or other
1 resident (2.6%)
Programs & Services
Residents' Group

Residents meet regularly to discuss policies, care quality, and activities

Active Resident Council

Organized group of residents that meets regularly to discuss facility policies, quality of life, and activities.

Quality of care over time

These measures show how residents usually do over time at this home, based on health outcomes and preventive care.

High-risk clinical events score Info A composite score based on pressure ulcers, falls with injury, weight loss, walking ability decline, and activities of daily living decline. 16.6
51% worse than Missouri average

Missouri average: 10.9

Functional decline score Info A composite score based on activities of daily living decline, walking ability decline, and incontinence. 28.4
46% worse than Missouri average

Missouri average: 19.5

Long-stay resident measures
Significantly below average Missouri avg: 3.1 Info CMS star rating based on long-stay quality measure performance. 5 stars = significantly above average, 1 star = significantly below average.
Need for Help with Daily Activities Increased Info Percent of long-stay residents whose need for help with daily activities has increased 35.6%
80% worse than Missouri average

Missouri average: 19.8%

Walking Ability Worsened Info Percent of long-stay residents whose ability to move independently worsened 32.7%
59% worse than Missouri average

Missouri average: 20.6%

Low Risk Residents with Bowel/Bladder Incontinence Info Percent of low risk long-stay residents who lose control of their bowels or bladder 16.8%
8% better than Missouri average

Missouri average: 18.1%

Falls with Major Injury Info Percent of long-stay residents experiencing one or more falls with major injury 2.5%
38% better than Missouri average

Missouri average: 4.0%

High Risk Residents with Pressure Ulcers Info Percent of long-stay high risk residents with pressure ulcers 9.4%
88% worse than Missouri average

Missouri average: 5.0%

Urinary Tract Infection Info Percent of long-stay residents with a urinary tract infection 4.5%
65% worse than Missouri average

Missouri average: 2.7%

Lost Too Much Weight Info Percent of long-stay residents who lose too much weight 2.5%
55% better than Missouri average

Missouri average: 5.6%

Depressive Symptoms Info Percent of long-stay residents who have depressive symptoms 1.4%
89% better than Missouri average

Missouri average: 12.8%

Antipsychotic Use Info Percent of long-stay residents who received an antipsychotic medication 32.2%
46% worse than Missouri average

Missouri average: 22.0%

Pneumococcal Vaccine Info Percent of long-stay residents assessed and appropriately given the pneumococcal vaccine 83.8%
In line with Missouri average

Missouri average: 85.2%

Influenza Vaccine Info Percent of long-stay residents assessed and appropriately given the seasonal influenza vaccine 100.0%
10% better than Missouri average

Missouri average: 90.9%

Short-stay resident measures
Pneumococcal Vaccine Info Percent of short-stay residents assessed and appropriately given the pneumococcal vaccine 55.6%
17% worse than Missouri average

Missouri average: 66.6%

Antipsychotic medication increase Info Percent of short-stay residents who newly received an antipsychotic medication 0.0%
100% better than Missouri average

Missouri average: 2.2%

Penalties and fines

Federal penalties imposed by CMS for regulatory violations, including civil money penalties (fines) and denials of payment for new Medicare/Medicaid admissions.

Source: CMS Penalties Database (Data as of Jan 2026)

Total fines amount $241K
230% higher than Missouri average

Missouri average: $73K

Number of fines 2
18% fewer fines than Missouri average

Missouri average: 2.4

Payment Denials Info Serious action where Medicare and/or Medicaid temporarily stops payments for new residents until issues are fixed. 0
100% fewer payment denials than Missouri average

Missouri average: 0.7

Fines amount comparison
This facility $241K
Missouri average $73K
Penalty History

Penalties are imposed by CMS for violations of federal nursing home regulations.

Civil Money Penalty Info Fines imposed for noncompliance, which can be assessed per day or per instance of violation. Jun 26, 2024
$238K
Civil Money Penalty Info Fines imposed for noncompliance, which can be assessed per day or per instance of violation. Jan 12, 2023
$3K

Last updated: Jan 2026

Guides for Better Senior Living

Care Cost Calculator: See Prices in Your Area

Nursing Home Data Explorer

Don’t Wait Too Long: 7 Red Flag Signs Your Parent Needs Assisted Living Now

The True Cost of Assisted Living in 2025 – And How Families Are Paying For It

Understanding Senior Living Costs: Pricing Models, Discounts & Financial Assistance

Financial Aid for Missouri Seniors

Get financial aid guidance

Aged and Disabled Waiver

Missouri Medicaid A&D Waiver

Age 65+ or disabled, Missouri resident, Medicaid- eligible, nursing home-level care need.

~$2,829/month (300% FBR, individual).

$2,000 (individual), $3,000 (couple).

Rural access prioritized.

Missouri Supplemental Nursing Care (SNC)

MO SNC

Age 65+, Missouri resident, in approved facility.

~$1,215/month (individual).

$2,000 (individual).

Supplements SSI; facility-based only.

Structured Family Caregiving Waiver (SFCW)

Missouri Structured Family Caregiving Waiver

Age 65+, Missouri resident, MO HealthNet-eligible, NFLOC, dementia diagnosis, live with caregiver.

~$2,901/month (300% FBR, individual); QIT required.

$5,909.25 (individual), $11,818.45 (couple).

Caregiver must be family; small program size.

MO HealthNet Aged, Blind, and Disabled (ABD)

Missouri MO HealthNet ABD

Age 65+ or disabled, Missouri resident, MO HealthNet-eligible, needs help with 1+ ADL.

~$1,690/month (individual, projected); spenddown allowed.

$5,909.25 (individual), $11,818.45 (couple).

Less intensive than waivers; statewide access.

Medicare Savings Program (MSP)

Missouri Medicare Savings Program

Age 65+ or disabled, Missouri resident, Medicare Part A/B.

~$2,510/month (QMB), ~$3,380/month (SLMB), ~$3,598/month (QI)—individual.

$9,430 (individual), $14,130 (couple).

Three tiers; no waitlist; includes Extra Help for Part D.

Missouri Caregiver Program (Customized Caregiver Training & Relief)

Missouri Caregiver Program

Caregivers of 60+ with dementia, Missouri resident, functional needs (2+ ADLs).

No strict cap; prioritizes low-income (~$24,980/year individual).

Not assessed; need-based.

Administered via AAAs and Alzheimer’s Association; rural focus.

Senior Community Service Employment Program (SCSEP)

Missouri SCSEP

Age 55+, unemployed, low-income, Missouri resident.

~$1,983/month (125% FPL).

Not specified; income-focused.

Priority for veterans, rural residents; AARP partnership.

VA Aid and Attendance (A&A) and Housebound Benefits

Missouri VA Aid and Attendance/Housebound

Age 65+ or disabled veteran/spouse, Missouri resident, wartime service, need for ADL help (A&A) or homebound.

Net income < ~$1,984/month (veteran with dependent, A&A); pension offsets income.

~$155,356 (net worth limit).

High veteran demand in rural/urban areas.

Tour Icon
Planning a tour? Check our touring checklist.
Chat Icon
Thinking of living here? We can help you speak to a current resident