Riverbend Health and Rehabilitation Center
Nursing Home · Loveland, CO
CMS overall rating Info The Overall CMS Rating is scored from 1 to 5 stars and combines results from health inspections, staffing levels, and quality measures. Health inspections carry the most weight. Staffing and quality scores can increase or decrease the final rating based on performance compared to state and national standards.

Riverbend Health and Rehabilitation Center

Nursing Home · Loveland, CO
CMS overall rating Info The Overall CMS Rating is scored from 1 to 5 stars and combines results from health inspections, staffing levels, and quality measures. Health inspections carry the most weight. Staffing and quality scores can increase or decrease the final rating based on performance compared to state and national standards.
Calculator: See prices in your area
Riverbend Health and Rehabilitation Center accepts Medicare, Medicaid, and private pay.

Overview of Riverbend Health and Rehabilitation Center

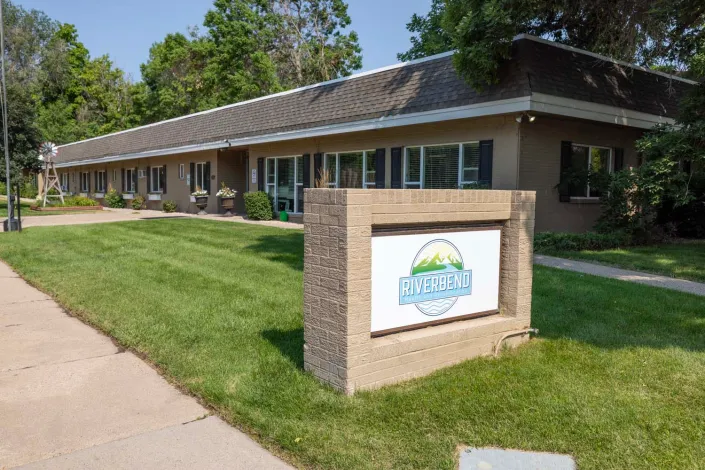
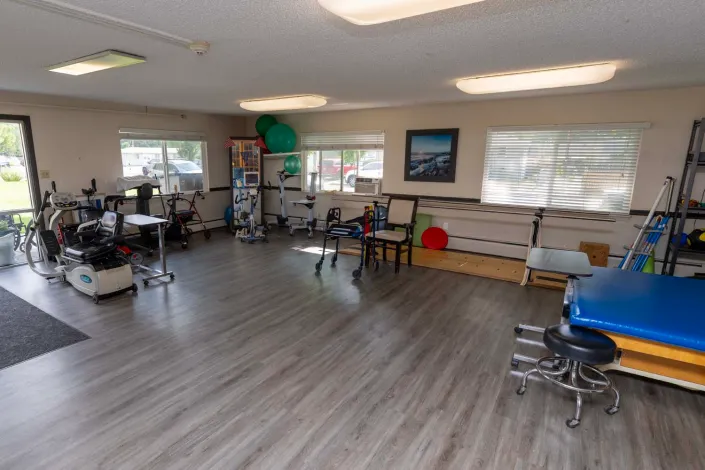
Riverbend Health and Rehabilitation Center is a nursing home in Loveland, CO, offering skilled nursing and rehabilitation. Here, older adults are well-cared for, accompanied by a nurturing and welcoming environment. With 24-hour care, therapeutic services, and recreational programs, residents experience worry-free living. Through a collaborative effort with family and healthcare providers, the community dreates the best possible care for residents’ welfare.

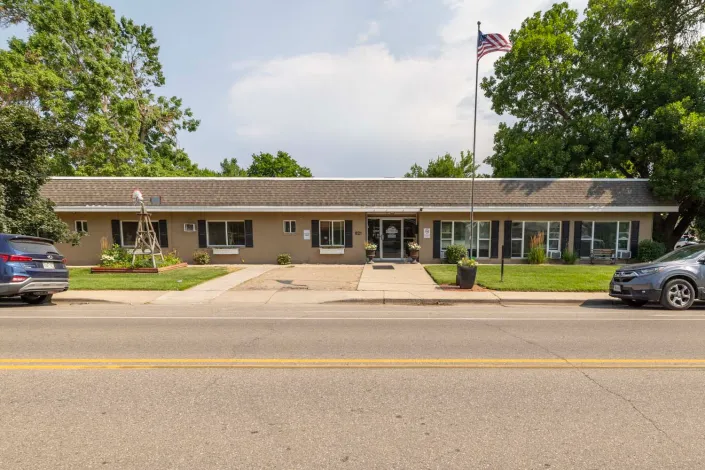
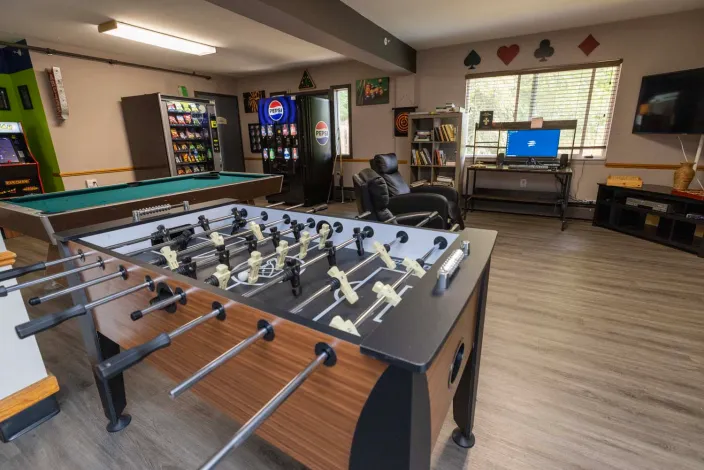
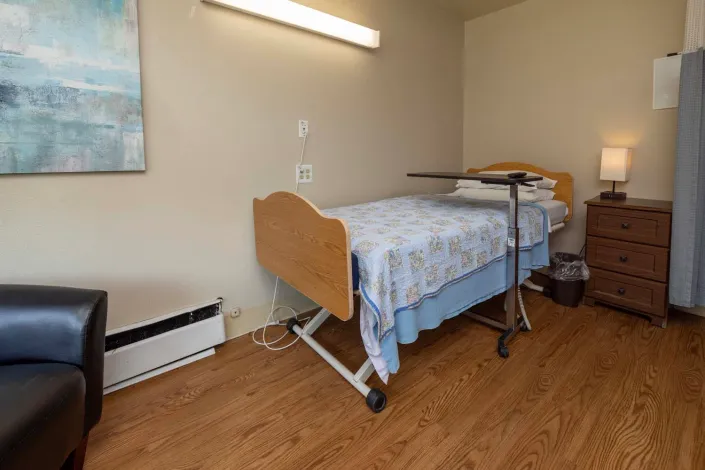
Cooking classes, light exercises, and card games are just some of the activities dedicated to helping residents stay active and continue learning. Residents can also feel comfortable and safe with thoughtfully furnished rooms and cozy communal spaces. Situated near a bus stop in the residential area of Loveland, the community guarantees a convenient and laid-back lifestyle. Providing exceptional standards of care to help older adults thrive, this nursing home is a good option for senior living in Colorado.

Quality ratings

Measured by Centers for Medicare & Medicaid Services (CMS)

Overall rating Info The Overall CMS Rating combines results from health inspections, staffing levels and quality measures. Health inspections carry the most weight. Staffing and quality scores can increase or decrease the final rating based on performance compared to state and national standards.
▲ 27.2% Above CO avg.
Health Inspection Info Based on the results of the facility's three most recent standard inspections and any complaint investigations. CMS reviews the number, scope, and severity of deficiencies, with more recent findings weighted more heavily.
▲ 44.4% Above CO avg.
Staffing Info Measures average nursing staff hours per resident per day, including Registered Nurses (RNs) and total nursing staff. Ratings are adjusted based on the level of care residents require and are compared to state and national benchmarks.
▼ 34.2% Below CO avg.
Quality Measures Info Based on clinical and physical health indicators reported to CMS, such as hospital readmissions, falls, pressure ulcers, and improvements in mobility. These measures reflect how well residents' health needs are being managed.
▼ 27.7% Below CO avg.

Staffing hours breakdown

Info Daily nursing hours per resident by staff type, reported to CMS. Higher is generally better — compare this facility to state and national averages to see where staffing stands.

Hours per resident per day — compared to Colorado state averages

Total nursing care / resident Info This home is ranked 118th out of 156 homes in Colorado.

Total adjusted nursing hours per resident per day, combining RN, LPN, and aide time. CMS adjusts this for case-mix so facilities can be fairly compared.
3h 17m per day
Rank #118 / 156Nurse hours — state benchmarkedThis home is ranked 118th out of 156 homes in Colorado.Shows adjusted nurse hours per resident per day benchmarked to the Colorado average, with a ranking across 156 Colorado SNFs. More hours mean more direct care. The national average is about 3.5 hrs; below 3.0 is a red flag.
This facility Colorado avg (3h 52m per day)
vs Colorado avg
-15%

5 of 6 metrics below state avg

Staff typeHours / dayvs state avg
Registered Nurse (RN) Info RNs hold the highest nursing license and can assess residents, interpret test results, and direct care plans. More RN hours per day often signals stronger clinical oversight and faster response to health changes. 42m per day ▼ 16% State avg: 50m per day · National avg: 41m per day
LPN / LVN Info Licensed Practical Nurses (LPNs) or Licensed Vocational Nurses (LVNs) deliver routine hands-on care — medication administration, wound dressing, and monitoring vital signs. They work under RN supervision and make up a large share of daily bedside care. 29m per day ▼ 29% State avg: 41m per day · National avg: 52m per day
Nurse Aide Info Certified Nurse Aides (CNAs) provide the most direct day-to-day assistance: bathing, dressing, feeding, and mobility. Nurse aide hours are typically the largest staffing category and directly affect residents' quality of life. 1h 56m per day ▼ 13% State avg: 2h 13m per day · National avg: 2h 21m per day
Total Nursing (Weekend) Info Combined nursing hours (RN + LPN + Nurse Aide) per resident per day on weekends. Staffing often drops on weekends — this figure reveals whether the facility maintains adequate coverage outside of weekday hours. 2h 44m per day ▼ 17% State avg: 3h 17m per day · National avg: 3h 26m per day
Physical Therapist Info Hours per resident per day provided by licensed Physical Therapists (PTs) or PT Assistants. PT services help residents recover mobility after injury or illness and are especially important for post-acute (short-stay) rehabilitation. 5m per day ■ Avg State avg: 5m per day · National avg: 4m per day
RN (Weekend) Info Registered nurse hours specifically on weekends. Facilities sometimes reduce RN presence on Saturdays and Sundays — a low weekend RN figure compared to weekday hours can indicate reduced clinical oversight when most administrative staff are absent. 25m per day ▼ 31% State avg: 36m per day · National avg: 29m per day

Capacity and availability

This home usually has availability

Occupancy lower than 85% suggests more openings may be available.

Lower occupancy than the Colorado average: 76.5%
Occupancy rate 72.4% Rank #99 / 160Occupancy rate — state benchmarkedThis home is ranked 99th out of 160 homes in Colorado.Shows this facility's occupancy rate versus the Colorado average, with its statewide rank out of 160. Higher occupancy signals strong local demand and financial stability.
Avg. Length of Stay 154 days
Occupancy rate
72.4% Rank #99 / 160Occupancy rate — state benchmarkedThis home is ranked 99th out of 160 homes in Colorado.Shows this facility's occupancy rate versus the Colorado average, with its statewide rank out of 160. Higher occupancy signals strong local demand and financial stability.
Avg. Length of Stay
154 days

Who this home usually serves

TYPE OF STAY

Mostly long-term care residents

Most residents stay for extended periods and receive ongoing daily care.

Breakdown by payment type

Medicare

18% of new residents, usually for short-term rehab.

Typical stay 1 - 2 months

Private pay

56% of new residents, often for short stays.

Typical stay 1 - 2 months

Medicaid

25% of new residents, often for long-term daily care.

Typical stay 1 - 2 years

Finances and operations

Privately-owned community
Home revenue
$10.9M
Operating loss
-$415.4K
Privately-owned community
Home revenue
$10.9M Rank #84 / 160Revenue — state benchmarkedThis home is ranked 84th out of 160 homes in Colorado.Shows this facility's annual revenue compared to the Colorado SNF average. Higher revenue generally means more resources for staffing and capital — read alongside Payroll %.
Operating loss
-$415.4K
Payroll costs Info The portion of the home's budget spent on staff, including nurses, caregivers, and other employees who support care and operations. Rank #86 / 160Payroll — state benchmarkedThis home is ranked 86th out of 160 homes in Colorado.Shows total annual staff payroll benchmarked to the Colorado average. Higher payroll investment relative to peers often signals better staffing and less reliance on cheaper contract labor.
$5.2M
47.9% of revenue Rank #97 / 160Payroll % — state benchmarkedThis home is ranked 97th out of 160 homes in Colorado.Shows payroll as a percentage of revenue versus the Colorado average. Well-run SNFs often land around 55–65%. Below 25% may signal understaffing or heavy agency use — read with Staffing ratings.
Other operating costs Info All remaining costs needed to run the home, such as food, utilities, building maintenance, supplies and administrative expenses.
$6.1M
Total costs $11.3M
Walk Score
Walk Score: 36 / 100 Rank #126 / 158Walk Score — state benchmarkedThis home is ranked 126th out of 158 homes in Colorado.Shows how walkable this facility's neighborhood is compared to the average Walk Score across Colorado SNFs. Higher scores benefit residents, families, and staff.
Somewhat walkable. A few nearby services may be reachable on foot, but most trips require transportation.

What does this home offer?

Building type icon
Building type icon

Building Type: Single-story

Dining services icon

Dining Services

Rehabilitative support icon

Rehabilitative Support

Social and recreational activities icon

Social and Recreational Activities

On-site medical care and health services icon

On-site Medical Care and Health Services

Types of Care at Riverbend Health and Rehabilitation Center

Nursing Home

Contact Riverbend Health and Rehabilitation Center

Health Inspection History

Inspections
Total health inspections 3

Colorado average 4.8


Last Health inspection on Jun 2024

Total health citations
22 Rank #72 / 160Health citations — state benchmarkedThis home is ranked 72nd out of 160 homes in Colorado.Shows this facility's total health deficiency citations benchmarked to the Colorado state average, with a ranking across all 160 CO SNFs. Lower citation counts earn a better rank.

Colorado average 24.8

Citations per inspection
7.33 Rank #132 / 160Citations per inspection — state benchmarkedThis home is ranked 132nd out of 160 homes in Colorado.Shows average deficiency citations per CMS inspection for this facility versus the Colorado mean across 160 SNFs with citation data. Lower is better.

Colorado average 5.2


Health citations are formal notices following inspections when they fail to comply with safety and care standards.

All 22 citations resulted from standard inspections.

Breakdown of citation severity (last 5 years)
Critical Health citations More info
0
100% better than Colorado average

Colorado average: 0.4


Serious Health citations More info 2
5% better than Colorado average

Colorado average: 2.1

0 critical citations More info Colorado average: 0.4

2 serious citations More info Colorado average: 2.1

20 moderate citations More info Colorado average: 22.2

0 minor citations More info Colorado average: 0.2
Citations history (last 5 years)
Abuse/Neglect moderate citation Info Issues related to protecting resident's from harm, including abuse, neglect, or mistreatment. Jun 27, 2024
Corrected

Nutrition moderate citation Info Issues related to food quality, meal service, and resident's nutritional needs. Jun 27, 2024
Corrected

Pharmacy moderate citation Info Issues related to medication management, including how drugs are stored, administered, and monitored. Jun 27, 2024
Corrected

Infection Control moderate citation Info Issues related to preventing and controlling infections, including hygiene practices and safety protocols. Feb 09, 2023
Corrected

Financial Assistance for
Nursing Home in Colorado

Riverbend Health and Rehabilitation Center is located in Loveland, Colorado.
Here are the financial assistance programs available to residents in Colorado.

Get Financial aid guidance

Elderly, Blind, and Disabled Waiver

Colorado Medicaid EBD Waiver

Age 65+ or disabled
General Colorado resident, Medicaid- eligible, nursing home-level care need.
Income Limits (2025) ~$2,829/month 300% FBR, individual
Asset Limits $2,000 (individual), $3,000 (couple).
CO

Requires level-of-care assessment by case manager.

Benefits
Personal care (5-7 hours/day) Respite care (up to 240 hours/year) Adult day care ($65/day) Home modifications ($1,500 avg.)

Old Age Pension (OAP) Health Care Program

Colorado OAP

Age 60+
General Colorado resident.
Income Limits ~$1,215/month individual
Asset Limits $2,000 individual
CO

Supplements SSI; limited medical coverage.

Benefits
Cash (~$100-$800/month) Limited in-home care (2-3 hours/week) Medical assistance

Program of All-Inclusive Care for the Elderly (PACE)

Colorado Medicaid PACE

Age 55+
General Colorado resident, nursing home-level care need, safe with PACE support.
Income Limits (2025) ~$2,829/month 300% FBR
Asset Limits $2,000 (individual), $3,000 (couple).
CO

Limited to specific regions (e.g., Denver, Pueblo).

Benefits
All-inclusive care—personal care (5-7 hours/day) Meals Transportation Therapy Medical visits

Home Care Allowance (HCA)

Colorado Home Care Allowance (HCA)

Age
General Seniors typically 65+, Age 5+ with disability, Colorado resident, financial/functional need.
Income Limits (2025) ~$1,004/month individual, stricter than waivers
Asset Limits $2,000 (individual), $3,000 (couple).
CO

Must need help with ADLs; not Medicaid-waiver eligible.

Benefits
Personal care (~4-6 hours/day, paid to provider) E.g. Bathing Dressing

Places of interest near Riverbend Health and Rehabilitation Center

Address 1.7 miles from city center Info Estimated distance in miles from Loveland's city center to Riverbend Health and Rehabilitation Center's address, calculated via Google Maps.

Calculate Travel Distance to Riverbend Health and Rehabilitation Center

Add your location

Address

Staffing Data (Q2 2025)

This data corresponds to Q2 2025 and is based on CMS Payroll-Based Journal.

Total staff 99
Employees 98
Contractors 1
Staff to resident ratio 1.25:1
34% worse than Colorado average

Colorado average ratio: 1.91:1

Avg staff/day 37
Average shift 8.7 hours
5% better than Colorado average

Colorado average: 8.3 hours

Total staff hours (quarter) 29,207

Nursing staff breakdown

Registered Nurse

Manages medical care and health needs.

Total count 13
Average shift length Info Average shift length. Calculated as total hours divided by days worked and average staff per day. 9.4 hours

No contractors work on this role.

Licensed Practical Nurse

Assists with medical care and medications.

Total count 10
Average shift length Info Average shift length. Calculated as total hours divided by days worked and average staff per day. 10.5 hours

No contractors work on this role.

Certified Nursing Assistant

Helps with daily care and mobility.

Total count 40
Average shift length Info Average shift length. Calculated as total hours divided by days worked and average staff per day. 8.8 hours

This role is partially covered by contractors.

Contractor staffing

Total hours from contractors

0.1%

21 contractor hours this quarter

Certified Nursing Assistant: 1

Staff by category

Certified Nursing Assistant3914012,75691100%8.8
Registered Nurse130134,55391100%9.4
Other Dietary Services Staff8082,4748998%7.7
Licensed Practical Nurse100102,4088796%10.5
Dental Services Staff4041,1137481%7.7
Clinical Nurse Specialist5051,0076875%8.3
Physical Therapy Assistant3039806673%7.3
Respiratory Therapy Technician3037057077%6.3
Nurse Practitioner1015856571%9
Administrator1015206571%8
Physical Therapy Aide1014926167%8.1
Nurse Aide in Training1014824145%11.8
Medication Aide/Technician1014824752%10.3
Qualified Social Worker3033097684%4
RN Director of Nursing1012112426%8.8
Speech Language Pathologist3031272224%5.5
Occupational Therapy Assistant101211%2
40 Certified Nursing Assistant
% of Days 100%
13 Registered Nurse
% of Days 100%
8 Other Dietary Services Staff
% of Days 98%
10 Licensed Practical Nurse
% of Days 96%
4 Dental Services Staff
% of Days 81%
5 Clinical Nurse Specialist
% of Days 75%
3 Physical Therapy Assistant
% of Days 73%
3 Respiratory Therapy Technician
% of Days 77%
1 Nurse Practitioner
% of Days 71%
1 Administrator
% of Days 71%
1 Physical Therapy Aide
% of Days 67%
1 Nurse Aide in Training
% of Days 45%
1 Medication Aide/Technician
% of Days 52%
3 Qualified Social Worker
% of Days 84%
1 RN Director of Nursing
% of Days 26%
3 Speech Language Pathologist
% of Days 24%
1 Occupational Therapy Assistant
% of Days 1%

Facility Characteristics

Source: CMS Long-Term Care Facility Characteristics (Data as of Jan 2026)

Total residents 79
Medicare
8
10.1% of residents
Medicaid
59
74.7% of residents
Private pay or other
12
15.2% of residents
Programs & Services
Residents Group

Residents meet regularly to discuss policies, care quality, and activities

Active Resident Council

Organized group of residents that meets regularly to discuss facility policies, quality of life, and activities.

Quality of care over time

These measures show how residents usually do over time at this home, based on health outcomes and preventive care.

High-risk clinical events score Info A composite score based on pressure ulcers, falls with injury, weight loss, walking ability decline, and activities of daily living decline. 11.1
22% worse than Colorado average

Colorado average: 9.0

Functional decline score Info A composite score based on activities of daily living decline, walking ability decline, and incontinence. 21.9
17% worse than Colorado average

Colorado average: 18.8

Long-stay resident measures
Average Info CMS star rating based on long-stay quality measure performance. 5 stars = significantly above average, 1 star = significantly below average.
Need for Help with Daily Activities Increased Info Percent of long-stay residents whose need for help with daily activities has increased 20.9%
30% worse than Colorado average

Colorado average: 16.0%

Walking Ability Worsened Info Percent of long-stay residents whose ability to move independently worsened 26.9%
58% worse than Colorado average

Colorado average: 17.0%

Low Risk Residents with Bowel/Bladder Incontinence Info Percent of low risk long-stay residents who lose control of their bowels or bladder 18.0%
22% better than Colorado average

Colorado average: 23.2%

Falls with Major Injury Info Percent of long-stay residents experiencing one or more falls with major injury 1.5%
54% better than Colorado average

Colorado average: 3.3%

High Risk Residents with Pressure Ulcers Info Percent of long-stay high risk residents with pressure ulcers 2.1%
45% better than Colorado average

Colorado average: 3.9%

Urinary Tract Infection Info Percent of long-stay residents with a urinary tract infection 0.0%
100% better than Colorado average

Colorado average: 1.4%

Lost Too Much Weight Info Percent of long-stay residents who lose too much weight 3.9%
25% better than Colorado average

Colorado average: 5.2%

Depressive Symptoms Info Percent of long-stay residents who have depressive symptoms 11.3%
57% worse than Colorado average

Colorado average: 7.2%

Antipsychotic Use Info Percent of long-stay residents who received an antipsychotic medication 36.3%
93% worse than Colorado average

Colorado average: 18.8%

Pneumococcal Vaccine Info Percent of long-stay residents assessed and appropriately given the pneumococcal vaccine 97.3%
In line with Colorado average

Colorado average: 93.3%

Influenza Vaccine Info Percent of long-stay residents assessed and appropriately given the seasonal influenza vaccine 96.1%
In line with Colorado average

Colorado average: 94.7%

Hospitalizations per 1,000 days Info Number of hospitalizations per 1,000 long-stay resident days. 1.74
34% worse than Colorado average

Colorado average: 1.30

ED visits per 1,000 days Info Number of outpatient emergency department visits per 1,000 long-stay resident days. 1.29
23% better than Colorado average

Colorado average: 1.67

Short-stay resident measures
Significantly above average Info CMS star rating based on short-stay quality measure performance. 5 stars = much above average, 1 star = much below average.
Pneumococcal Vaccine Info Percent of short-stay residents assessed and appropriately given the pneumococcal vaccine 66.3%
13% worse than Colorado average

Colorado average: 76.6%

Antipsychotic medication increase Info Percent of short-stay residents who newly received an antipsychotic medication 2.3%
61% worse than Colorado average

Colorado average: 1.4%

Influenza Vaccine Info Percent of short-stay residents assessed and appropriately given the seasonal influenza vaccine 83.3%
10% better than Colorado average

Colorado average: 75.6%

Re-hospitalized after SNF stay Info Percentage of short-stay residents who were re-hospitalized after their nursing home admission. 12.1%
40% better than Colorado average

Colorado average: 20.3%

Emergency department visits Info Percentage of short-stay residents who had an outpatient emergency department visit. 22.4%
75% worse than Colorado average

Colorado average: 12.8%

Falls with major injury Info Percentage of SNF residents who experience falls with major injury during their stay. 0.0%
100% better than Colorado average

Colorado average: 0.8%

Ability to care for self at discharge Info Percentage of residents at or above expected ability to care for themselves at discharge. 65.6%
22% better than Colorado average

Colorado average: 53.7%

Successful return to home or community Info Rate of successful return to home or community from a skilled nursing facility. 51.8%
In line with Colorado average

Colorado average: 50.6%

Penalties and fines

Federal penalties imposed by CMS for regulatory violations, including civil money penalties (fines) and denials of payment for new Medicare/Medicaid admissions.

Source: CMS Penalties Database (Data as of Jan 2026)

Total fines amount $13K
67% lower than Colorado average

Colorado average: $40K

Number of fines 1
55% fewer fines than Colorado average

Colorado average: 2.2

Payment Denials Info Serious action where Medicare and/or Medicaid temporarily stops payments for new residents until issues are fixed. 0
100% fewer payment denials than Colorado average

Colorado average: 0.3

Fines amount comparison
This facility $13K
Colorado average $40K

No penalties in the past 3 years

No civil money penalties or payment denials were reported in the last 3 years.

Compare Nursing Home around Loveland

The information below is reported by the Colorado Department of Public Health and Environment, Health Facilities Division.

3 facilities compared · CMS & CO Dept. of Health data · Updated May 2026

Filter by care type
North Shore Health and Rehabilitation Center
NH

Nursing Home Licensed facility providing 24/7 skilled nursing care for residents with complex, ongoing medical needs. Staffed by RNs, LPNs, and CNAs. Inspected and star-rated annually by CMS. Accepts Medicare (short-term rehab) and Medicaid (long-term care).

Loveland120 74.8% -2%4.06 +20%+5%1225.5-83 35 John Wilson$12.7M$6.6M52%65129
Riverbend Health and Rehabilitation Center
NH

Nursing Home Licensed facility providing 24/7 skilled nursing care for residents with complex, ongoing medical needs. Staffed by RNs, LPNs, and CNAs. Inspected and star-rated annually by CMS. Accepts Medicare (short-term rehab) and Medicaid (long-term care).

Loveland (Duffield Court)100 72.4% -5%3.28 -3%-15%1227.3279 36 Rocky Mountain Snf Holdings LLC$10.9M$4.4M40.3%65165
Green House Homes at Mirasol
NH

Nursing Home Licensed facility providing 24/7 skilled nursing care for residents with complex, ongoing medical needs. Staffed by RNs, LPNs, and CNAs. Inspected and star-rated annually by CMS. Accepts Medicare (short-term rehab) and Medicaid (long-term care).

Loveland90 91.0% +19%6.27 -5%+62%3246.0-88 28 Loveland Elder Green House Homes For Life Enrichment A Colorado Non$14.9M$6.8M45.9%65412

Guides for Better Senior Living

Care Cost Calculator: See Prices in Your Area

Nursing Home Data Explorer

Don’t Wait Too Long: 7 Red Flag Signs Your Parent Needs Assisted Living Now

The True Cost of Assisted Living in 2025 – And How Families Are Paying For It

Understanding Senior Living Costs: Pricing Models, Discounts & Financial Assistance

Frequently Asked Questions about Riverbend Health and Rehabilitation Center

What neighborhood is Riverbend Health and Rehabilitation Center in?

Riverbend Health and Rehabilitation Center is in the Duffield Court neighborhood.

Is Riverbend Health and Rehabilitation Center in a walkable area?

Riverbend Health and Rehabilitation Center has a walk score of 36. Somewhat walkable. A few nearby services may be reachable on foot, but most trips require transportation.

What is the best email address for Riverbend Health and Rehabilitation Center?

The team at Riverbend Health and Rehabilitation Center can be reached at [email protected].

What is the address of Riverbend Health and Rehabilitation Center?

Riverbend Health and Rehabilitation Center is located at 821 Duffield Ct, Loveland, CO 80537.

What is the phone number of Riverbend Health and Rehabilitation Center?

(970) 669-0345 will put you in contact with the team at Riverbend Health and Rehabilitation Center.

Is Riverbend Health and Rehabilitation Center Medicare or Medicaid certified?

Yes — Riverbend Health and Rehabilitation Center is a CMS-certified provider of Medicare and Medicaid.

Explore Open Rooms
1 Contact details
2 What type of senior care service are you looking for?
3 What budget do you have in mind for senior care?
4 How soon do you need to find care?
5 Additional details

Thank you for your interest!

Our team will be in touch shortly to help with next steps.