Green House Homes at Mirasol
Nursing Home, Hospice Care & Palliative Care · Loveland, CO
CMS overall rating Info CMS (the Centers for Medicare & Medicaid Services) is the federal agency that rates nursing home quality. Its Overall Rating runs from 1 to 5 stars, combining health inspections, staffing, and quality measures, with inspections weighted most heavily.

Green House Homes at Mirasol

Nursing Home, Hospice Care & Palliative Care · Loveland, CO
CMS overall rating Info CMS (the Centers for Medicare & Medicaid Services) is the federal agency that rates nursing home quality. Its Overall Rating runs from 1 to 5 stars, combining health inspections, staffing, and quality measures, with inspections weighted most heavily.
Calculator: See prices in your area
Green House Homes at Mirasol accepts Medicare, Medicaid, and private pay.

Overview of Green House Homes at Mirasol

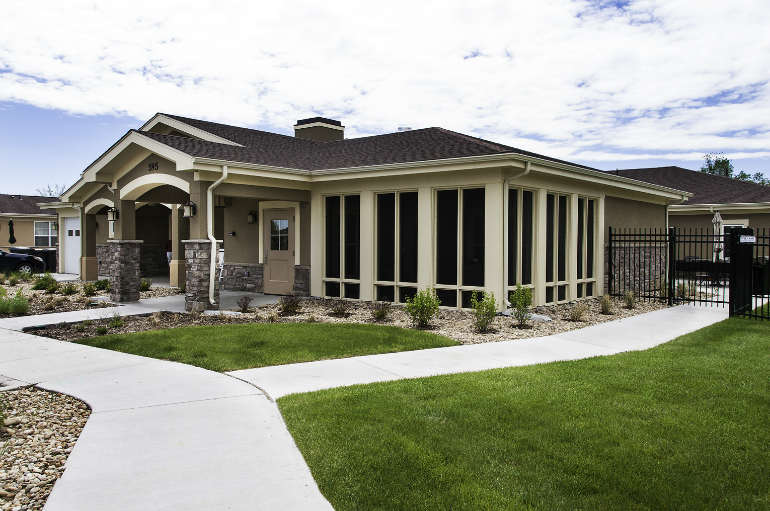
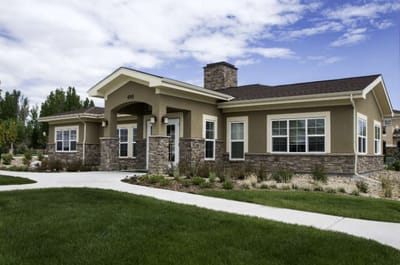
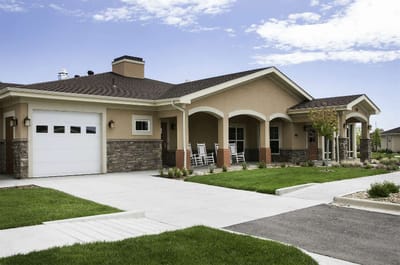
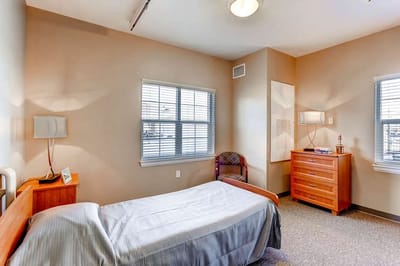
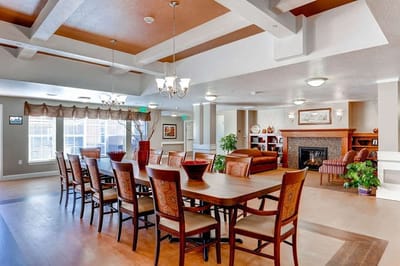
A single-story nursing home in Loveland, Colorado, is Green House Homes at Mirasol, which is designed around private rooms and a home-like setting. Owned by Loveland Elder Green House, the community welcomes Medicare, Medicaid, and private pay, so families have numerous routes to fund care. The facility tends to keep a high occupancy at around 91 percent, averaging a resident stay of around 130 days, indicating a balance of post-acute rehabilitation and active nursing care.

Staffing levels give substantial daily support, with total nursing care averaging 6 hours 16 minutes per resident day. Such a level of attentive nursing presence covers the core clinical needs expected in a skilled nursing home. It includes registered nurse coverage, nurse aide assistance, and licensed practical nurse time all day. The location on Mirasol Drive rates 28 for walkability, meaning a majority of errands and outings necessitate transportation.

The residential setting can attract families who seek a calmer, neighborhood-centered atmosphere instead of a busier commercial corridor.

Quality ratings

Measured by Centers for Medicare & Medicaid Services (CMS)

Overall rating Info The Overall CMS Rating combines results from health inspections, staffing levels and quality measures. Health inspections carry the most weight. Staffing and quality scores can increase or decrease the final rating based on performance compared to state and national standards.
▲ 59.0% Above CO avg. ▲ 59.0% Above CO avg.CO average: 3.1Click the badge to see the full State ranking.Click here to see the full State ranking.
Health Inspection Info Based on the results of the facility's three most recent standard inspections and any complaint investigations. CMS reviews the number, scope, and severity of deficiencies, with more recent findings weighted more heavily.
▲ 44.4% Above CO avg. ▲ 44.4% Above CO avg.CO average: 2.8Click the badge to see the full State ranking.Click here to see the full State ranking.
Staffing Info Measures average nursing staff hours per resident per day, including Registered Nurses (RNs) and total nursing staff. Ratings are adjusted based on the level of care residents require and are compared to state and national benchmarks.
▲ 31.6% Above CO avg. ▲ 31.6% Above CO avg.CO average: 3.0Click the badge to see the full State ranking.Click here to see the full State ranking.
Quality Measures Info Based on clinical and physical health indicators reported to CMS, such as hospital readmissions, falls, pressure ulcers, and improvements in mobility. These measures reflect how well residents' health needs are being managed.
▲ 20.5% Above CO avg. ▲ 20.5% Above CO avg.CO average: 4.1Click the badge to see the full State ranking.Click here to see the full State ranking.

Staffing hours breakdown

Info Daily nursing hours per resident by staff type, reported to CMS. Higher is generally better — compare this facility to state and national averages to see where staffing stands.

Hours per resident per day — compared to Colorado state averages

Total nursing care / resident Info This home is ranked 7th out of 215 homes in Colorado for nurse hours. Total adjusted nursing hours per resident per day, combining RN, LPN, and aide time. CMS adjusts this for case-mix so facilities can be fairly compared.
6h 16m per day
Rank #7 / 215Nurse hours — State benchmarkedThis home is ranked 7th out of 215 homes in Colorado. Shows adjusted nurse hours per resident per day benchmarked to the Colorado average, with a ranking across 215 Colorado facilities. More hours mean more direct care. The national average is about 3.5 hrs; below 3.0 is a red flag.Rankings are based only on facilities in Colorado that report data for that category. Facilities without available data are excluded from the ranking.Click the rank badge to see the full State ranking.Click here to see the full State ranking.
This facility Colorado avg (3h 52m per day)
vs Colorado avg
+62%

2 of 6 metrics below state avg

Standout metric Nurse Aide is +58% above state avg
Staff typeHours / Day / Residentvs state avg
Registered Nurse (RN) Info RNs hold the highest nursing license and can assess residents, interpret test results, and direct care plans. More RN hours per day often signals stronger clinical oversight and faster response to health changes. 46m per day ▼ 9% State avg: 50m per day · National avg: 41m per day
LPN / LVN Info Licensed Practical Nurses (LPNs) or Licensed Vocational Nurses (LVNs) deliver routine hands-on care — medication administration, wound dressing, and monitoring vital signs. They work under RN supervision and make up a large share of daily bedside care. 53m per day ▲ 29% State avg: 41m per day · National avg: 52m per day
Nurse Aide Info Certified Nurse Aides (CNAs) provide the most direct day-to-day assistance: bathing, dressing, feeding, and mobility. Nurse aide hours are typically the largest staffing category and directly affect residents' quality of life. 3h 30m per day ▲ 58% State avg: 2h 13m per day · National avg: 2h 21m per day
Weekend Total Nursing Info Combined nursing hours (RN + LPN + Nurse Aide) per resident per day on weekends. Staffing often drops on weekends — this figure reveals whether the facility maintains adequate coverage outside of weekday hours. 4h 48m per day ▲ 46% State avg: 3h 17m per day · National avg: 3h 26m per day
Physical Therapist Info Hours per resident per day provided by licensed Physical Therapists (PTs) or PT Assistants. PT services help residents recover mobility after injury or illness and are especially important for post-acute (short-stay) rehabilitation. 3m per day ▼ 31% State avg: 5m per day · National avg: 4m per day
Weekend RN Info Registered nurse hours specifically on weekends. Facilities sometimes reduce RN presence on Saturdays and Sundays — a low weekend RN figure compared to weekday hours can indicate reduced clinical oversight when most administrative staff are absent. 36m per day ■ Avg State avg: 36m per day · National avg: 29m per day

Capacity and availability

Smaller home

May offer a more intimate, personalized care environment.

Total beds 90

This home usually has limited availability

Higher occupancy than the Colorado average: 76.5%
Occupancy rate
91% Rank #36 / 221Occupancy rate — State benchmarkedThis home is ranked 36th out of 221 homes in Colorado. Shows this facility's occupancy rate versus the Colorado average, with its Statewide rank out of 221. Higher occupancy signals strong local demand and financial stability.Rankings are based only on facilities in Colorado that report data for that category. Facilities without available data are excluded from the ranking.Click the rank badge to see the full State ranking.Click here to see the full State ranking.
Avg. Length of Stay
130 days
Walk Score
Walk Score: 28 / 100 Rank #702 / 872Walk Score — State benchmarkedThis home is ranked 702nd out of 872 homes in Colorado. Shows how walkable this facility's neighborhood is compared to the average Walk Score across Colorado facilities. Higher scores benefit residents, families, and staff.Rankings are based only on facilities in Colorado that report data for that category. Facilities without available data are excluded from the ranking.Click the rank badge to see the full State ranking.Click here to see the full State ranking.
Somewhat walkable. A few nearby services may be reachable on foot, but most trips require transportation.

Contact Green House Homes at Mirasol

Penalties and fines

Federal penalties imposed by CMS for regulatory violations, including civil money penalties (fines) and denials of payment for new Medicare/Medicaid admissions.

Source: CMS Penalties Database

No penalties in the past 3 years

No civil money penalties or payment denials were reported in the last 3 years.

Quality of care over time

These measures show how residents usually do over time at this home, based on health outcomes and preventive care.

Long-stay resident measures
Significantly above average Info CMS star rating based on long-stay quality measure performance. 5 stars = significantly above average, 1 star = significantly below average.
Hospitalizations per 1,000 days Info Number of hospitalizations per 1,000 long-stay resident days. 0.91
30% better than Colorado average

Colorado average: 1.30

ED visits per 1,000 days Info Number of outpatient emergency department visits per 1,000 long-stay resident days. 1.48
11% better than Colorado average

Colorado average: 1.67

Short-stay resident measures
Above average Info CMS star rating based on short-stay quality measure performance. 5 stars = much above average, 1 star = much below average.
Re-hospitalized after SNF stay Info Percentage of short-stay residents who were re-hospitalized after their nursing home admission. 16.1%
21% better than Colorado average

Colorado average: 20.3%

Emergency department visits Info Percentage of short-stay residents who had an outpatient emergency department visit. 20.4%
59% worse than Colorado average

Colorado average: 12.8%

Falls with major injury Info Percentage of SNF residents who experience falls with major injury during their stay. 0.0%
100% better than Colorado average

Colorado average: 0.8%

Ability to care for self at discharge Info Percentage of residents at or above expected ability to care for themselves at discharge. 38.9%
28% worse than Colorado average

Colorado average: 53.7%

Successful return to home or community Info Rate of successful return to home or community from a skilled nursing facility. 63.7%
26% better than Colorado average

Colorado average: 50.6%

Breakdown by payment type

Medicare

38% of new residents, usually for short-term rehab.

Typical stay 25 days

Private pay

52% of new residents, often for short stays.

Typical stay 1 - 2 months

Medicaid

10% of new residents, often for long-term daily care.

Typical stay 2 years

Finances and operations

Based on CMS SNF Cost Report for fiscal year ending in 12/2023.

For-profit
Operated by a single business entity.
Net patient revenue Info Net patient revenue — what the home actually collects for resident care, after contractual allowances, bad debt and discounts are subtracted from its gross charges (CMS cost report, Worksheet G-3). It covers resident care only; money the home earns from other sources is shown separately as "Other income."
$11.4M
Net patient income Info Net patient income: net patient revenue minus the home's total operating expenses. A positive figure means it earns more from resident care than it spends to deliver it; a negative figure means the opposite. It excludes non-operating "other income."
-$3.5M
For-profit Operated by a single business entity.
Net patient revenue Info Net patient revenue — what the home actually collects for resident care, after contractual allowances, bad debt and discounts are subtracted from its gross charges (CMS cost report, Worksheet G-3). It covers resident care only; money the home earns from other sources is shown separately as "Other income."
$11.4M Rank #63 / 221Revenue — State benchmarkedThis home is ranked 63rd out of 221 homes in Colorado. Shows this facility's annual revenue compared to the Colorado average. Higher revenue generally means more resources for staffing and capital — read alongside Payroll %.Rankings are based only on facilities in Colorado that report data for that category. Facilities without available data are excluded from the ranking.Click the rank badge to see the full State ranking.Click here to see the full State ranking.
Net patient income Info Net patient income: net patient revenue minus the home's total operating expenses. A positive figure means it earns more from resident care than it spends to deliver it; a negative figure means the opposite. It excludes non-operating "other income."
-$3.5M
Other income Info Money the home earns outside of resident care — such as investments, grants, rentals and other non-operating sources (CMS cost report, Worksheet G-3). It is tracked separately from net patient revenue: it is not part of that figure, and it is not included in net patient income.
$131.4K
Payroll costs Info Staff salaries plus wage-related costs — benefits such as payroll taxes, health insurance and retirement — from the home's own accounting records (CMS cost report, Worksheet A). Contract or agency labor is counted separately, under other operating costs. Rank #32 / 221Payroll — State benchmarkedThis home is ranked 32nd out of 221 homes in Colorado. Shows total annual staff payroll benchmarked to the Colorado average. Higher payroll investment relative to peers often signals better staffing and less reliance on cheaper contract labor.Rankings are based only on facilities in Colorado that report data for that category. Facilities without available data are excluded from the ranking.Click the rank badge to see the full State ranking.Click here to see the full State ranking.
$7.8M 68.2% of net patient revenue Info Payroll as a share of revenue: staff salaries and wage-related benefits divided by net patient revenue. A higher figure means more of each revenue dollar goes to staff pay. Rank #46 / 221Payroll % — State benchmarkedThis home is ranked 46th out of 221 homes in Colorado. Shows payroll as a percentage of revenue versus the Colorado average. Well-run Colorado facilities typically land around 59–66% — the top third Statewide. Below 25% may signal understaffing or heavy agency use — read with Staffing ratings.Rankings are based only on facilities in Colorado that report data for that category. Facilities without available data are excluded from the ranking.Click the rank badge to see the full State ranking.Click here to see the full State ranking.
Other operating costs Info Everything it costs to run the home apart from payroll — food, utilities, supplies, maintenance, contract labor and administration. Calculated as total operating expense minus payroll (staff salaries and wage-related benefits).
$7.1M
Total costs Info The home's total operating expense for the year — all the costs of running it, salaries included (CMS cost report, Worksheet G-3).
$14.9M

What does this home offer?

Housing options icon

Housing Options: Private Rooms

Building type icon
Building type icon

Building Type: Single-story

Beauty services icon

Beauty Services

Transportation services icon

Transportation Services

Housekeeping icon
Housekeeping icon

Housekeeping Services

Social and recreational activities icon

Social and Recreational Activities

Rehabilitative support icon

Rehabilitative Support

On-site medical care and health services icon

On-site Medical Care and Health Services

Who this home usually serves

TYPE OF STAY

Mix of rehab and long-term care

This home supports both short-term rehab and long-term care, with residents staying for a wide range of durations.

Most new residents arrive under private pay (52% of admissions), and a typical private pay stay runs around 1 - 2 months.

Admissions
279 total

Coverage residents most often arrive under.

Medicare 38%
Private pay 52%
Medicaid 10%
Discharges
230 total

Coverage residents most often leave under.

Medicare 33%
Private pay 51%
Medicaid 16%

Places of interest near Green House Homes at Mirasol

Address 1.2 miles from city center Info Estimated distance in miles from Loveland's city center to Green House Homes at Mirasol's address, calculated via Google Maps.

Calculate Travel Distance to Green House Homes at Mirasol

Add your location

Address

Compare Nursing Homes around Loveland

The information below is reported by the Colorado Department of Public Health and Environment, Health Facilities Division.

3 facilities compared · CMS & CO Dept. of Health data

The Green House Homes at Mirasol
NH
HC
PC
Loveland
90
Facility 90
CO AVG 76
Rank #198 / 533
91.0%
Facility 91.0%
CO AVG 76.5%
Rank #36 / 221
+19%
6.27
Facility 6.27
CO AVG 3.86
Rank #7 / 215
-10%+62%
$7.5k
Facility $7.5k
CO AVG $39.2k
Rank #93 / 221
24
Facility 24
CO AVG 24.8
Rank #120 / 221
6.0
Facility 6.0
CO AVG 5.2
Rank #146 / 221
-86-
32
Facility 32
CO AVG 51
Rank #664 / 872
Loveland Elder Green House Homes For Life Enrichment A Colorado Non
$11.4M
Facility $11.4M
CO AVG $11.2M
Rank #63 / 221
$7.8M
Facility $7.8M
CO AVG $4.9M
Rank #32 / 221
68.2%
Facility 68.2%
CO AVG 46.6%
Rank #46 / 221
65412
North Shore Health and Rehabilitation Center
NH
MC
PC
Loveland
120
Facility 120
CO AVG 76
Rank #79 / 533
74.8%
Facility 74.8%
CO AVG 76.5%
Rank #128 / 221
-2%
4.06
Facility 4.06
CO AVG 3.86
Rank #58 / 215
+12%+5%
$0
Facility $0
CO AVG $39.2k
Rank #1 / 221
22
Facility 22
CO AVG 24.8
Rank #100 / 221
5.5
Facility 5.5
CO AVG 5.2
Rank #132 / 221
-90-
35
Facility 35
CO AVG 51
Rank #627 / 872
John Wilson
$11.5M
Facility $11.5M
CO AVG $11.2M
Rank #88 / 221
$8.1M
Facility $8.1M
CO AVG $4.9M
Rank #57 / 221
70.7%
Facility 70.7%
CO AVG 46.6%
Rank #33 / 221
65129
Riverbend Health and Rehabilitation Center
NH
NC
Loveland (Duffield Court)
100
Facility 100
CO AVG 76
Rank #161 / 533
72.4%
Facility 72.4%
CO AVG 76.5%
Rank #137 / 221
-5%
3.28
Facility 3.28
CO AVG 3.86
Rank #152 / 215
+6%-15%
$0
Facility $0
CO AVG $39.2k
Rank #1 / 221
22
Facility 22
CO AVG 24.8
Rank #100 / 221
7.3
Facility 7.3
CO AVG 5.2
Rank #183 / 221
279-
36
Facility 36
CO AVG 51
Rank #616 / 872
Rocky Mountain Snf Holdings LLC
$8.5M
Facility $8.5M
CO AVG $11.2M
Rank #129 / 221
$5.0M
Facility $5.0M
CO AVG $4.9M
Rank #143 / 221
58.8%
Facility 58.8%
CO AVG 46.6%
Rank #150 / 221
65165

Financial Assistance for
Nursing Home in Colorado

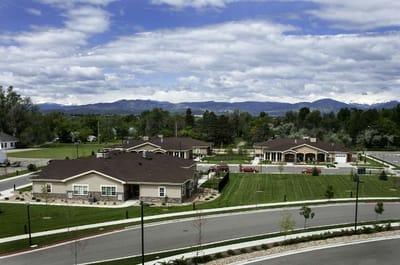
Green House Homes at Mirasol is located in Loveland, Colorado.
Here are the financial assistance programs available to residents in Colorado.

Get Financial aid guidance

Elderly, Blind, and Disabled Waiver

Colorado Medicaid EBD Waiver

Age 65+ or disabled
General Colorado resident, Medicaid- eligible, nursing home-level care need.
Income Limits (2025) ~$2,829/month 300% FBR, individual
Asset Limits $2,000 (individual), $3,000 (couple).
CO

Requires level-of-care assessment by case manager.

Benefits
Personal care (5-7 hours/day) Respite care (up to 240 hours/year) Adult day care ($65/day) Home modifications ($1,500 avg.)

Old Age Pension (OAP) Health Care Program

Colorado OAP

Age 60+
General Colorado resident.
Income Limits ~$1,215/month individual
Asset Limits $2,000 individual
CO

Supplements SSI; limited medical coverage.

Benefits
Cash (~$100-$800/month) Limited in-home care (2-3 hours/week) Medical assistance

Program of All-Inclusive Care for the Elderly (PACE)

Colorado Medicaid PACE

Age 55+
General Colorado resident, nursing home-level care need, safe with PACE support.
Income Limits (2025) ~$2,829/month 300% FBR
Asset Limits $2,000 (individual), $3,000 (couple).
CO

Limited to specific regions (e.g., Denver, Pueblo).

Benefits
All-inclusive care—personal care (5-7 hours/day) Meals Transportation Therapy Medical visits

Home Care Allowance (HCA)

Colorado Home Care Allowance (HCA)

Age
General Seniors typically 65+, Age 5+ with disability, Colorado resident, financial/functional need.
Income Limits (2025) ~$1,004/month individual, stricter than waivers
Asset Limits $2,000 (individual), $3,000 (couple).
CO

Must need help with ADLs; not Medicaid-waiver eligible.

Benefits
Personal care (~4-6 hours/day, paid to provider) E.g. Bathing Dressing

Frequently Asked Questions about Green House Homes at Mirasol

Is Green House Homes at Mirasol in a walkable area?

Green House Homes at Mirasol has a walk score of 28. Somewhat walkable. A few nearby services may be reachable on foot, but most trips require transportation.

What is the occupancy rate at Green House Homes at Mirasol?

Green House Homes at Mirasol's occupancy is 91.0%.

What is the best email address for Green House Homes at Mirasol?

The team at Green House Homes at Mirasol can be reached at [email protected].

Does Green House Homes at Mirasol operate as a for-profit or non-profit?

Green House Homes at Mirasol is registered as a for-profit.

Are there photos of Green House Homes at Mirasol?

Yes — there are 7 photos of Green House Homes at Mirasol in the photo gallery on this page.

What is the address of Green House Homes at Mirasol?

Green House Homes at Mirasol is located at 490 Mirasol Dr, Loveland, CO 80537.

What is the phone number of Green House Homes at Mirasol?

(970) 342-2400 will put you in contact with the team at Green House Homes at Mirasol.

Guides for Better Senior Living

Care Cost Calculator: See Prices in Your Area

Nursing Home Data Explorer

Don’t Wait Too Long: 7 Red Flag Signs Your Parent Needs Assisted Living Now

The True Cost of Assisted Living in 2025 – And How Families Are Paying For It

Understanding Senior Living Costs: Pricing Models, Discounts & Financial Assistance