Total health inspections
5
Montana average 5.1
Last Health inspection on Mar 2025

We arrange tours, appointments, and even moving support so you don’t have to
Thank you for your interest!
Our team will be in touch shortly to help with next steps.

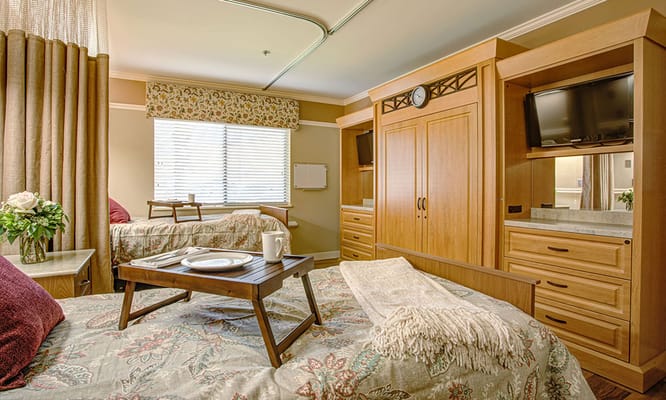
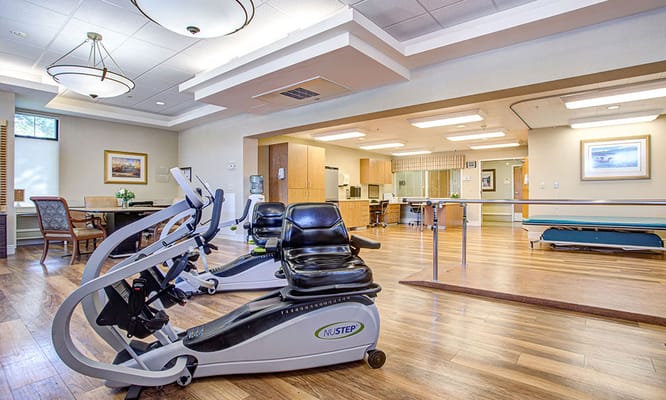

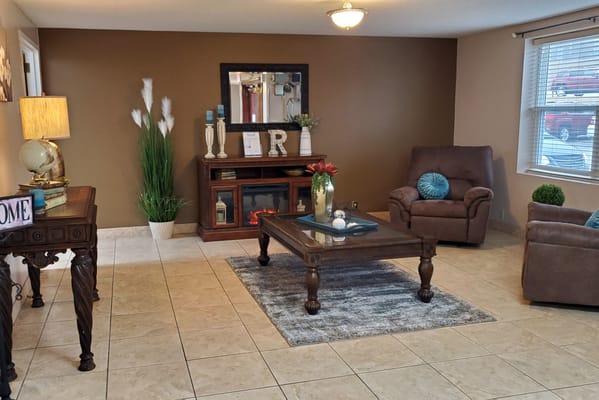

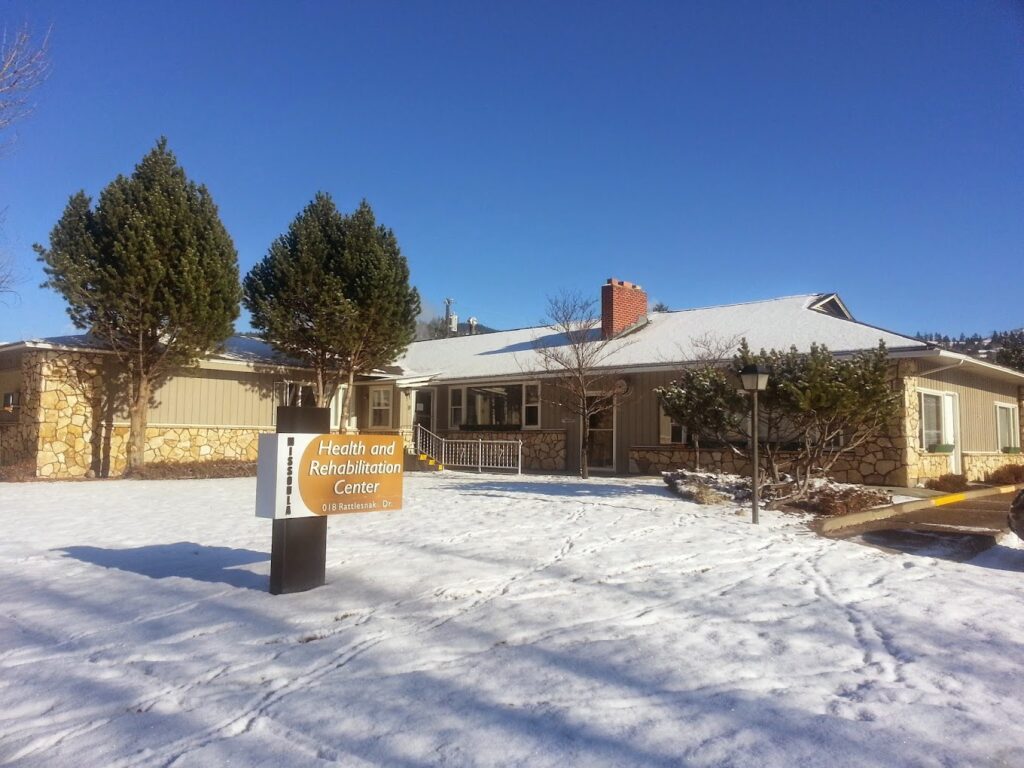
Riverside Nursing and Rehabilitation Center is the epitome of excellence when it comes to senior living care, as evidenced by its outstanding nursing home quality measures. Within this extraordinary community, exceptional standards are upheld to ensure that residents receive the utmost care and support they deserve. The ambiance exudes warmth and comfort, creating a welcoming environment that feels like home.
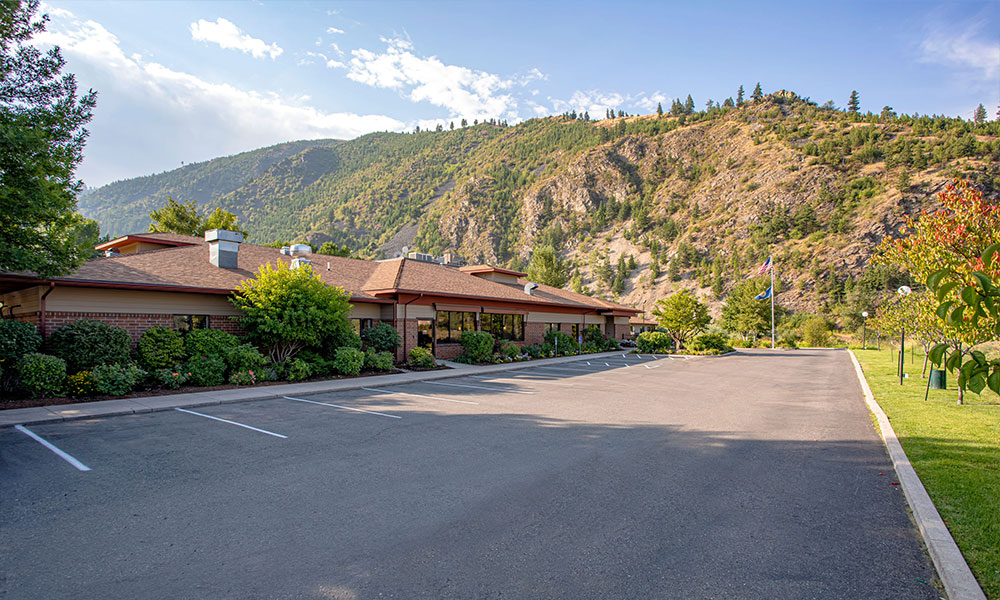
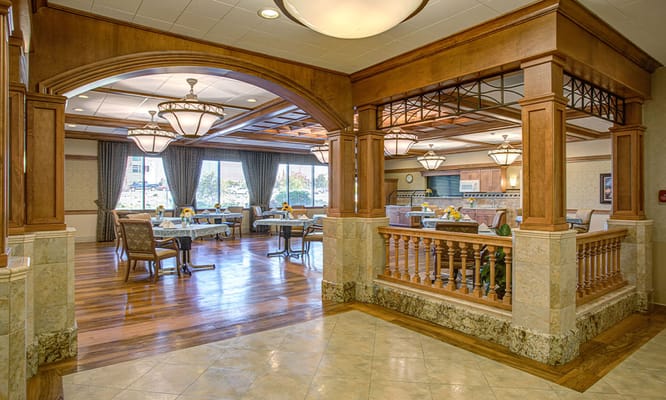
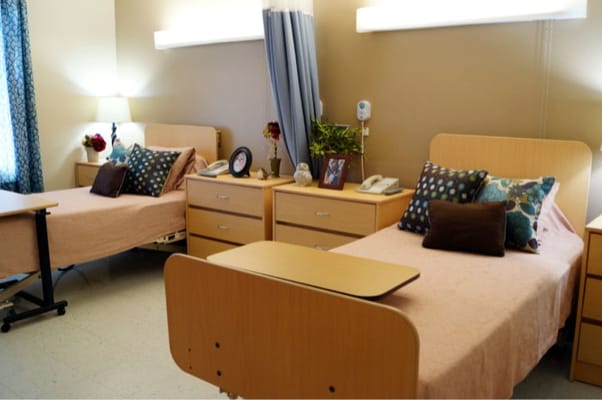
The dedicated team of professionals utilizes state-of-the-art equipment to deliver personalized treatment plans, all while maintaining the highest nursing home quality measures. These measures serve as a testament to the community’s commitment to providing superior care and achieving optimal outcomes for its residents. In addition to top-notch medical services, Riverside goes above and beyond to ensure resident satisfaction. The community values transparency and encourages open communication by actively seeking and addressing nursing home reviews. This commitment to ongoing improvement allows Riverside to continuously enhance its services, ensuring that residents receive the highest level of care and comfort.
Randy Sparks serves as the Executive Director at Riverside Nursing & Rehabilitation, LLC. He is dedicated to providing a pleasant, comfortable, and enjoyable stay for residents, whether short-term or long-term. Randy emphasizes compassionate, individualized care and takes pride in serving the community and veterans. He warmly invites visitors to explore the facility’s services and experience the supportive environment firsthand.
May offer a more intimate, personalized care environment.
Occupancy is moderate, suggesting balanced demand.
Most residents typically stay for a few weeks or months before returning home or moving on.
57% of new residents, usually for short-term rehab.
38% of new residents, often for short stays.
5% of new residents, often for long-term daily care.
Montana average 5.1
Last Health inspection on Mar 2025
Montana average 29.7
Montana average 5.72
Health citations are formal notices following inspections when they fail to comply with safety and care standards.
22 of 30 citations resulted from standard inspections; 7 of 30 resulted from complaint investigations; and 1 of 30 came from combined inspections (standard and complaint).
Montana average: 0.3
Montana average: 2.2
Data sourced from CMS Health Deficiencies reports. Citation severity codes range from A (least serious) to L (most serious). Immediate Jeopardy (J-L) citations indicate situations where the facility's noncompliance has placed residents at risk of death or serious harm.
Nursing Home Licensed facility providing 24/7 skilled nursing care for residents with complex, ongoing medical needs. Staffed by RNs, LPNs, and CNAs. Inspected and star-rated annually by CMS. Accepts Medicare (short-term rehab) and Medicaid (long-term care).
Assisted Living A licensed, long-term care setting for seniors or individuals with disabilities who need help with daily activities — like bathing, dressing, and medication management — but not 24-hour skilled nursing. Offers housing, meals, and around-the-clock support while aiming to maximize resident independence.
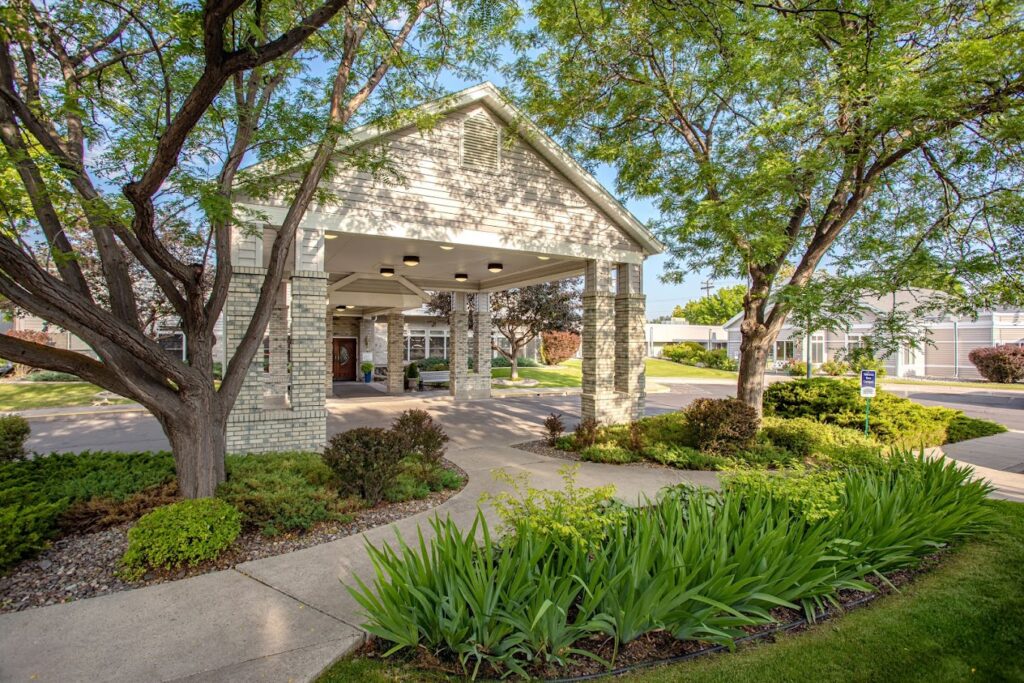
![]() 1.1 miles from city center — 1.26 miles to nearest hospital (Providence Wound Care Center)
1.1 miles from city center — 1.26 miles to nearest hospital (Providence Wound Care Center)
Add your location
This data corresponds to Q2 2025 and is based on CMS Payroll-Based Journal.
Montana average ratio: 1.77:1
Montana average: 8.6 hours
Manages medical care and health needs.
This role is partially covered by contractors.
Assists with medical care and medications.
This role is partially covered by contractors.
Helps with daily care and mobility.
This role is partially covered by contractors.
Total hours from contractors
3,146 contractor hours this quarter
| Certified Nursing Assistant | 61 | 24 | 85 | 14,913 | 91 | 100% | 7.8 |
| Registered Nurse | 10 | 10 | 20 | 4,918 | 91 | 100% | 9.4 |
| Licensed Practical Nurse | 4 | 10 | 14 | 1,653 | 90 | 99% | 8.3 |
| Medication Aide/Technician | 3 | 0 | 3 | 944 | 71 | 78% | 8 |
| Other Dietary Services Staff | 3 | 0 | 3 | 862 | 86 | 95% | 6.1 |
| Nurse Practitioner | 2 | 0 | 2 | 512 | 63 | 69% | 8 |
| Administrator | 1 | 0 | 1 | 504 | 63 | 69% | 8 |
| Physical Therapy Assistant | 0 | 4 | 4 | 439 | 64 | 70% | 6.7 |
| Dietitian | 1 | 0 | 1 | 408 | 51 | 56% | 8 |
| Qualified Activities Professional | 1 | 0 | 1 | 255 | 40 | 44% | 6.4 |
| Occupational Therapy Aide | 1 | 0 | 1 | 230 | 34 | 37% | 6.8 |
| Clinical Nurse Specialist | 1 | 0 | 1 | 196 | 26 | 29% | 7.5 |
| Mental Health Service Worker | 1 | 0 | 1 | 178 | 25 | 27% | 7.1 |
| Therapeutic Recreation Specialist | 0 | 1 | 1 | 169 | 39 | 43% | 4.3 |
| Qualified Social Worker | 0 | 1 | 1 | 88 | 32 | 35% | 2.7 |
| RN Director of Nursing | 1 | 0 | 1 | 80 | 10 | 11% | 8 |
| Speech Language Pathologist | 0 | 2 | 2 | 31 | 8 | 9% | 3.8 |
| Nurse Aide in Training | 1 | 0 | 1 | 25 | 4 | 4% | 6.2 |
| Respiratory Therapy Technician | 0 | 2 | 2 | 12 | 7 | 8% | 1.8 |
Source: CMS Long-Term Care Facility Characteristics (Data as of Jan 2026)
Residents meet regularly to discuss policies, care quality, and activities
Organized group of residents that meets regularly to discuss facility policies, quality of life, and activities.
Data sourced from CMS Long-Term Care Facility Characteristics quarterly report. Payer mix reflects the current resident census by primary payment source.
These measures show how residents usually do over time at this home, based on health outcomes and preventive care.
Montana average: 11.2
Montana average: 21.8
Montana average: 19.4%
Montana average: 20.8%
Montana average: 25.2%
Montana average: 4.3%
Montana average: 6.3%
Montana average: 2.8%
Montana average: 6.1%
Montana average: 4.7%
Montana average: 19.1%
Montana average: 93.8%
Montana average: 93.7%
Montana average: 1.27
Montana average: 2.17
Montana average: 76.4%
Montana average: 1.8%
Montana average: 73.8%
Montana average: 19.4%
Montana average: 15.0%
Montana average: 0.8%
Montana average: 53.7%
Montana average: 50.6%
Quality measures are calculated from Minimum Data Set (MDS) assessments. For most measures, lower percentages indicate better care quality.
Federal penalties imposed by CMS for regulatory violations, including civil money penalties (fines) and denials of payment for new Medicare/Medicaid admissions.
Source: CMS Penalties Database (Data as of Jan 2026)
Montana average: $87K
Montana average: 2.3
Montana average: 0.2
Penalties are imposed by CMS for violations of federal nursing home regulations.
Last updated: Jan 2026
Historical financial and operational data for Riverside Nursing and Rehabilitation Center based on CMS SNF Cost Reports.
Loading trend charts...
Care Cost Calculator: See Prices in Your Area
Nursing Home Data Explorer
Don’t Wait Too Long: 7 Red Flag Signs Your Parent Needs Assisted Living Now
The True Cost of Assisted Living in 2025 – And How Families Are Paying For It
Understanding Senior Living Costs: Pricing Models, Discounts & Financial Assistance

Touring a community? Use this expert-backed checklist to stay organized, ask the right questions, and find the perfect fit.
We'll send you a PDF version of the touring checklist.