


Total health inspections
9
Ohio average 6.7
Last Health inspection on Dec 2024
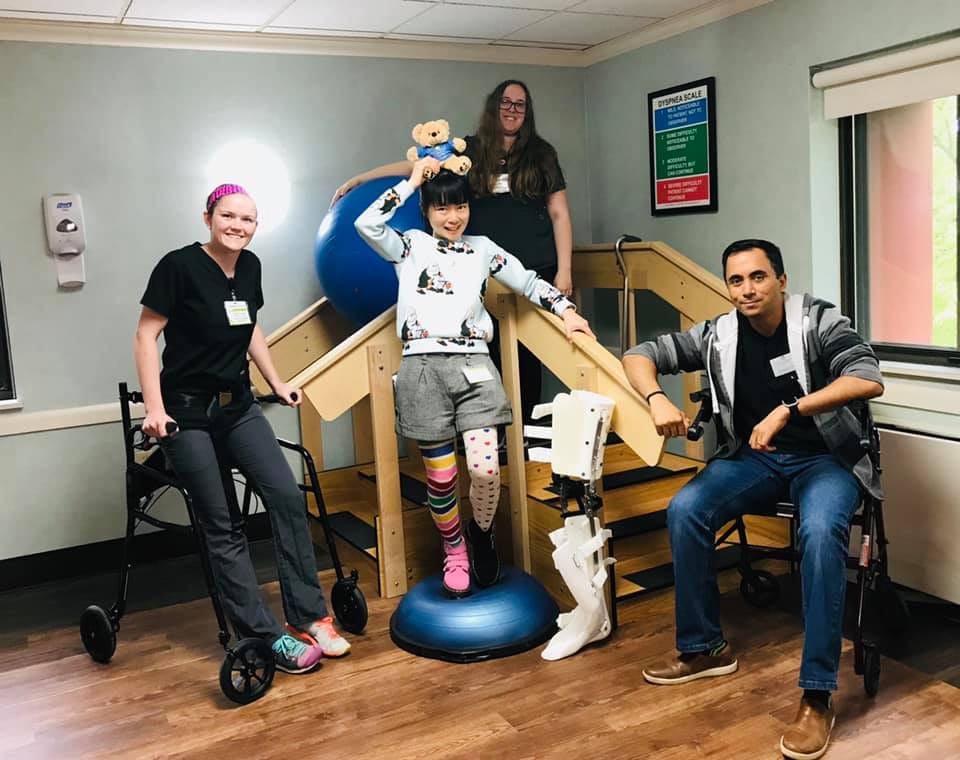

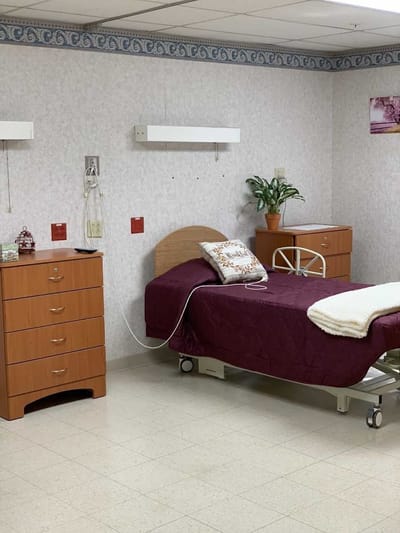
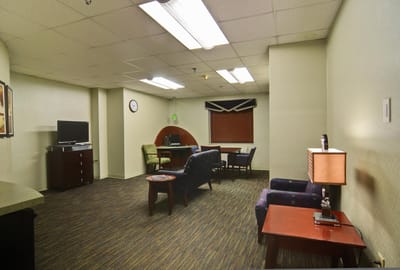

Nestled in Cleveland, Rocky River Gardens is a short-term rehabilitation and skilled nursing facility with extensive medical services that ensures comprehensive on-site support. With the goal of rehabilitating patients to independence, their expert care partners endeavor to build personalized plans to promote the fullest extent of well-being. They nurture patients holistically as they also offer a range of services to help residents and families navigate the complex healthcare system and access resources vital for recovery.
In addition to the professional care given by staff, the activities and amenities available at Rocky River Garden include social functions, beauty shops, live entertainment, community support, and life-enrichment programs. This community is committed to serving seniors to reach the maximum quality of life possible.
| Staff type | Hours / Day / Resident | vs state avg |
|---|---|---|
|
Registered Nurse (RN)
| 20m per day | ▼ 48% State avg: 38m per day · National avg: 41m per day |
|
LPN / LVN
| 1h 3m per day | ▲ 9% State avg: 58m per day · National avg: 52m per day |
|
Nurse Aide
| 1h 53m per day | ▼ 11% State avg: 2h 8m per day · National avg: 2h 21m per day |
|
Weekend Total Nursing
| 2h 52m per day | ▼ 13% State avg: 3h 17m per day · National avg: 3h 26m per day |
|
Physical Therapist
| 3m per day | ▲ 13% State avg: 3m per day · National avg: 4m per day |
|
Weekend RN
| 10m per day | ▼ 61% State avg: 25m per day · National avg: 29m per day |
In Ohio, the Department of Health, Bureau of Survey and Certification conducts unannounced onsite inspections to evaluate the quality of care and environment in all licensed facilities.
Citations
| This Facility | OH Average | vs. OH Avg |
|---|---|---|---|
|
Total citations
| 41 | 2 | This facility has 1950% more total citations than a typical Ohio nursing home (41 vs. OH avg 2).↑ 1950% worse |
Ohio average 6.7
Last Health inspection on Dec 2024
Ohio average 30.9
Ohio average 4.59
Health citations are formal notices following inspections when they fail to comply with safety and care standards.
29 of 39 citations resulted from standard inspections; 8 of 39 resulted from complaint investigations; and 2 of 39 came from combined inspections (standard and complaint).
Ohio average: 0.3
Ohio average: 0.9
Reporting period: October 1 – December 31, 2025 (Q4 2025). Source: CMS Payroll-Based Journal report.
Manages medical care and health needs.
Assists with medical care and medications.
Helps with daily care and mobility.
Total hours from contractors
3,145 contractor hours this quarter
| Certified Nursing Assistant | 48 | 0 | 48 | 14,908 | 92 | 100% | 8.2 |
| Licensed Practical Nurse | 32 | 0 | 32 | 8,565 | 92 | 100% | 8.7 |
| Registered Nurse | 7 | 6 | 13 | 1,984 | 89 | 97% | 9.1 |
| Other Dietary Services Staff | 4 | 0 | 4 | 1,298 | 89 | 97% | 7.2 |
| Speech Language Pathologist | 0 | 2 | 2 | 748 | 78 | 85% | 6 |
| Medication Aide/Technician | 0 | 2 | 2 | 516 | 37 | 40% | 13.5 |
| Mental Health Service Worker | 1 | 0 | 1 | 460 | 54 | 59% | 8.5 |
| Respiratory Therapy Technician | 0 | 2 | 2 | 459 | 60 | 65% | 7.7 |
| Physical Therapy Aide | 0 | 2 | 2 | 457 | 67 | 73% | 6.6 |
| Clinical Nurse Specialist | 1 | 0 | 1 | 438 | 61 | 66% | 7.2 |
| Administrator | 1 | 0 | 1 | 435 | 58 | 63% | 7.5 |
| Dietitian | 1 | 0 | 1 | 399 | 63 | 68% | 6.3 |
| Nurse Practitioner | 2 | 0 | 2 | 253 | 35 | 38% | 7.2 |
| Occupational Therapy Aide | 0 | 1 | 1 | 188 | 33 | 36% | 5.7 |
| Qualified Social Worker | 0 | 2 | 2 | 47 | 35 | 38% | 1.3 |
| Medical Director | 0 | 1 | 1 | 12 | 6 | 7% | 2 |
| Occupational Therapy Assistant | 0 | 1 | 1 | 10 | 3 | 3% | 3.2 |
| Physical Therapy Assistant | 0 | 2 | 2 | 8 | 9 | 10% | 0.8 |
Includes penalties issued in 2024
Federal penalties imposed by CMS for regulatory violations, including civil money penalties (fines) and denials of payment for new Medicare/Medicaid admissions.
Source: CMS Penalties Database (Data as of Jan 2026)
Ohio average: $69K
Ohio average: 1.9
Ohio average: 0.5
Penalties are imposed by CMS for violations of federal nursing home regulations.
4 penalties in the past 3 years
Multiple penalties were reported in the last 3 years.
Last updated: Jan 2026
These measures show how residents usually do over time at this home, based on health outcomes and preventive care.
Ohio average: 5.8
Ohio average: 12.7
Ohio average: 6.8%
Ohio average: 8.9%
Ohio average: 22.0%
Ohio average: 3.4%
Ohio average: 3.9%
Ohio average: 0.5%
Ohio average: 6.2%
Ohio average: 24.0%
Ohio average: 8.4%
Ohio average: 92.4%
Ohio average: 94.5%
Ohio average: 1.77
Ohio average: 1.83
Ohio average: 78.0%
Ohio average: 1.3%
Ohio average: 75.6%
Ohio average: 0.8%
Quality measures are calculated from Minimum Data Set (MDS) assessments. For most measures, lower percentages indicate better care quality.
7% of new residents, usually for short-term rehab.
68% of new residents, often for short stays.
24% of new residents, often for long-term daily care.
Source: CMS Long-Term Care Facility Characteristics (Data as of Jan 2026)
Residents meet regularly to discuss policies, care quality, and activities
Organized group of residents that meets regularly to discuss facility policies, quality of life, and activities.
Data sourced from CMS Long-Term Care Facility Characteristics quarterly report. Payer mix reflects the current resident census by primary payment source.
Historical financial and operational data for Rocky River Gardens Rehabilitation & Nursing Center from 2012–2023, based on CMS SNF Cost Reports.
Key figures below are for fiscal year ending in 12/2023.
Based on CMS SNF Cost Report for fiscal year ending in 12/2023.
Most residents stay long-term, while a smaller portion are admitted for short-term rehab.
Most new residents arrive under private pay (68% of admissions), and a typical private pay stay runs around 5 - 6 months.
Coverage residents most often arrive under.
Coverage residents most often leave under.
![]() 7.6 miles from city center
7.6 miles from city center
![]() Estimated distance in miles from Cleveland's city center to Rocky River Gardens Rehabilitation & Nursing Center's address, calculated via Google Maps.
— 0.47 miles to nearest hospital (Cleveland Clinic Fairview Hospital)
Estimated distance in miles from Cleveland's city center to Rocky River Gardens Rehabilitation & Nursing Center's address, calculated via Google Maps.
— 0.47 miles to nearest hospital (Cleveland Clinic Fairview Hospital)
Add your location
Info below is compiled from CMS reports & the OH Dept. of Health, senior community websites & trusted data sources such as Walk Score & BBB.
Communities are listed from highest to lowest based on our ranking methodology.
| O‘Neill Healthcare Fairview Park | NH HOS SNF | Fairview Park | 118
Facility
118
OH AVG
75
Rank
#47 / 309 |
77.1%
Facility
77.1%
OH AVG
81.7
Rank
#103 / 138 | -6% | 3.20
Facility
3.20
OH AVG
3.54
Rank
#128 / 182 | -22% | -10% | $0
Facility
$0
OH AVG
$74.0k
Rank
#1 / 183 | 11
Facility
11
OH AVG
30.9
Rank
#26 / 183 | 1.8
Facility
1.8
OH AVG
4.6
Rank
#8 / 183 | - | 91 | A+ |
66
Facility
66
OH AVG
40
Rank
#94 / 704 | Jenna Elliott | $11.7MFiscal year ending 12/2023
Facility
$11.7MFiscal year ending 12/2023
OH AVG
$10.1M
Rank
#50 / 183 | $5.3MFiscal year ending 12/2023
Facility
$5.3MFiscal year ending 12/2023
OH AVG
$3.9M
Rank
#95 / 183 | 45%Fiscal year ending 12/2023
Facility
45%Fiscal year ending 12/2023
OH AVG
40.2%
Rank
#175 / 183 | 366428 | ||||
| Algart Health Care | NH AL HOS MC RC SNF | Cleveland (Edgewater) | 36
Facility
36
OH AVG
75
Rank
#258 / 309 | - | - | 4.17
Facility
4.17
OH AVG
3.54
Rank
#29 / 182 | -44% | +18% | $0
Facility
$0
OH AVG
$74.0k
Rank
#1 / 183 | 11
Facility
11
OH AVG
30.9
Rank
#26 / 183 | 5.5
Facility
5.5
OH AVG
4.6
Rank
#143 / 183 | - | 71 | - |
62
Facility
62
OH AVG
40
Rank
#136 / 704 | Garth Ireland | $7.0MFiscal year ending 12/2023
Facility
$7.0MFiscal year ending 12/2023
OH AVG
$10.1M
Rank
#94 / 183 | $3.1MFiscal year ending 12/2023
Facility
$3.1MFiscal year ending 12/2023
OH AVG
$3.9M
Rank
#150 / 183 | 44.1%Fiscal year ending 12/2023
Facility
44.1%Fiscal year ending 12/2023
OH AVG
40.2%
Rank
#180 / 183 | 366308 | ||||
| Judson Park | NH AL HOS IL MC SNF | Cleveland (University Circle) | 36
Facility
36
OH AVG
75
Rank
#258 / 309 |
79.7%
Facility
79.7%
OH AVG
81.7
Rank
#97 / 138 | -2% | 6.53
Facility
6.53
OH AVG
3.54
Rank
#2 / 182 | -64% | +84% | $25.8k
Facility
$25.8k
OH AVG
$74.0k
Rank
#150 / 183 | 10
Facility
10
OH AVG
30.9
Rank
#23 / 183 | 2.5
Facility
2.5
OH AVG
4.6
Rank
#23 / 183 | 2 | 29 | - |
65
Facility
65
OH AVG
40
Rank
#107 / 704 | Judson | $22.8MFiscal year ending 12/2023
Facility
$22.8MFiscal year ending 12/2023
OH AVG
$10.1M
Rank
#5 / 183 | $13.9MFiscal year ending 12/2023
Facility
$13.9MFiscal year ending 12/2023
OH AVG
$3.9M
Rank
#4 / 183 | 60.7%Fiscal year ending 12/2023
Facility
60.7%Fiscal year ending 12/2023
OH AVG
40.2%
Rank
#135 / 183 | 365870 | ||||
| Mount Alverna Village | NH AL IL MC RC SNF | Parma | 153
Facility
153
OH AVG
75
Rank
#11 / 309 |
92.1%
Facility
92.1%
OH AVG
81.7
Rank
#32 / 138 | +13% | 4.22
Facility
4.22
OH AVG
3.54
Rank
#29 / 182 | -36% | +19% | $0
Facility
$0
OH AVG
$74.0k
Rank
#1 / 183 | 20
Facility
20
OH AVG
30.9
Rank
#56 / 183 | 2.5
Facility
2.5
OH AVG
4.6
Rank
#23 / 183 | - | 141 | - |
16
Facility
16
OH AVG
40
Rank
#574 / 704 | Annette Shoemaker | $25.0MFiscal year ending 06/2024
Facility
$25.0MFiscal year ending 06/2024
OH AVG
$10.1M
Rank
#1 / 183 | $14.7MFiscal year ending 06/2024
Facility
$14.7MFiscal year ending 06/2024
OH AVG
$3.9M
Rank
#2 / 183 | 58.7%Fiscal year ending 06/2024
Facility
58.7%Fiscal year ending 06/2024
OH AVG
40.2%
Rank
#182 / 183 | 366071 | ||||
| Rocky River Gardens Rehabilitation & Nursing Center | NH HOS MC PC SNF | Cleveland (Kamm's Corners) | 120
Facility
120
OH AVG
75
Rank
#42 / 309 |
80.8%
Facility
80.8%
OH AVG
81.7
Rank
#91 / 138 | -1% | 3.35
Facility
3.35
OH AVG
3.54
Rank
#100 / 182 | +19% | -5% | $104.7k
Facility
$104.7k
OH AVG
$74.0k
Rank
#169 / 183 | 39
Facility
39
OH AVG
30.9
Rank
#139 / 183 | 4.3
Facility
4.3
OH AVG
4.6
Rank
#99 / 183 | 5 | 97 | A+ |
48
Facility
48
OH AVG
40
Rank
#276 / 704 | Chickiestrong Rocky River LLC | $11.0MFiscal year ending 12/2023
Facility
$11.0MFiscal year ending 12/2023
OH AVG
$10.1M
Rank
#77 / 183 | $5.5MFiscal year ending 12/2023
Facility
$5.5MFiscal year ending 12/2023
OH AVG
$3.9M
Rank
#53 / 183 | 49.6%Fiscal year ending 12/2023
Facility
49.6%Fiscal year ending 12/2023
OH AVG
40.2%
Rank
#42 / 183 | 365392 |
Rocky River Gardens Rehabilitation & Nursing Center is located in Cleveland, Ohio.
Here are the financial assistance programs available to residents in Ohio.
Rocky River Gardens Rehabilitation & Nursing Center is in the Kamm's Corners neighborhood of Cleveland.
Rocky River Gardens Rehabilitation & Nursing Center has a walk score of 48. Somewhat walkable. A few nearby services may be reachable on foot, but most trips require transportation.
Rocky River Gardens Rehabilitation & Nursing Center's occupancy is 84.9%.
Rocky River Gardens Rehabilitation & Nursing Center has been operating for approximately 9 years, based on available licensing and registration records.
No, Rocky River Gardens Rehabilitation & Nursing Center has a no-pet policy.
Rocky River Gardens Rehabilitation & Nursing Center is registered as a for-profit in OH.
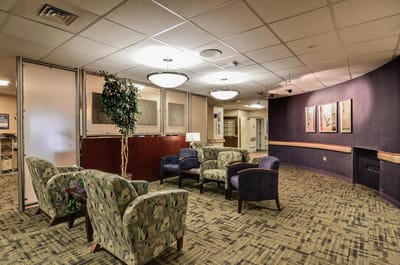
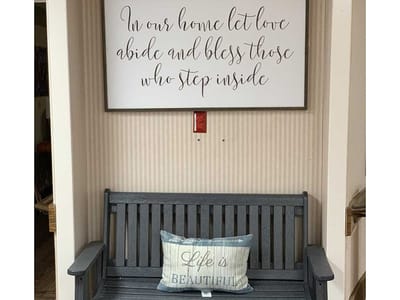
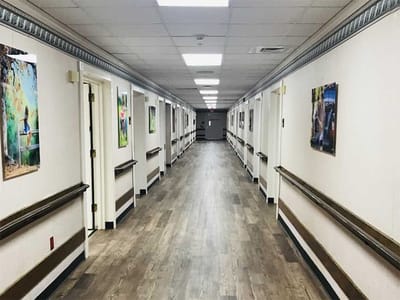
Yes — there are 8 photos of Rocky River Gardens Rehabilitation & Nursing Center in the photo gallery on this page.
Care Cost Calculator: See Prices in Your Area
Nursing Home Data Explorer
Don’t Wait Too Long: 7 Red Flag Signs Your Parent Needs Assisted Living Now
The True Cost of Assisted Living in 2025 – And How Families Are Paying For It
Understanding Senior Living Costs: Pricing Models, Discounts & Financial Assistance


