Roosevelt Care Centers

Nursing Home
Overview of Roosevelt Care Centers

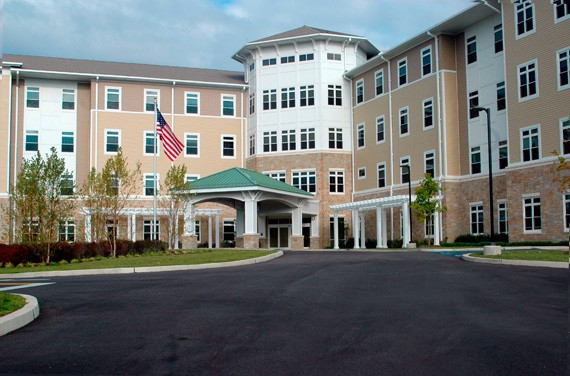
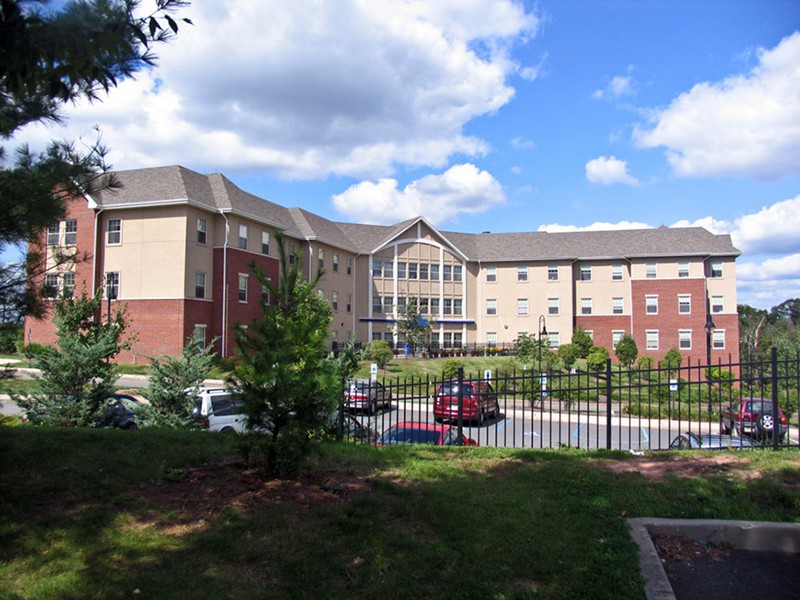
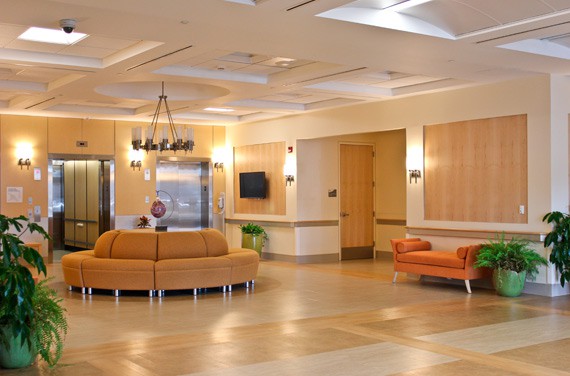
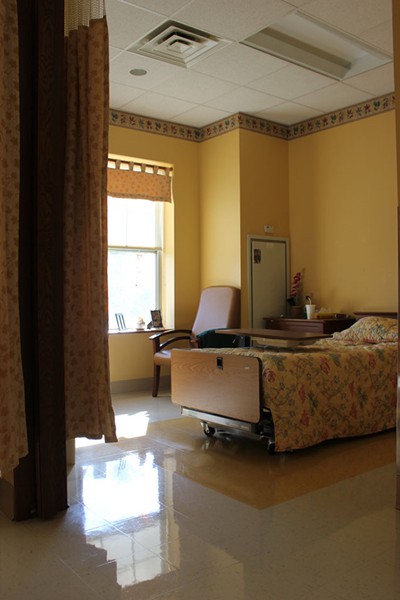
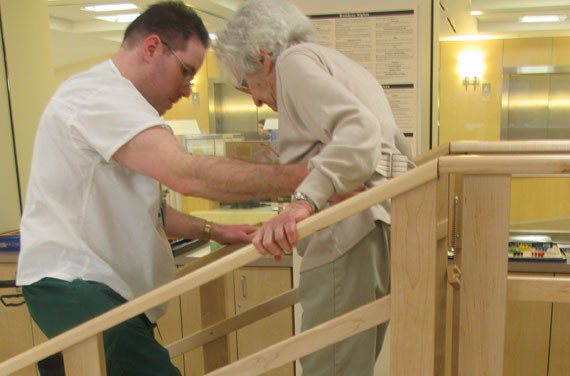
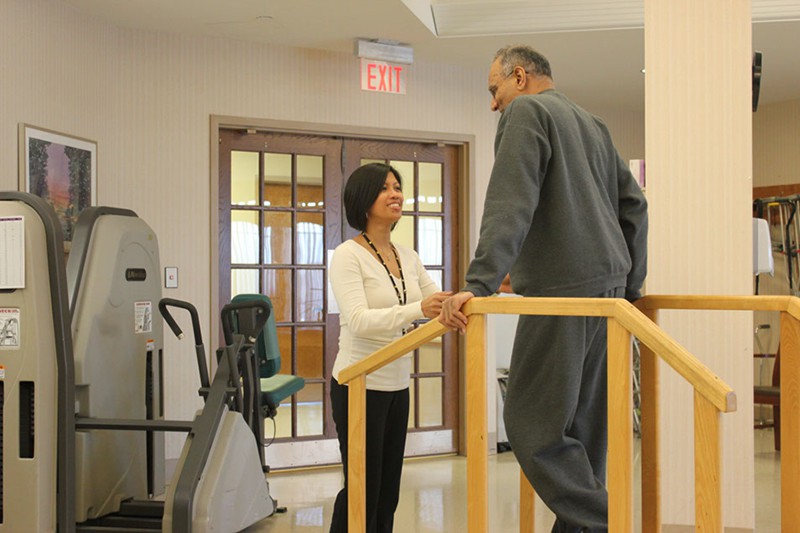
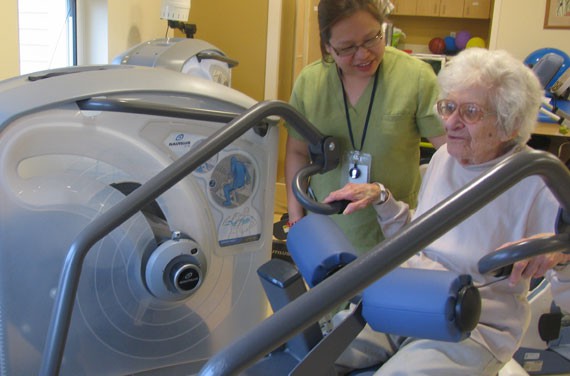
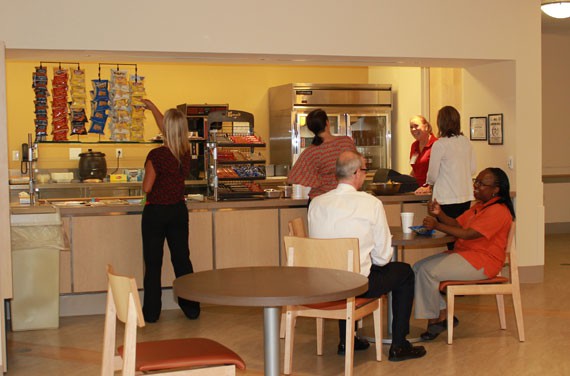
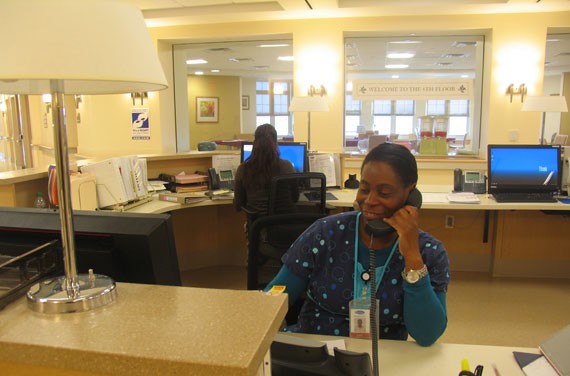
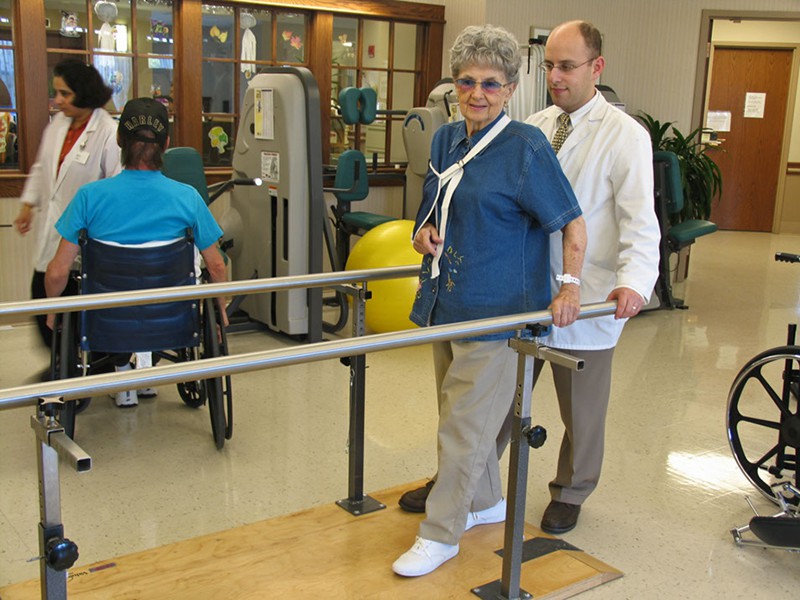
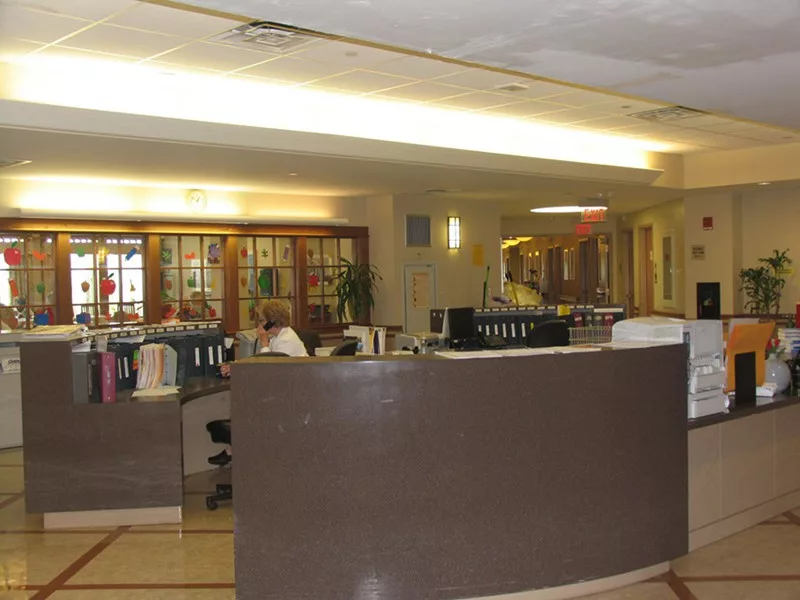
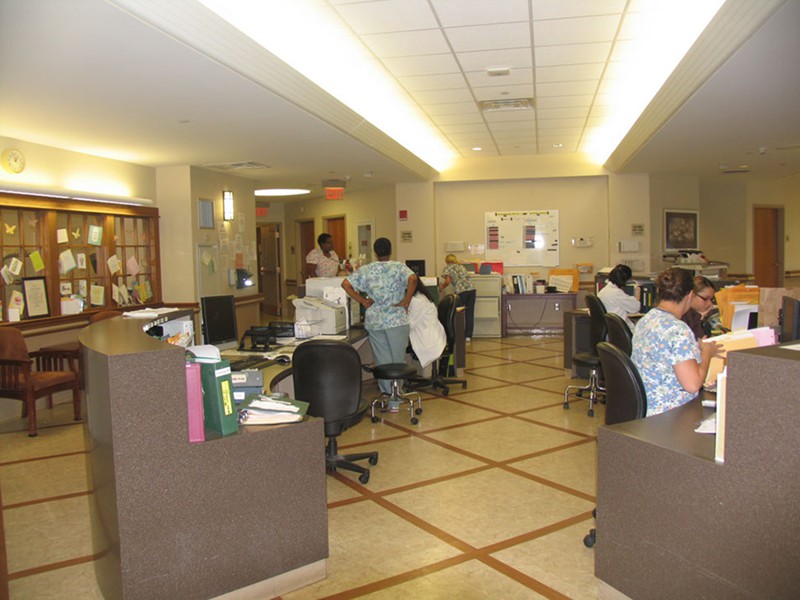
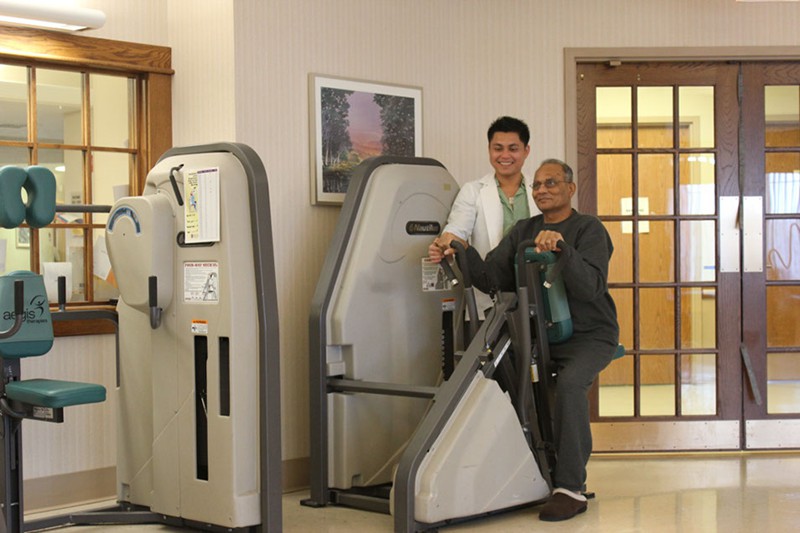
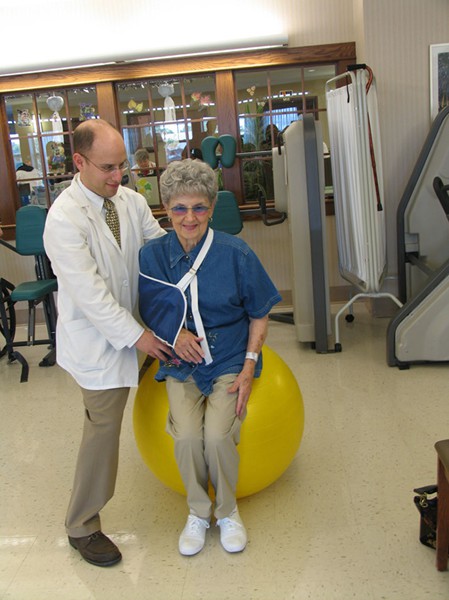
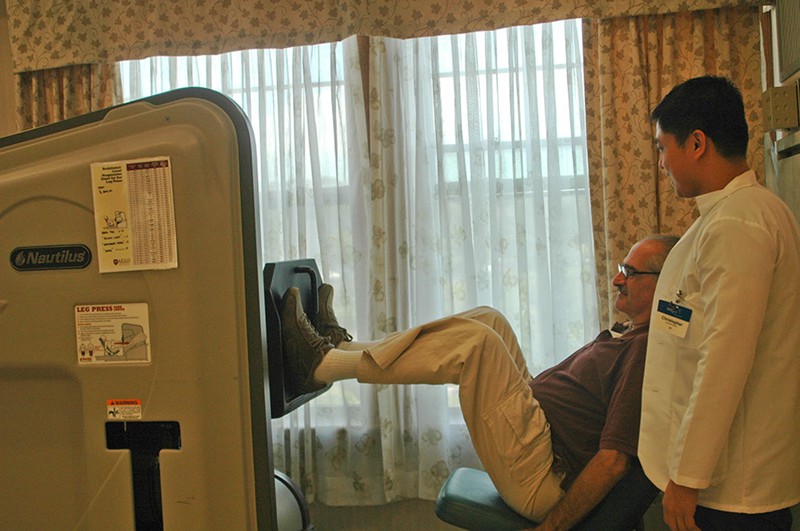
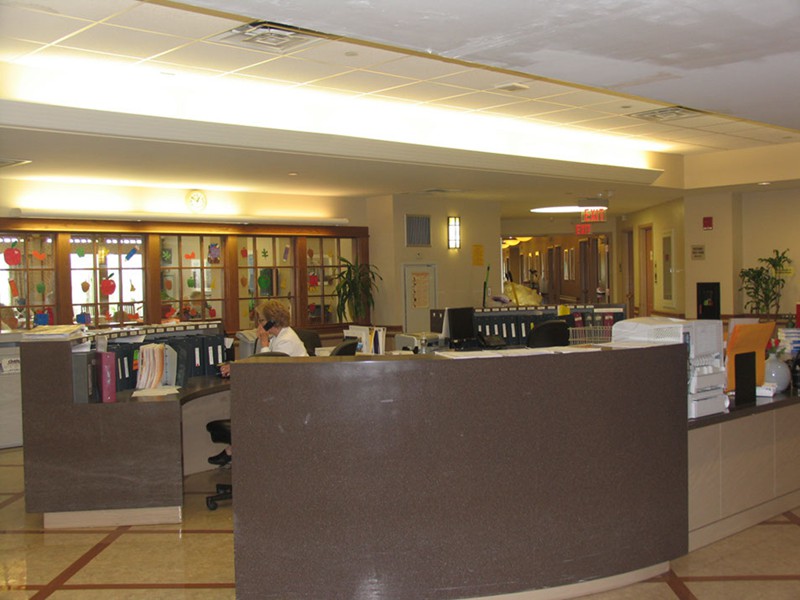
Situated in Edison, New Jersey, Roosevelt Care Centers is a renowned healthcare provider for seniors, offering a plethora of exceptional services. The facility is celebrated for its delightful cuisine and welcoming staff, creating a comfortable and appealing environment for residents. With a team of dedicated doctors and nurses, the center prioritizes individual needs, particularly excelling in the expertise of its physical therapy staff.

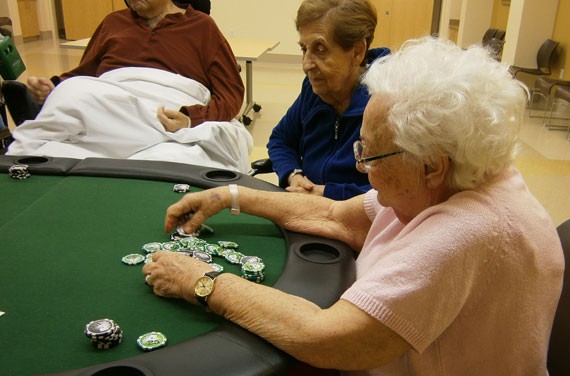
Roosevelt Care Centers goes beyond basic care, providing a variety of engaging activities to keep residents actively involved. The facility is known for offering genuine and special comfort, demonstrating a commitment that surpasses expectations. Residents can trust Roosevelt Care Centers senior living for a comprehensive and supportive healthcare experience that prioritizes both their physical well-being and overall contentment.

(732) 321-6800

Quality ratings

Measured by Centers for Medicare & Medicaid Services (CMS)

Overall rating Info Official CMS rating based on health inspections, staffing and quality measures.
4/5
New Jersey average: 3.3/5
Health Inspection Info Official CMS rating based on deficiencies found during state health inspections.
2/5
New Jersey average: 2.8/5
Staffing Info Official CMS rating based on nurse staffing hours per resident per day.
5/5
New Jersey average: 3.0/5
Quality Measures Info Official CMS rating based on clinical outcomes for residents.
5/5
New Jersey average: 4.3/5

Nursing care per resident

Info Average daily nursing hours per resident (adjusted for acuity). Higher values indicate more nursing time per resident.
4h 36m per day

This home provides 18% more nursing time per resident than the state average.

New Jersey average: 3h 53m per day

Staffing hours breakdown

Info Hours of care per resident per day, broken down by staff type. Data from CMS Medicare.
Staff type Facility State avg National avg
Registered Nurse (RN) Info Registered nurse hours per resident per day. 48m per day 41m per day 41m per day
LPN / LVN Info Licensed Practical Nurse / Licensed Vocational Nurse hours per resident per day. 1h 17m per day 56m per day 52m per day
Nurse Aide Info Nurse aide hours per resident per day. 2h 38m per day 2h 14m per day 2h 21m per day
Total Nursing (Weekend) Info Total number of nurse staff hours per resident per day on weekends. 4h 25m per day 3h 27m per day 3h 26m per day
Physical Therapist Info Physical therapist staff hours per resident per day. 6m per day 6m per day 4m per day
RN (Weekend) Info Registered nurse hours per resident per day on weekends. 36m per day 29m per day 29m per day

Capacity and availability

High-capacity home

May provide extensive amenities, services and programs.

Total beds 362

This home usually has availability

Lower occupancy suggests more openings may be available.

Lower demand than the New Jersey average
Occupancy rate 46%
Residents per day (avg) 155
Occupancy rate
46%
Residents per day (avg)
155

Who this home usually serves

TYPE OF STAY

Mostly short-term rehab stays

Most residents typically stay for a few weeks or months before returning home or moving on.

Might be optimal for
Short stays Recovery Medicare-covered care

Breakdown by payment type

Medicare

58% of new residents, usually for short-term rehab.

Typical stay 1 - 2 months

Private pay

38% of new residents, often for short stays.

Typical stay 1 - 2 months

Medicaid

4% of new residents, often for long-term daily care.

Typical stay 7 years

Finances and operations

Governmental home
County
Home revenue
$32.6M
Operating deficit
-$1.2M
Governmental home County
Home revenue
$32,597,224.00
Operating deficit
$-1,161,655.00
Payroll costs Info The portion of the home's budget spent on staff, including nurses, caregivers, and other employees who support care and operations.
$8.8M
26.9% of revenue
Other operating costs Info All remaining costs needed to run the home, such as food, utilities, building maintenance, supplies and administrative expenses.
$25.0M
Total costs $33.8M
Bed community size
362-bed community
A large-scale community that may provide a wide range of amenities, services, and structured programs.
Walk Score
Walk Score: 74 / 100
Very walkable. Most errands can be accomplished on foot, and many essentials are within a short walk.
BBB Rating
BBB Rating: A (Not Accredited)
An independent rating from the Better Business Bureau based on factors such as complaint history, transparency, and business practices.
How BBB ratings work

About this community

Occupancy Rate
44%
Occupied Beds
158 of 362
Percentage of available beds currently in use by residents.
License Status
Active
Facility Type
Long Term Care Facility
License Expiration
June 30, 2026

Additional licensing details

License number: 21203
CMS Certification Number: 315039

Ownership & operating entity

Roosevelt Care Centers is legally operated by MIDDLESEX COUNTY IMPROVEMENT AUTHORITY, and administrated by Mr. MARK SORRENTO.

Officers

Info Officers are individuals or entities with formal legal or financial responsibility for the organization that owns this facility

Mr . Anthony Racznski, Mr . Charles Tomaro, Ms . Christine D\'agaastino, James Nolan, Mr . Jose Jimenez JR, Mr . Paul Abbey

Type Of Units

Long Term Care
362 units
Total beds
362 units

Care Services

Nursing Services
Rehabilitation Services
Respite Care
Memory Care
Licensed Nurses/CNAs

All Levels of Care

Long-term care
Dementia/Alzheimer's care
Subacute care
Respite care
Hospice care

Programs & Activities

Specific Programs
Long-term care, Dementia/Alzheimer's care, Subacute care, Respite care, Hospice care

Types of Care at Roosevelt Care Centers

Skilled Nursing
Contact Roosevelt Care Centers

Inspection History

In New Jersey, the Department of Health, Health Facilities Evaluation and Licensing conducts mandatory unannounced surveys to ensure facilities provide safe and effective resident care.

14 visits/inspections

3 complaint inspections

11 routine inspections

Routine Scope And Severity F – Moderate Concern

On a scale from A (least severe) to L (most severe).

Latest inspection

Date:November 20, 2025

30 deficiencies

Deficiencies indicate regulatory issues. A higher number implies the facility had several areas requiring improvement.

36 deficiencies identified during routine visits

Deficiencies indicate regulatory issues. A higher number implies the facility had several areas requiring improvement.

Compare Nursing Homes around Edison

The information below is reported by the New Jersey Department of Health, Health Facilities Evaluation and Licensing.
Brighton Gardens of Edison
AL

Assisted Living For seniors needing help with daily tasks but not full-time nursing.

HC

Hospice Care

IL

Independent Living For self-sufficient seniors seeking community and minimal assistance.

MC

Memory Care Specialized care for those with Memory Loss, Alzheimer's, or dementia, ensuring safety and support.

Edison
124
Yes
A+
64
BORGES, TRACEY
90.5%
$16,512,470.00
$6,864,569.00
41.6%
24.00
4/5
4.9040
3/5
5/5
4/5
1
17
1
+75%
+26%
+18%
Roosevelt Care Centers
SNF

Nursing Homes 24/7 care needed

Edison
356
No
A
74
MIDDLESEX COUNTY IMPROVEMENT AUTHORITY
46.0%
$31,462,703.00
$8,773,945.00
27.9%
154.80
4/5
4.5922
2/5
5/5
5/5
1
26
1
-39%
+18%
-40%
CareOne at The Highlands
SNF

Nursing Homes 24/7 care needed

RC

Respite Care

Edison
122
No
A+
4
CARE ONE AT BIRCHWOOD LLC
84.4%
$27,922,064.00
$8,945,645.00
32%
89.90
3/5
3.9056
3/5
4/5
4/5
-
27
-
-8%
+1%
+10%
Embassy Manor At Edison Nursing and Rehabilitation
SNF

Nursing Homes 24/7 care needed

Edison
280
No
A+
38
EDISON HEALTHCARE LLC
-
-
-
-
-
-
-
-
-
-
-
-
-
-
-
-

Places of interest near Roosevelt Care Centers

Address 5.9 miles from city center — 0.85 miles to nearest hospital (HMH JFK University Medical Center)
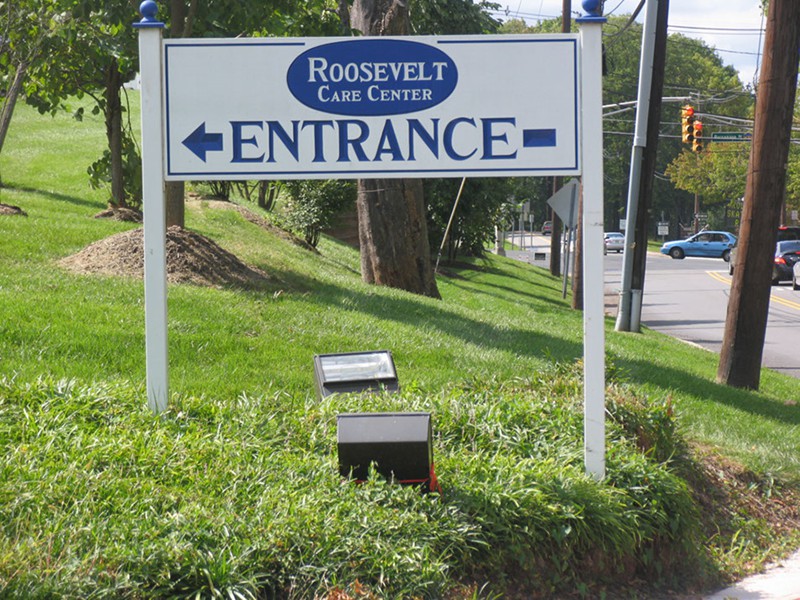
Address 118 Parsonage Rd, Edison, NJ 08837

Calculate Travel Distance to Roosevelt Care Centers

Add your location

Address

Staffing Data

Source: CMS Payroll-Based Journal (Q2 2025)

359
Total Staff
82
Employees
277
Contractors
78,651
Total Hours (Quarter)
109
Avg Staff/Day
7.9
Avg Shift (hrs)
Nursing Staff Breakdown
Role Count Avg Shift (hrs) Uses Contractors?
Registered Nurse218.4 Yes
Licensed Practical Nurse1017.8 Yes
Certified Nursing Assistant1958.2 Yes
Staff by Category
Administration
2 staff
5.9hs shift avg
Nursing Staff
317 staff
8.1hs shift avg
Physicians & Practitioners
14 staff
7.9hs shift avg
Therapy Services
12 staff
7.7hs shift avg
Activities & Recreation
1 staff
4hs shift avg
Social Services
7 staff
6.9hs shift avg
Dietary Services
4 staff
7hs shift avg
Other Services
2 staff
8hs shift avg
Contractor Analysis
46.7%
of total hours from contractors
36,750 contractor hours this quarter
Clinical Nurse Specialist: 1 Licensed Practical Nurse: 89 Certified Nursing Assistant: 156 Respiratory Therapy Technician: 5 Registered Nurse: 15 Administrator: 1 Physical Therapy Assistant: 2 Physical Therapy Aide: 2 Speech Language Pathologist: 3 Qualified Social Worker: 2 Qualified Activities Professional: 1
Role Employees Contractors Total Staff Total Hours Days Worked % of Days Avg Shift (hrs)
Certified Nursing Assistant3915619537,39891100%8.2
Licensed Practical Nurse128910118,63691100%7.8
Registered Nurse615215,85491100%8.4
Clinical Nurse Specialist121135,43991100%7.9
Other Social Services Staff5052,0587279%6.9
Dietitian4041,69691100%7
Respiratory Therapy Technician0551,4628189%7.1
Speech Language Pathologist0331,4396571%8
Physical Therapy Aide0229497684%8
Physical Therapy Assistant0229226571%8
Mental Health Service Worker2028416470%8
Qualified Social Worker0225136268%6.9
Administrator0114966369%7.9
Nurse Practitioner1014295459%7.9
Medical Director1012606571%4
Qualified Activities Professional0112606571%4

Health Inspection History

Inspections
Total health inspections 4

New Jersey average 4


Last Health inspection on May 2024

Total health citations 26
Citations per inspection
6.5

Health citations are formal notices following inspections when they fail to comply with safety and care standards.

23 of 26 citations resulted from standard inspections; 1 of 26 resulted from complaint investigations; and 2 of 26 came from combined inspections (standard and complaint).

Breakdown of citation severity (last 3 years)
Critical Health citations More info 0
100% better than New Jersey average

New Jersey average: 0.7


Serious Health citations More info 1
150% worse than New Jersey average

New Jersey average: 0.4

0 critical citations More info New Jersey average: 0.7

1 serious citation More info New Jersey average: 0.4

23 moderate citations More info New Jersey average: 19.3

2 minor citations More info New Jersey average: 0.5
Citations history (last 3 years)
Abuse/Neglect moderate citation May 02, 2024
Corrected

Administration moderate citation May 02, 2024
Corrected

Environmental moderate citation May 02, 2024
Corrected

Infection Control moderate citation May 02, 2024
Corrected

Facility Characteristics

Source: CMS Long-Term Care Facility Characteristics (Data as of Jan 2026)

Ownership: County Government
Part of: Middlesex County Improvement Authority
Resident Census by Payment Source
153 Total Residents
Medicare 25 (16.3%)
Medicaid 101 (66%)
Private Pay/Other 27 (17.6%)
Programs & Services
Residents' Group
Family Engagement

Active councils help families stay involved in care decisions and facility operations.

Quality of care over time

These measures show how residents usually do over time at this home, based on health outcomes and preventive care.

High-risk clinical events score Info A composite score based on pressure ulcers, falls with injury, weight loss, walking ability decline, and activities of daily living decline. 3.6
47% better than New Jersey average

New Jersey average: 6.8

Functional decline score Info A composite score based on activities of daily living decline, walking ability decline, and incontinence. 6.9
45% better than New Jersey average

New Jersey average: 12.4

Long-stay resident measures
Need for Help with Daily Activities Increased Info Percent of long-stay residents whose need for help with daily activities has increased 4.8%
53% better than New Jersey average

New Jersey average: 10.1%

Walking Ability Worsened Info Percent of long-stay residents whose ability to move independently worsened 5.3%
52% better than New Jersey average

New Jersey average: 11.0%

Low Risk Residents with Bowel/Bladder Incontinence Info Percent of low risk long-stay residents who lose control of their bowels or bladder 10.5%
34% better than New Jersey average

New Jersey average: 16.0%

Falls with Major Injury Info Percent of long-stay residents experiencing one or more falls with major injury 2.7%
11% worse than New Jersey average

New Jersey average: 2.4%

High Risk Residents with Pressure Ulcers Info Percent of long-stay high risk residents with pressure ulcers 4.7%
22% better than New Jersey average

New Jersey average: 6.1%

Urinary Tract Infection Info Percent of long-stay residents with a urinary tract infection 0.0%
100% better than New Jersey average

New Jersey average: 1.0%

Lost Too Much Weight Info Percent of long-stay residents who lose too much weight 0.6%
86% better than New Jersey average

New Jersey average: 4.6%

Depressive Symptoms Info Percent of long-stay residents who have depressive symptoms 19.9%
76% worse than New Jersey average

New Jersey average: 11.3%

Antipsychotic Use Info Percent of long-stay residents who received an antipsychotic medication 10.4%
6% better than New Jersey average

New Jersey average: 11.1%

Pneumococcal Vaccine Info Percent of long-stay residents assessed and appropriately given the pneumococcal vaccine 99.2%
7% better than New Jersey average

New Jersey average: 93.0%

Influenza Vaccine Info Percent of long-stay residents assessed and appropriately given the seasonal influenza vaccine 100.0%
In line with New Jersey average

New Jersey average: 97.2%

Hospitalizations per 1,000 days Info Number of hospitalizations per 1,000 long-stay resident days. 2.01
In line with New Jersey average

New Jersey average: 2.08

ED visits per 1,000 days Info Number of outpatient emergency department visits per 1,000 long-stay resident days. 1.10
In line with New Jersey average

New Jersey average: 1.12

Short-stay resident measures
Pneumococcal Vaccine Info Percent of short-stay residents assessed and appropriately given the pneumococcal vaccine 94.3%
20% better than New Jersey average

New Jersey average: 78.9%

Antipsychotic medication increase Info Percent of short-stay residents who newly received an antipsychotic medication 1.4%
23% worse than New Jersey average

New Jersey average: 1.2%

Influenza Vaccine Info Percent of short-stay residents assessed and appropriately given the seasonal influenza vaccine 89.7%
12% better than New Jersey average

New Jersey average: 80.1%

Re-hospitalized after SNF stay Info Percentage of short-stay residents who were re-hospitalized after their nursing home admission. 22.1%
13% better than New Jersey average

New Jersey average: 25.4%

Emergency department visits Info Percentage of short-stay residents who had an outpatient emergency department visit. 5.5%
33% better than New Jersey average

New Jersey average: 8.2%

Falls with major injury Info Percentage of SNF residents who experience falls with major injury during their stay. 1.0%
32% worse than New Jersey average

New Jersey average: 0.8%

Ability to care for self at discharge Info Percentage of residents at or above expected ability to care for themselves at discharge. 62.2%
16% better than New Jersey average

New Jersey average: 53.7%

Successful return to home or community Info Rate of successful return to home or community from a skilled nursing facility. 62.5%
24% better than New Jersey average

New Jersey average: 50.6%

Penalties and fines

Federal penalties imposed by CMS for regulatory violations, including civil money penalties (fines) and denials of payment for new Medicare/Medicaid admissions.

Source: CMS Penalties Database (Data as of Jan 2026)

Total fines amount $27K
65% lower than New Jersey average

New Jersey average: $77K

Number of fines 1
50% fewer fines than New Jersey average

New Jersey average: 2.0

Payment Denials Info Serious action where Medicare and/or Medicaid temporarily stops payments for new residents until issues are fixed. 0
100% fewer payment denials than New Jersey average

New Jersey average: 0.1

Fines amount comparison
This facility $27K
New Jersey average $77K
Penalty History

Penalties are imposed by CMS for violations of federal nursing home regulations.

Civil Money Penalty Info Fines imposed for noncompliance, which can be assessed per day or per instance of violation. May 2, 2024
$27K

Last updated: Jan 2026

Guides for Better Senior Living

Care Cost Calculator: See Prices in Your Area

Nursing Home Data Explorer

Don’t Wait Too Long: 7 Red Flag Signs Your Parent Needs Assisted Living Now

The True Cost of Assisted Living in 2025 – And How Families Are Paying For It

Understanding Senior Living Costs: Pricing Models, Discounts & Financial Assistance

Financial Aid for New Jersey Seniors

Get financial aid guidance

Managed Long Term Services and Supports

NJ Medicaid MLTSS

Age 65+ or disabled, New Jersey resident, Medicaid- eligible, nursing home-level care need.

~$2,829/month (300% FBR, individual).

$2,000 (individual), $3,000 (couple).

High urban demand; managed care model.

JACC (Jersey Assistance for Community Caregiving)

NJ JACC

Age 60+, New Jersey resident, at risk of nursing home.

~$2,500/month (individual, varies).

$40,000 (individual).

Higher asset limit; limited funding.

Pharmaceutical Assistance to the Aged and Disabled (PAAD)

New Jersey PAAD

Age 65+, NJ resident, enrolled in Medicare Part D or eligible.

~$42,142/year (individual), ~$49,209/year (couple).

Not assessed.

Copays $5 (generic), $7 (brand); covers Part D premiums up to benchmark.

Senior Gold Prescription Discount Program

New Jersey Senior Gold

Age 65+, NJ resident, enrolled in Medicare Part D or eligible.

~$42,142-$52,142/year (individual), ~$49,209-$59,209/year (couple).

Not assessed.

Copays $15 + 50% of remaining cost; no premium assistance.

Medicare Savings Program (MSP)

New Jersey Medicare Savings Program

Age 65+ or disabled, NJ resident, Medicare Part A/B.

~$2,510/month (QMB), ~$3,380/month (SLMB), ~$3,598/month (QI)—individual.

$9,430 (individual), $14,130 (couple).

Three tiers; no waitlist; includes Extra Help for Part D.

Senior Freeze (Property Tax Reimbursement)

New Jersey Senior Freeze

Age 65+ by Dec 31 prior year, NJ resident, homeowner, paid property taxes.

~$150,000/year (combined household, projected).

Not assessed; home ownership required.

Combines with ANCHOR/Stay NJ via PAS-1; annual application.

ANCHOR (Affordable NJ Communities for Homeowners and Renters)

New Jersey ANCHOR

Age 65+ prioritized, NJ resident, homeowner/renter, paid property taxes/rent.

~$150,000/year (homeowners), ~$75,000/year (renters).

Not assessed.

Combines with Senior Freeze/Stay NJ; broader than prior Homestead program.

Stay NJ

New Jersey Stay NJ

Age 65+ by Dec 31 prior year, NJ resident, homeowner, lived in home 10+ years.

~$500,000/year (projected, subject to final regs).

Not assessed; home ownership required.

Up to 50% tax credit (max $6,500); phased implementation.

Universal Service Fund (USF)

New Jersey Universal Service Fund

Age 65+ prioritized, NJ resident, utility customer, low-income.

~$3,970/month (individual, 185% FPL).

Not assessed; income-focused.

Must owe >$25 on bill; combines with LIHEAP if eligible.

Home Energy Assistance Program (LIHEAP)

New Jersey LIHEAP

Age 60+ prioritized, NJ resident, low-income household.

~$3,970/month (individual, 185% FPL).

Not assessed; income-focused.

Covers oil, gas, electric; emergency aid available.

NJ Family Caregiver Support Program (via NFCSP)

New Jersey Family Caregiver Support Program

Caregivers of 60+ needing care or 55+ caregivers of others; NJ resident; functional needs (2+ ADLs).

Prioritizes ~$24,980/year (individual); no strict cap.

Not assessed; need-based.

21 AAAs; rural/low-income priority.

VA Aid and Attendance (A&A) and Housebound Benefits

New Jersey VA Aid and Attendance/Housebound

Age 65+ or disabled veteran/spouse, NJ resident, wartime service, need for ADL help (A&A) or homebound.

Net income < ~$1,984/month (veteran with dependent, A&A); pension offsets income.

~$155,356 (net worth limit).

High veteran demand in urban/rural areas.

Who we are

Your Senior Care Partner, Every Step of the Way

We help families find affordable senior communities and unlock same day discounts, Medicaid, and Medicare options tailored to your needs.

Contact us Today
Tour Icon
Planning a tour? Check our touring checklist.
Chat Icon
Thinking of living here? We can help you speak to a current resident