

Facility type
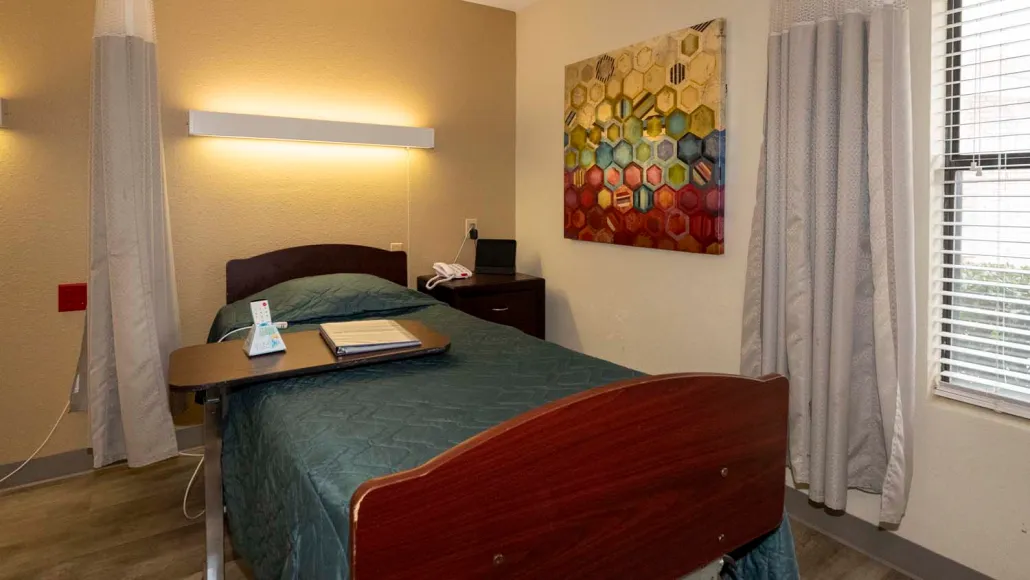
Nursing

We arrange tours, appointments, and even moving support so you don’t have to

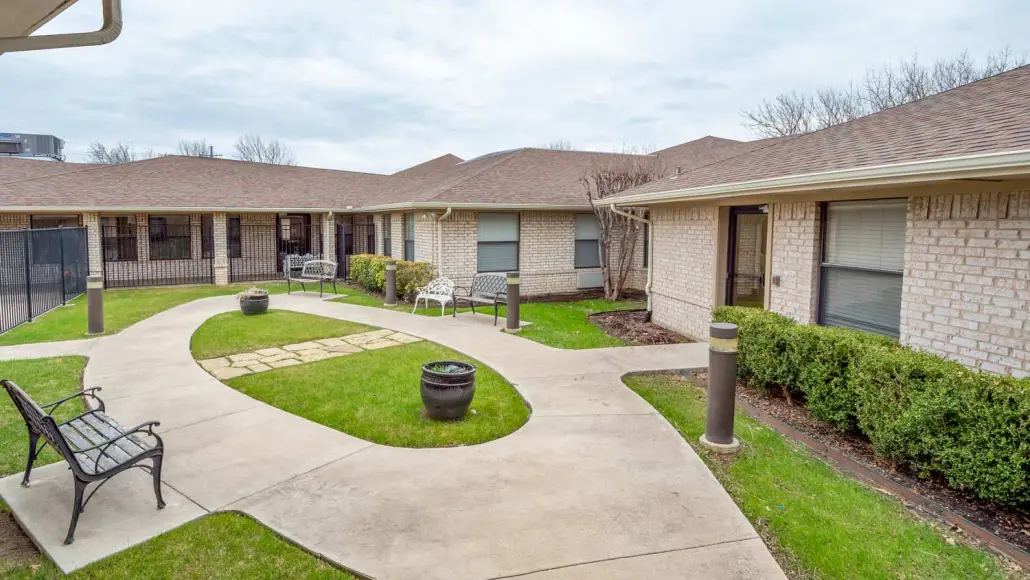
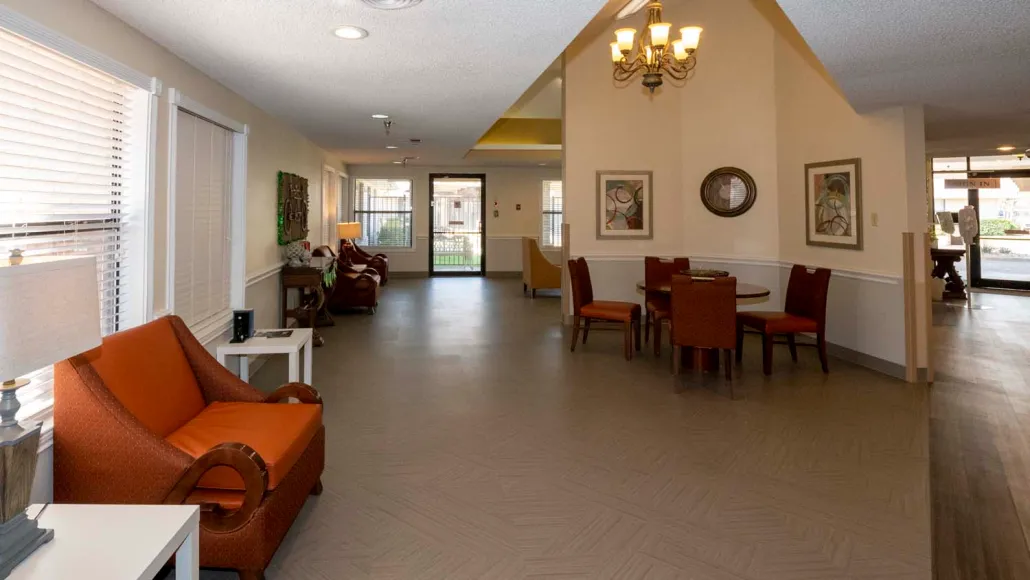
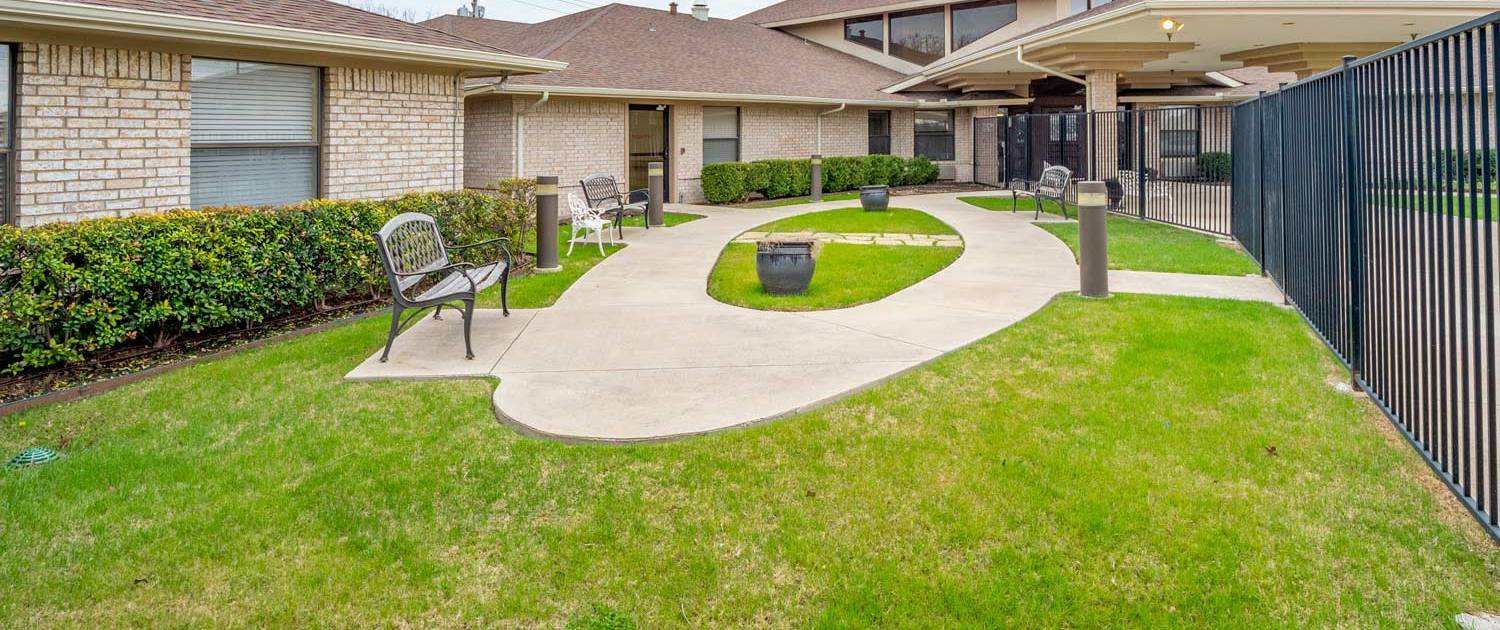
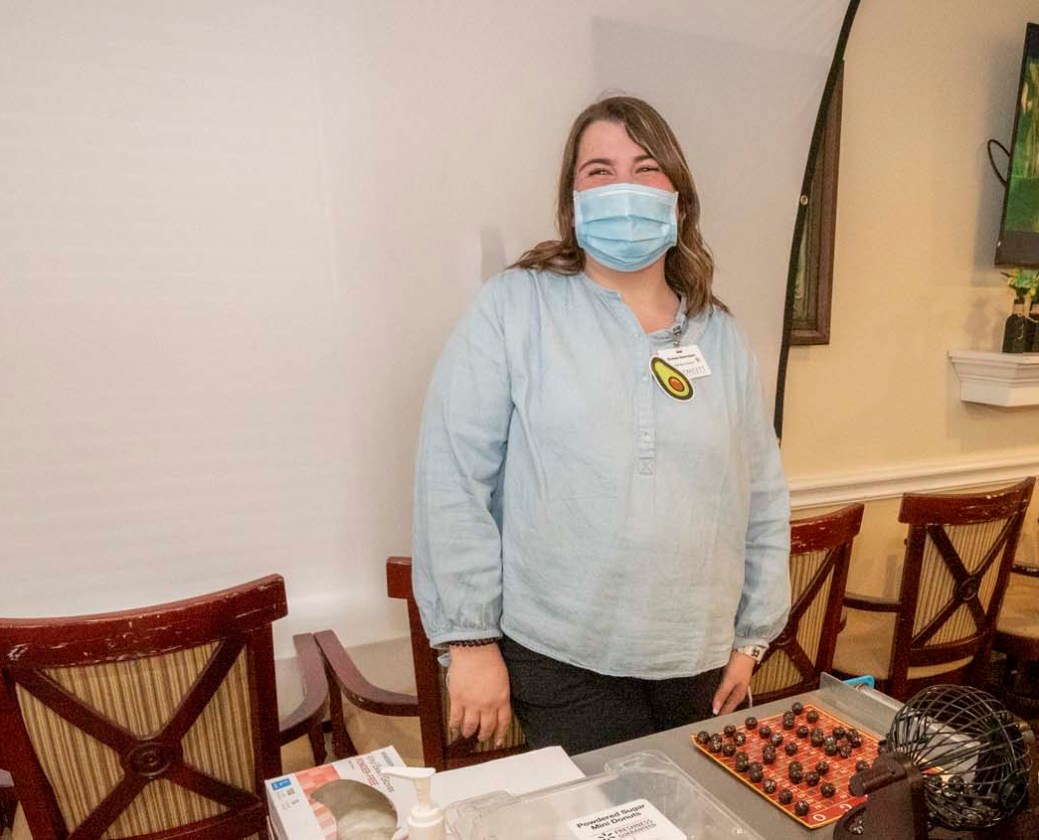
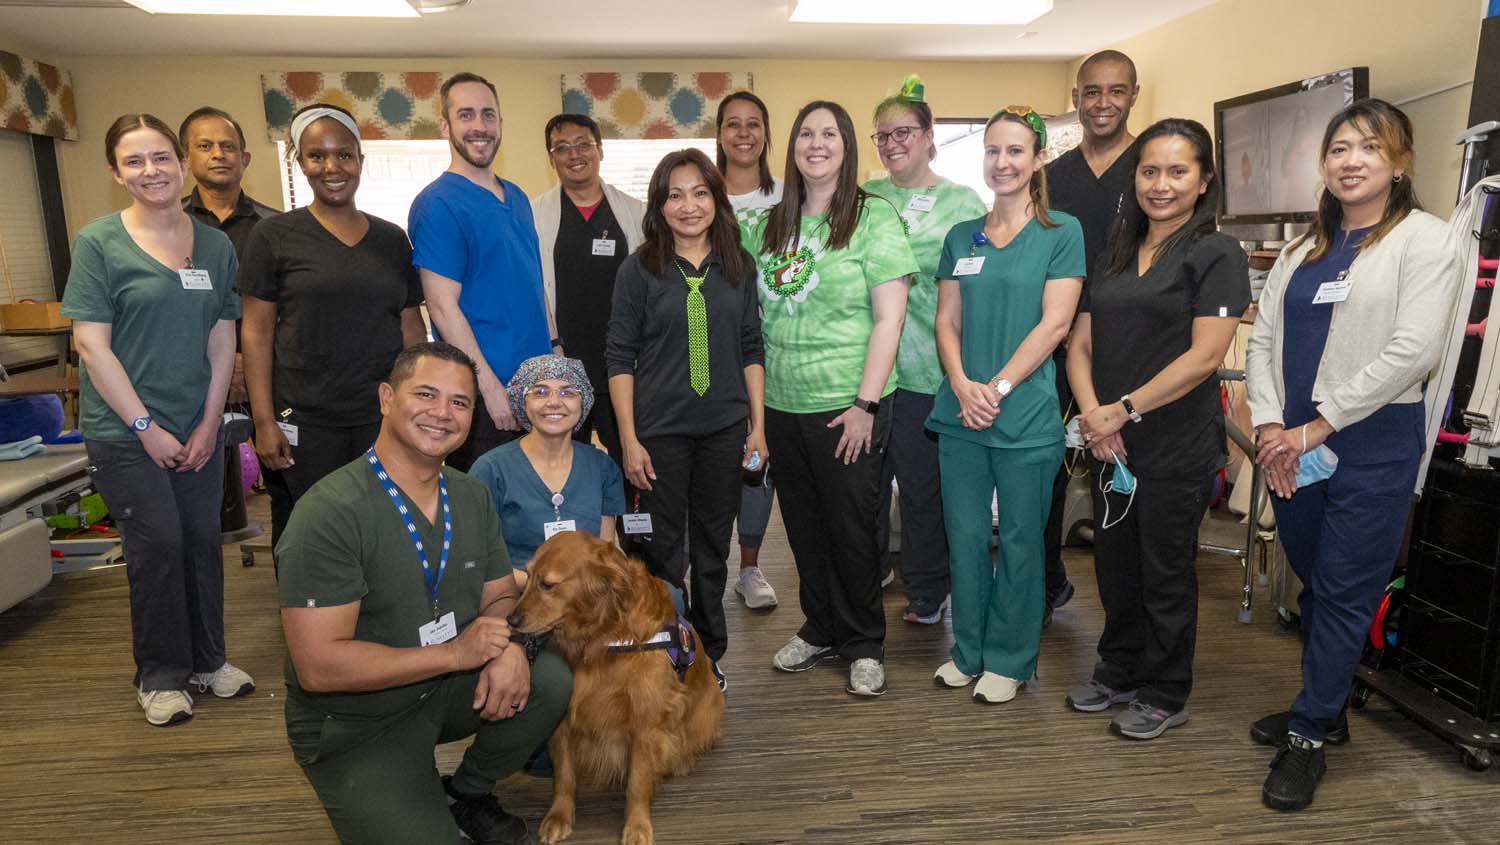
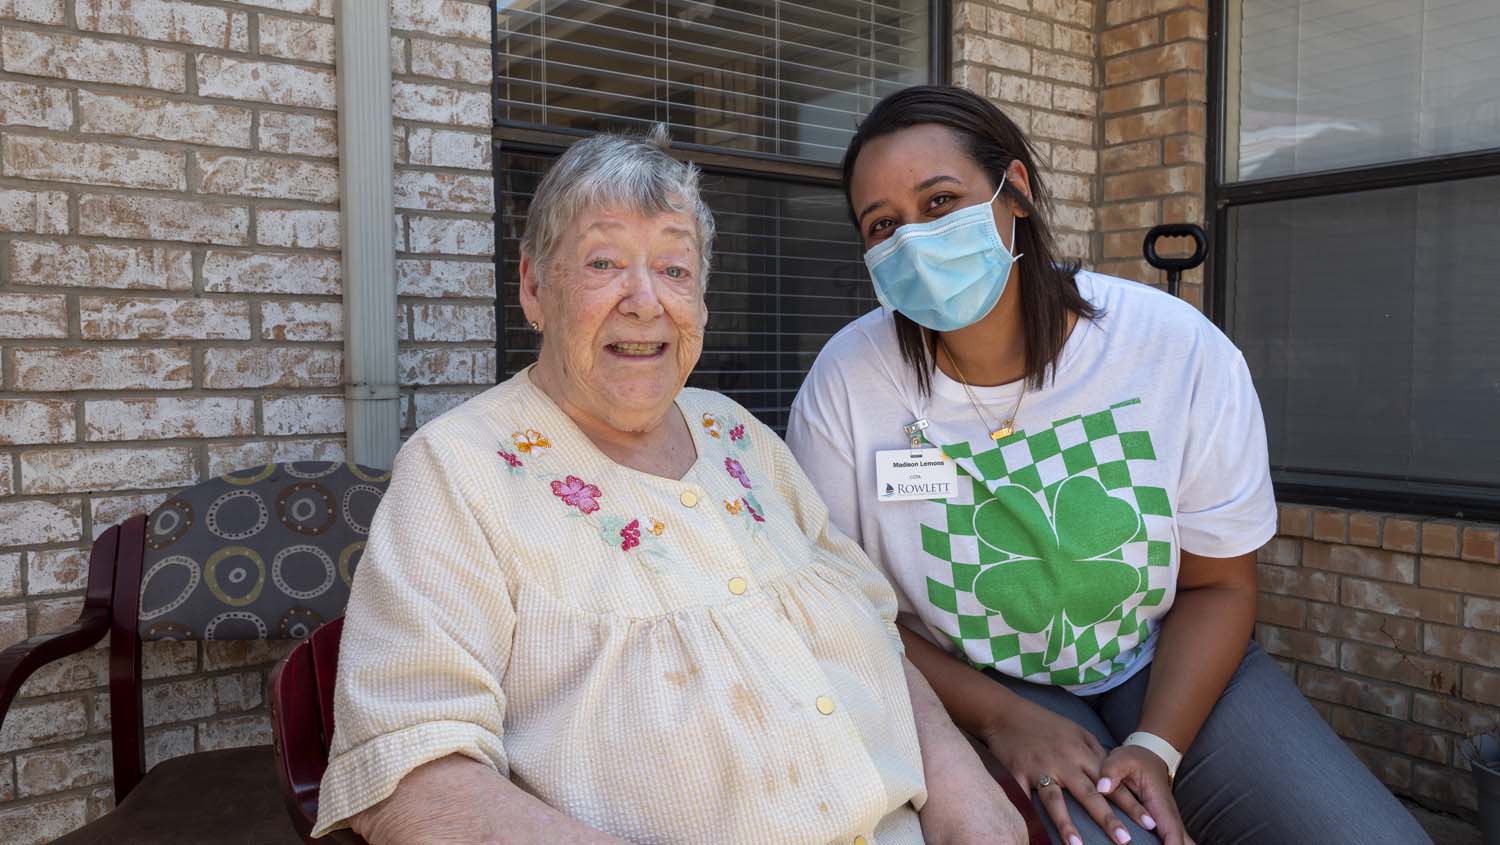
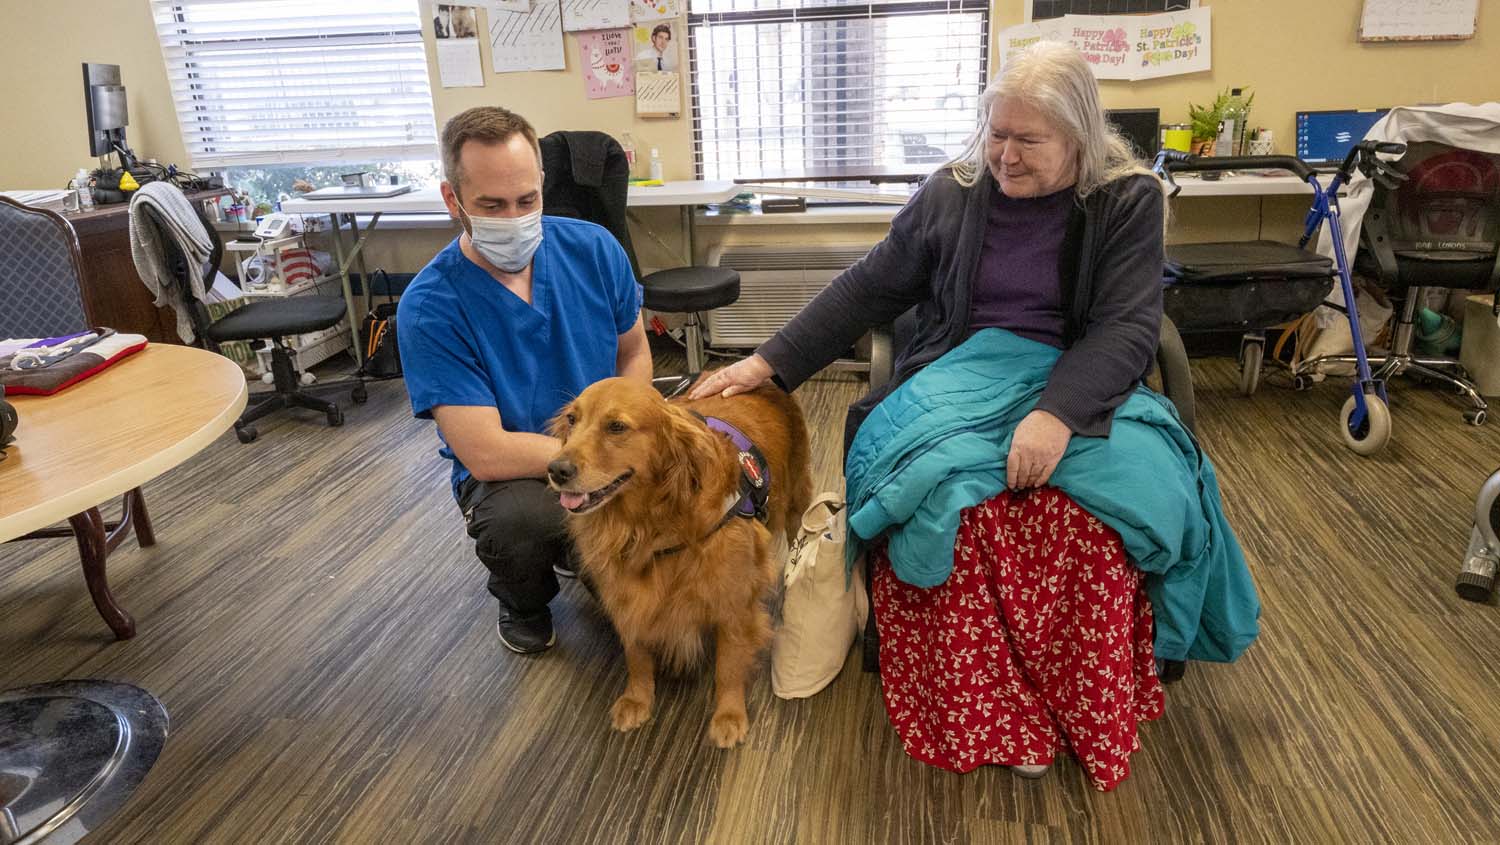
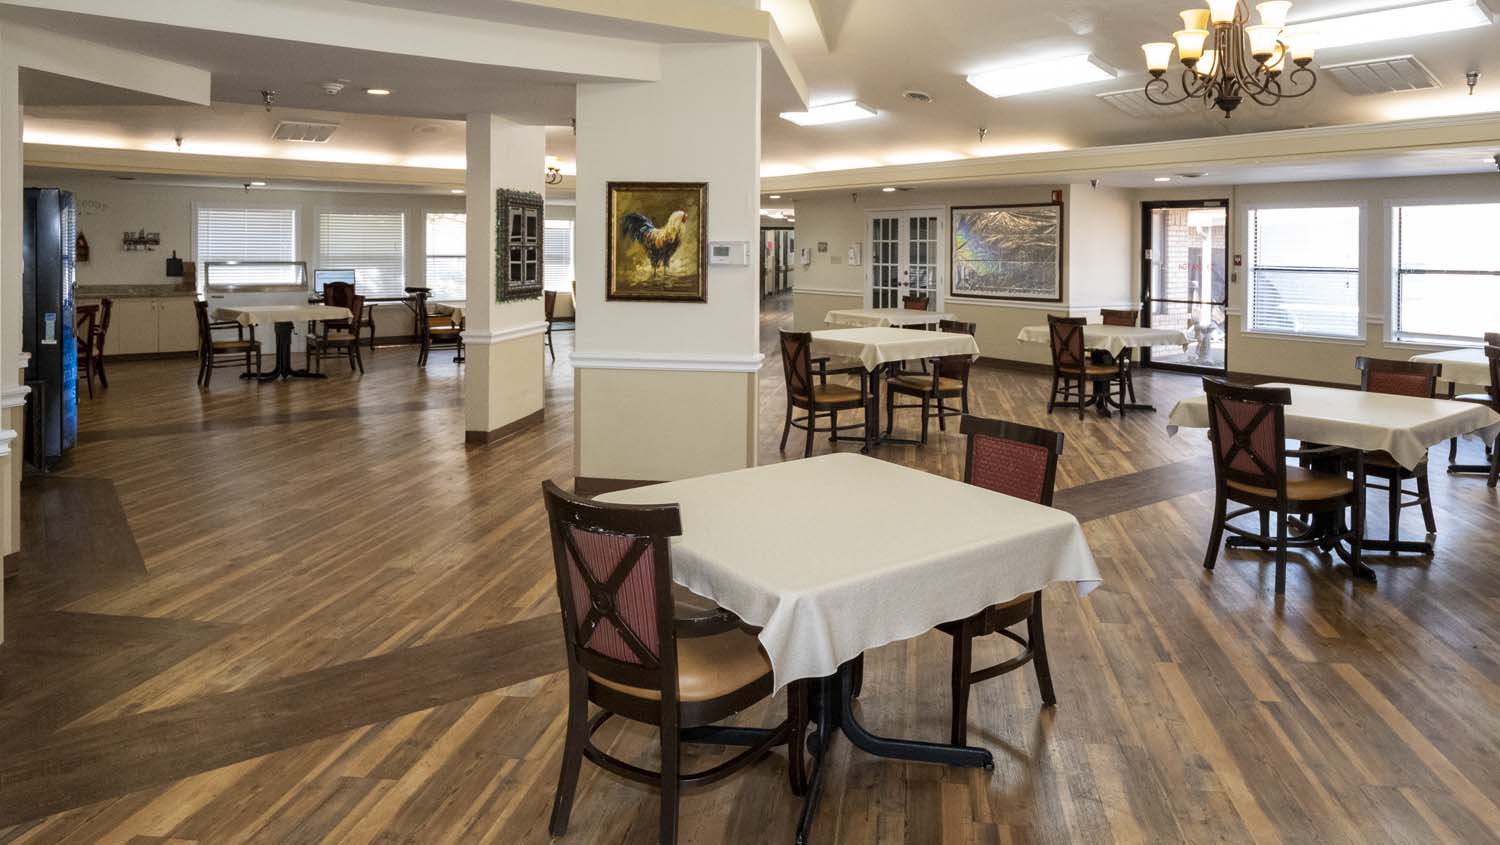
Nestled within the heart of Rowlett, Texas, Rowlett Haven for Senior Wellness embodies an unparalleled commitment to senior care excellence. Operated by Senior Care Consultants, this esteemed center is a beacon of comprehensive support, embracing both short-term rehabilitation and long-term care services with unwavering dedication. Guided by a team of skilled nursing professionals, they prioritize the comfort, safety, and therapeutic needs of every guest. Their commitment extends beyond physical care, offering various engaging activities designed to ensure residents remain active and connected within this senior community.
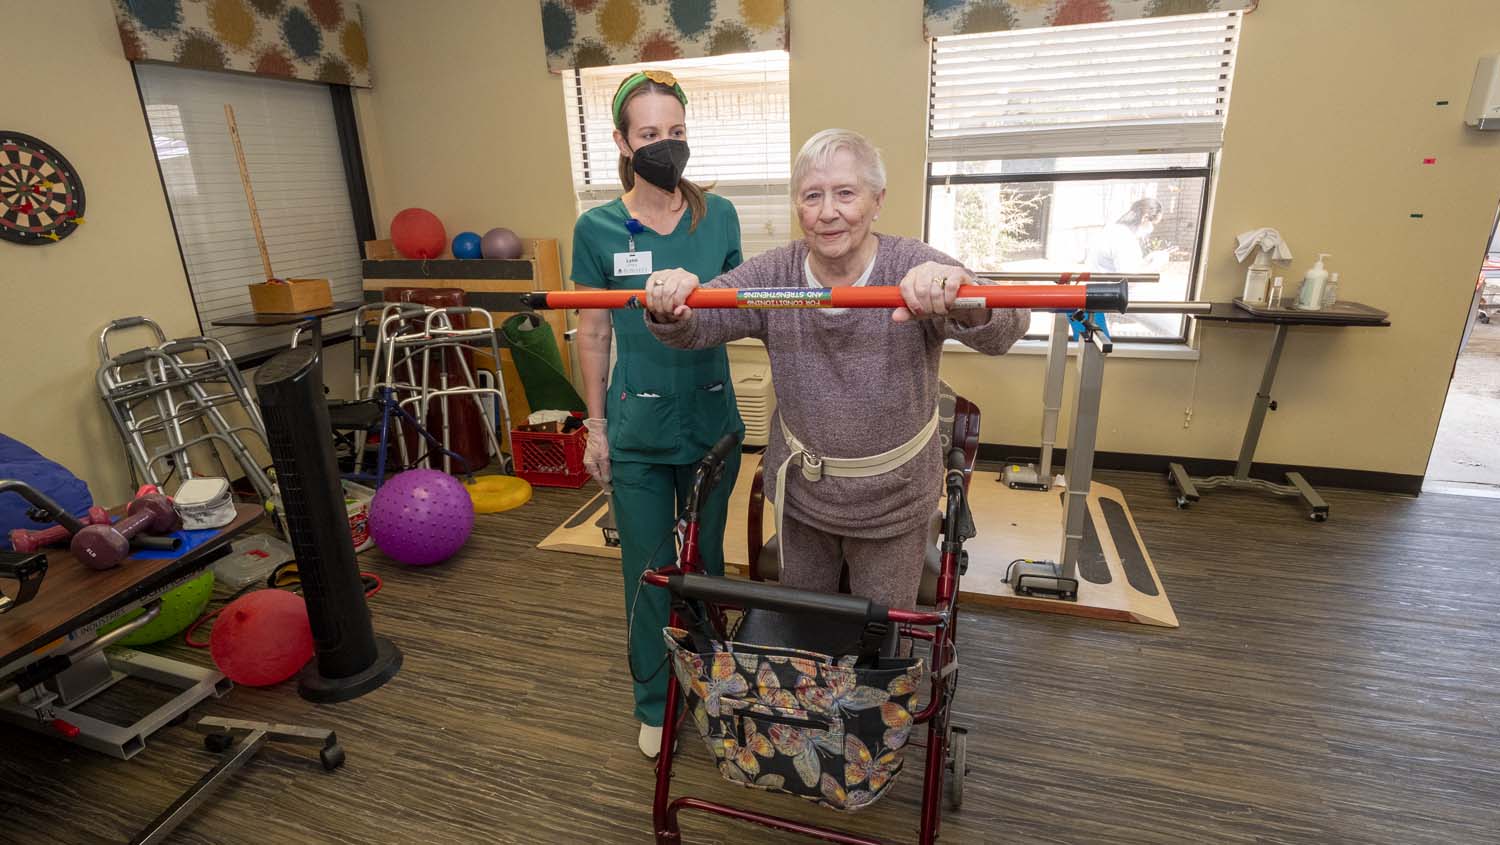
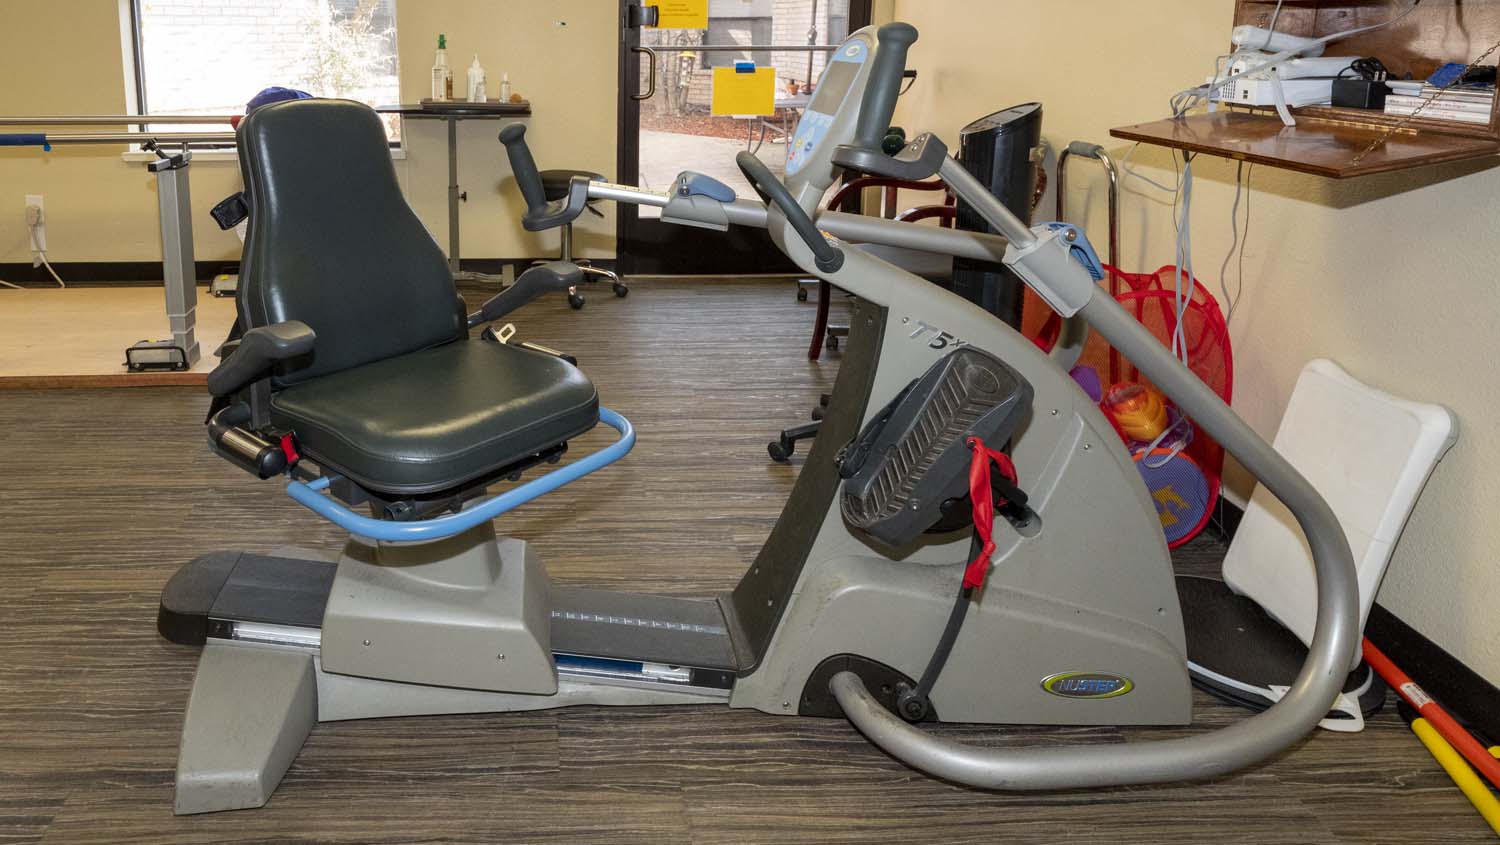
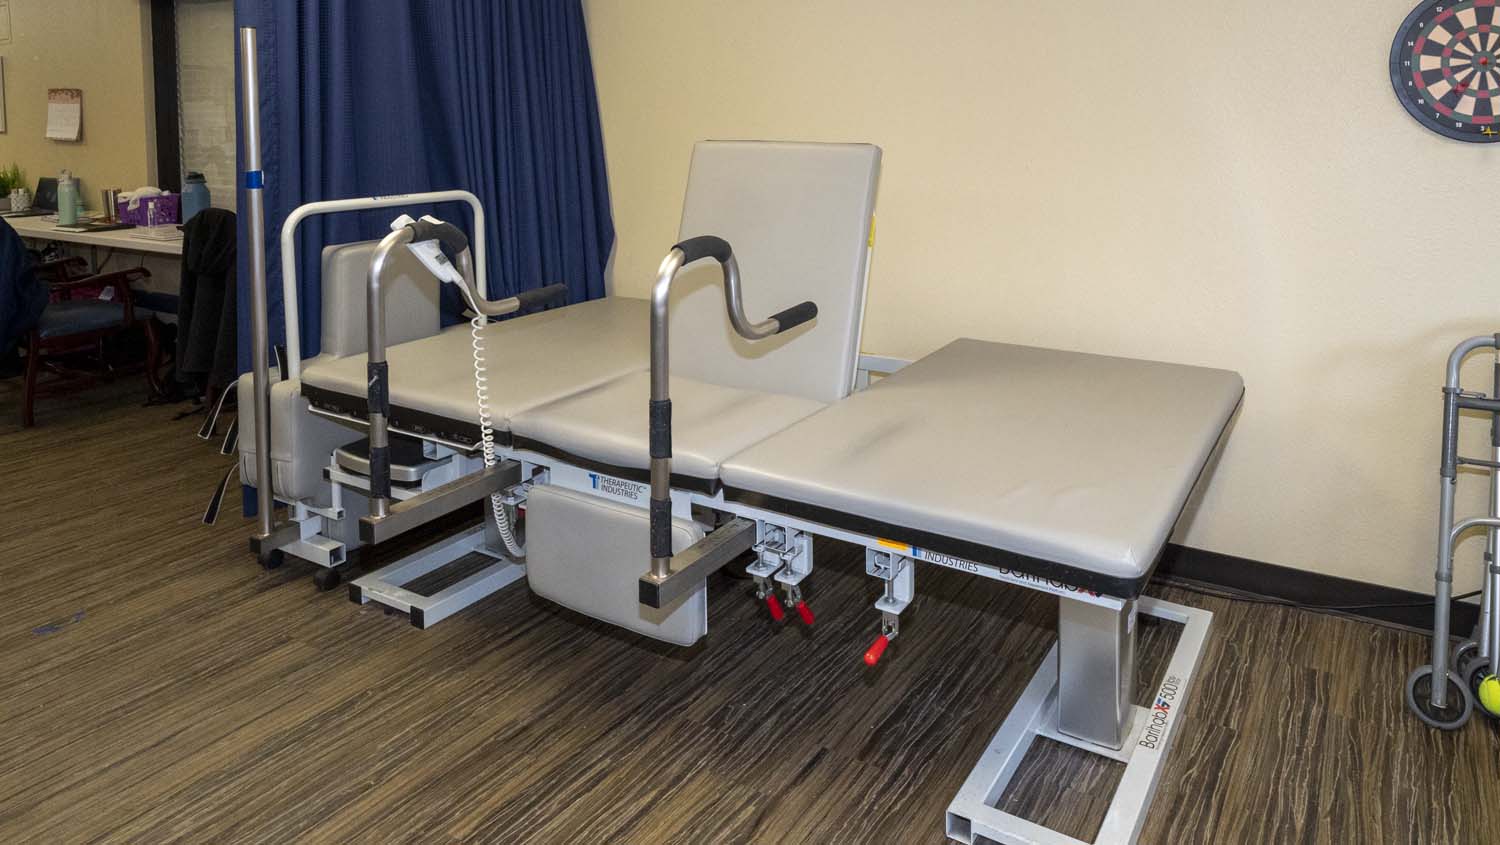
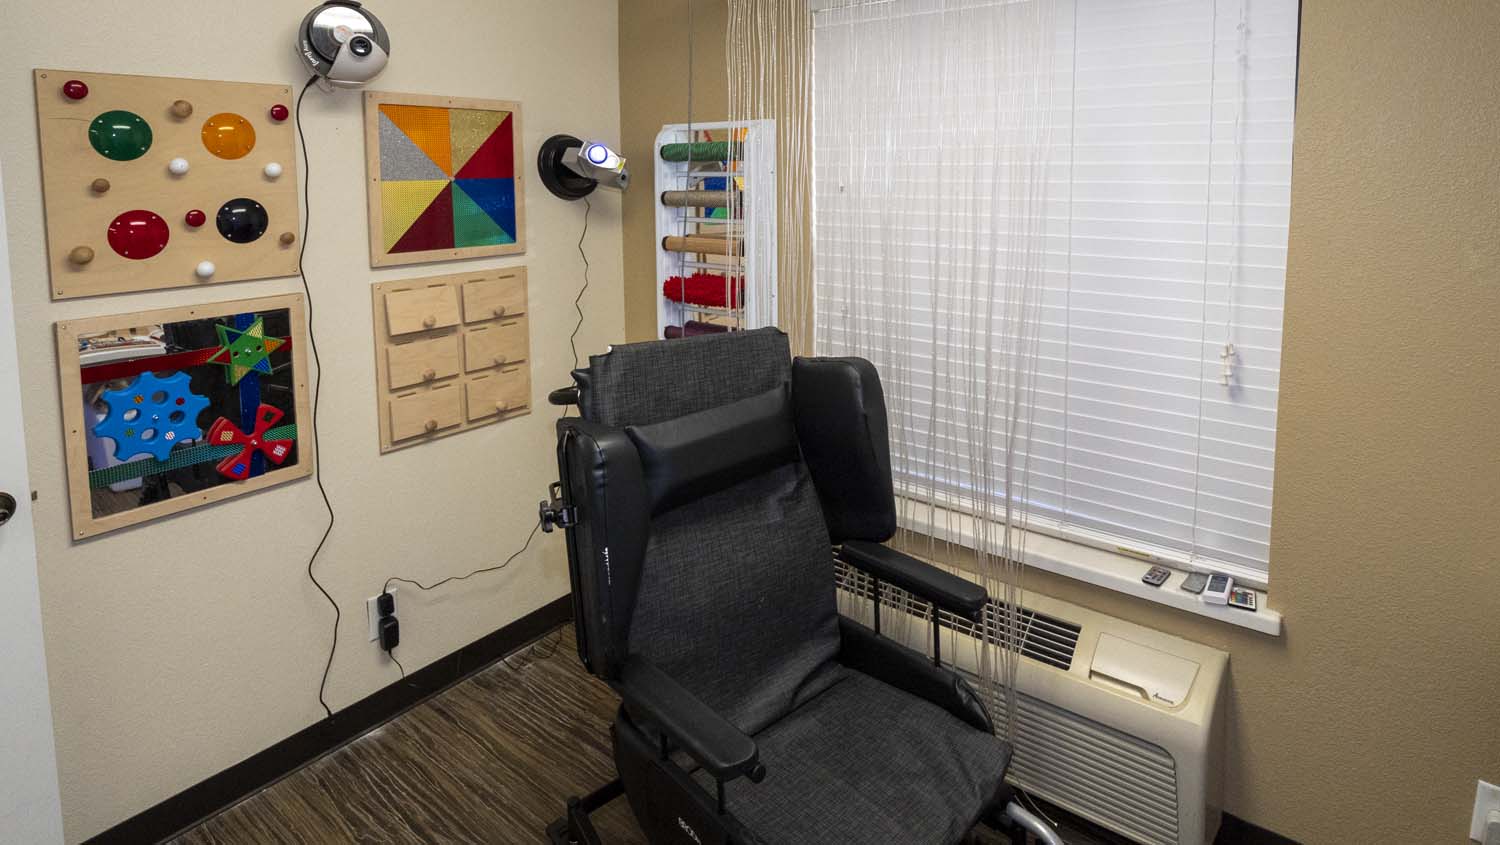
At Rowlett Haven for Senior Wellness, their devoted staff works tirelessly in collaboration with residents, their families, and healthcare providers to craft personalized, effective care and treatment plans. Their in-house therapy team blends state-of-the-art techniques with compassionate, hands-on approaches, fostering an environment where individuals regain strength and mobility, striving towards optimal wellness. Recognized for their unwavering commitment, Rowlett Haven for Senior Wellness proudly holds a 4-star overall rating from Medicare.gov, a testament to their steadfast dedication to delivering unparalleled quality care and fostering holistic well-being for our cherished residents.
 Official CMS rating based on health inspections, staffing and quality measures.
Official CMS rating based on deficiencies found during state health inspections.
Official CMS rating based on nurse staffing hours per resident per day.
Official CMS rating based on clinical outcomes for residents.
Average daily nursing hours per resident (adjusted for acuity). Higher values indicate more nursing time per resident.
Hours of care per resident per day, broken down by staff type. Data from CMS Medicare.
Registered nurse hours per resident per day.
Official CMS rating based on health inspections, staffing and quality measures.
Official CMS rating based on deficiencies found during state health inspections.
Official CMS rating based on nurse staffing hours per resident per day.
Official CMS rating based on clinical outcomes for residents.
Average daily nursing hours per resident (adjusted for acuity). Higher values indicate more nursing time per resident.
Hours of care per resident per day, broken down by staff type. Data from CMS Medicare.
Registered nurse hours per resident per day.
Offers a balance of services and community atmosphere.
Lower occupancy suggests more openings may be available.
This home supports both short-term rehab and long-term care, with residents staying for a wide range of durations.
29% of new residents, usually for short-term rehab.
56% of new residents, often for short stays.
15% of new residents, often for long-term daily care.
The portion of the home's budget spent on staff, including nurses, caregivers, and other employees who support care and operations.
All remaining costs needed to run the home, such as food, utilities, building maintenance, supplies and administrative expenses.
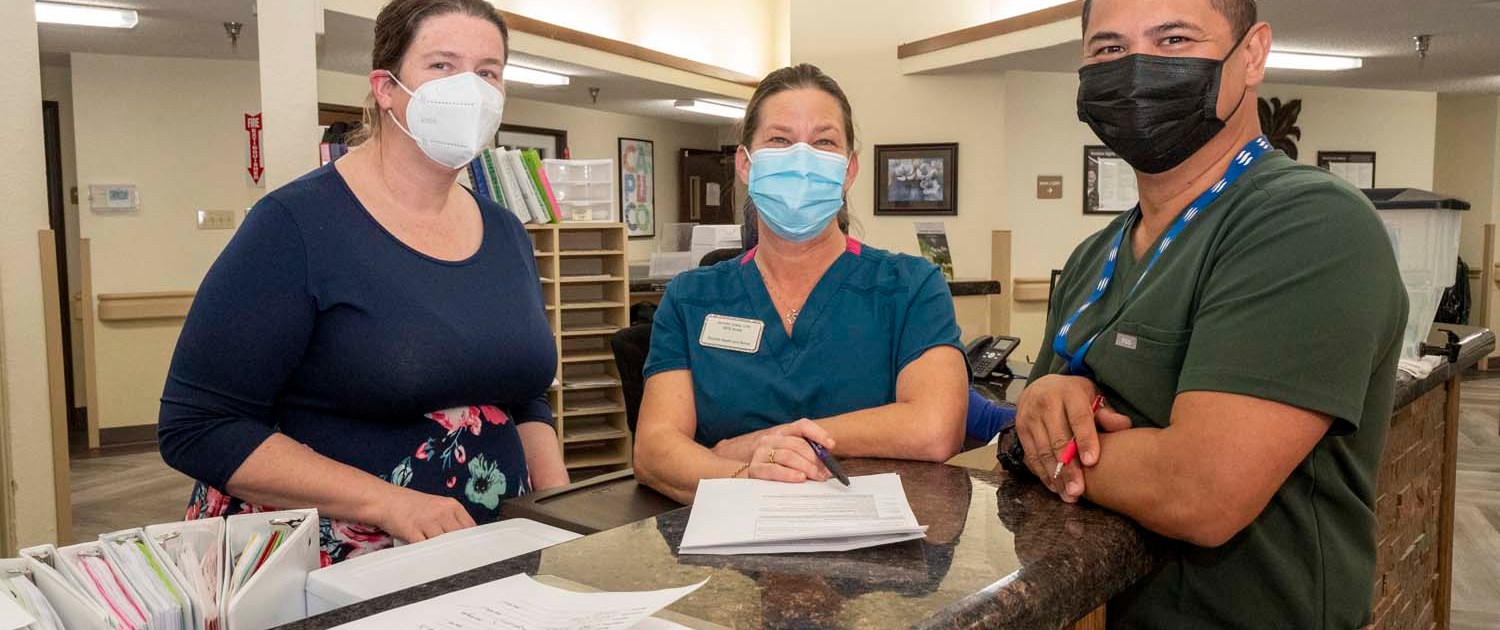
Rowlett Health and Rehabilitation Center is administrated by SCOTT HOWARD.
Key information about the people who lead and staff this community.
Ways to qualify for care at this community, including accepted programs and payment options.
This facility is certified for eligible Medicaid services.
This facility is certified for eligible Medicare services.
Texas average 7.4
Last Health inspection on Jun 2024
Health citations are formal notices following inspections when they fail to comply with safety and care standards.
10 of 20 citations resulted from standard inspections; 7 of 20 resulted from complaint investigations; and 3 of 20 came from combined inspections (standard and complaint).
Texas average: 2
Texas average: 0.4
Data sourced from CMS Health Deficiencies reports. Citation severity codes range from A (least serious) to L (most serious). Immediate Jeopardy (J-L) citations indicate situations where the facility's noncompliance has placed residents at risk of death or serious harm.
Assisted Living For seniors needing help with daily tasks but not full-time nursing.
Nursing Homes 24/7 care needed
Assisted Living For seniors needing help with daily tasks but not full-time nursing.
Nursing Homes 24/7 care needed
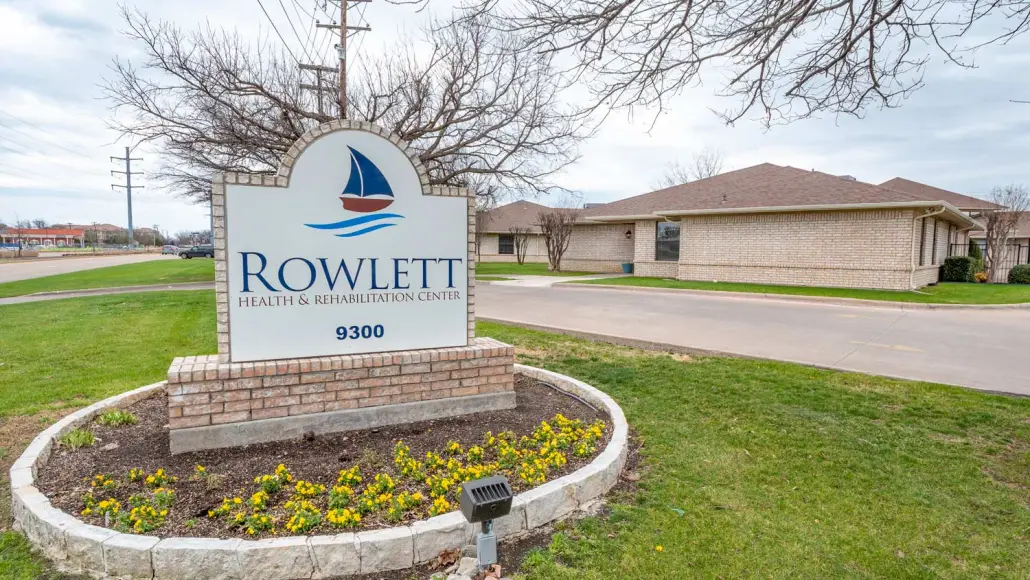
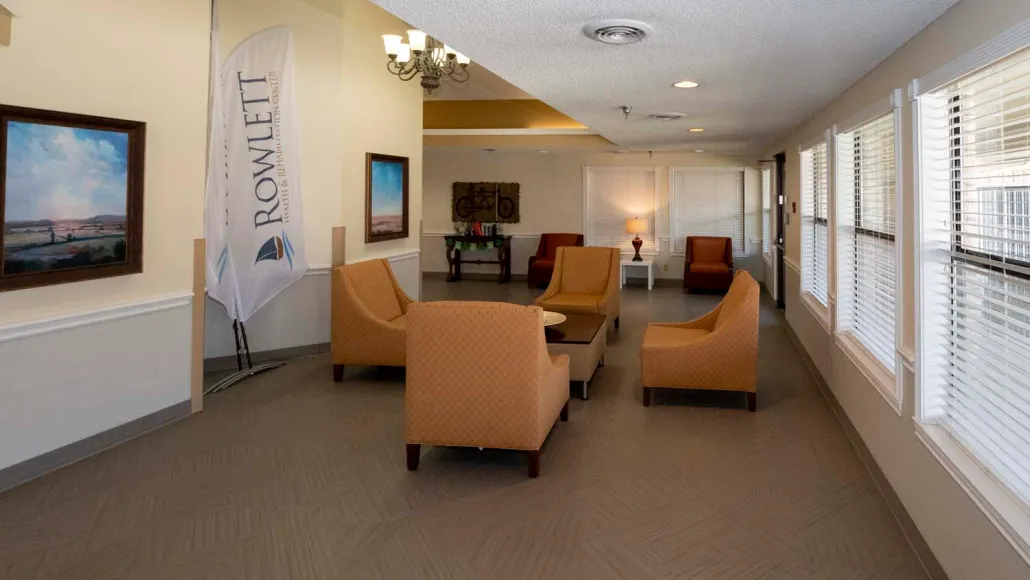
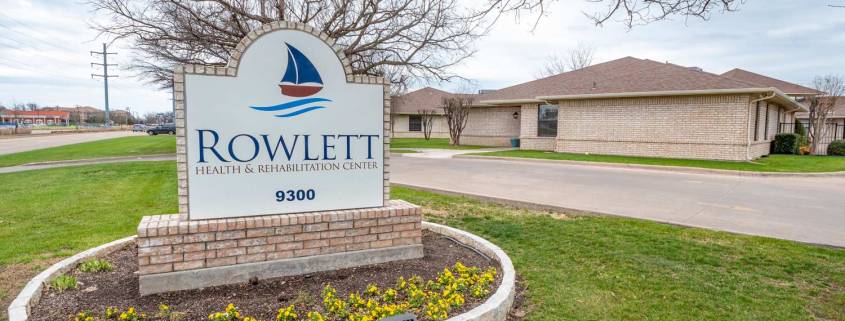
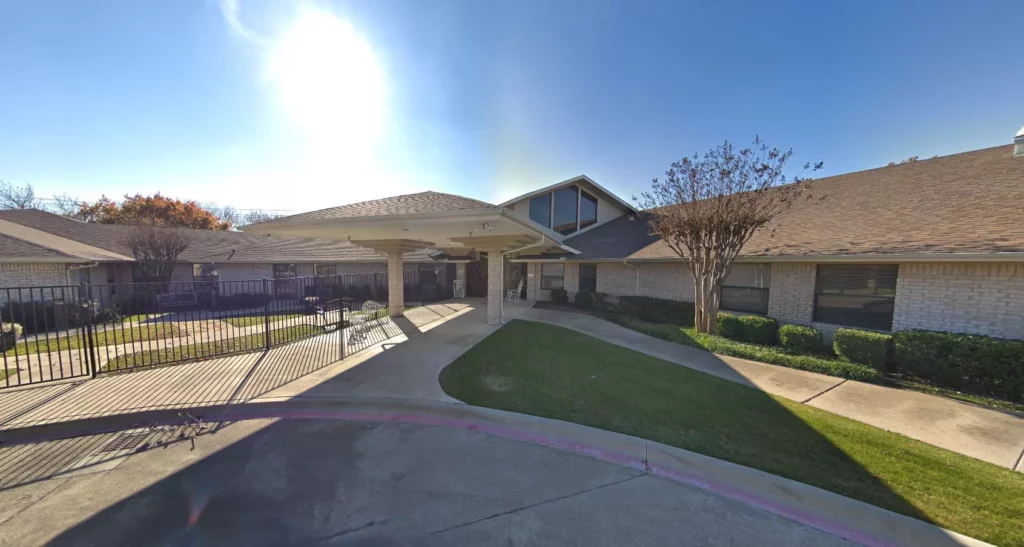 Rowlett Health and Rehabilitation Center
![]() 3.6 miles from city center — 11.01 miles to nearest hospital (Dallas Regional Medical Center | Mesquite, TX)
3.6 miles from city center — 11.01 miles to nearest hospital (Dallas Regional Medical Center | Mesquite, TX)
![]() 9300 Lakeview Pkwy, Rowlett, TX 75088
9300 Lakeview Pkwy, Rowlett, TX 75088
Add your location
Source: CMS Payroll-Based Journal (Q2 2025)
| Role ⓘ | Count ⓘ | Avg Shift (hrs) ⓘ | Uses Contractors? ⓘ |
|---|---|---|---|
| Registered Nurse | 6 | 7.8 | No |
| Licensed Practical Nurse | 24 | 9.4 | No |
| Certified Nursing Assistant | 50 | 9 | No |
| Role ⓘ | Employees ⓘ | Contractors ⓘ | Total Staff ⓘ | Total Hours ⓘ | Days Worked ⓘ | % of Days ⓘ | Avg Shift (hrs) ⓘ |
|---|---|---|---|---|---|---|---|
| Certified Nursing Assistant | 50 | 0 | 50 | 14,365 | 91 | 100% | 9 |
| Licensed Practical Nurse | 24 | 0 | 24 | 8,290 | 91 | 100% | 9.4 |
| Medication Aide/Technician | 13 | 0 | 13 | 6,371 | 91 | 100% | 10.9 |
| Speech Language Pathologist | 11 | 0 | 11 | 3,034 | 84 | 92% | 6.9 |
| Qualified Social Worker | 9 | 0 | 9 | 2,989 | 87 | 96% | 6.9 |
| Physical Therapy Aide | 13 | 0 | 13 | 2,537 | 88 | 97% | 6.1 |
| RN Director of Nursing | 9 | 0 | 9 | 2,309 | 65 | 71% | 8.9 |
| Respiratory Therapy Technician | 13 | 0 | 13 | 2,237 | 74 | 81% | 6.9 |
| Registered Nurse | 6 | 0 | 6 | 1,920 | 91 | 100% | 7.8 |
| Physical Therapy Assistant | 11 | 0 | 11 | 1,706 | 75 | 82% | 6.1 |
| Nurse Aide in Training | 5 | 0 | 5 | 1,234 | 87 | 96% | 8.5 |
| Nurse Practitioner | 1 | 0 | 1 | 593 | 73 | 80% | 8.1 |
| Administrator | 1 | 0 | 1 | 520 | 65 | 71% | 8 |
| Dietitian | 1 | 0 | 1 | 484 | 60 | 66% | 8.1 |
| Other Dietary Services Staff | 2 | 0 | 2 | 454 | 57 | 63% | 8 |
| Mental Health Service Worker | 1 | 0 | 1 | 452 | 57 | 63% | 7.9 |
| Dental Services Staff | 1 | 0 | 1 | 440 | 55 | 60% | 8 |
| Therapeutic Recreation Specialist | 2 | 0 | 2 | 373 | 49 | 54% | 7.6 |
| Clinical Nurse Specialist | 6 | 0 | 6 | 248 | 29 | 32% | 7.8 |
| Medical Director | 0 | 1 | 1 | 105 | 55 | 60% | 1.9 |
| Occupational Therapy Aide | 0 | 1 | 1 | 94 | 15 | 16% | 6.3 |
| Occupational Therapy Assistant | 0 | 1 | 1 | 47 | 6 | 7% | 7.8 |
Source: CMS Long-Term Care Facility Characteristics (Data as of Jan 2026)
Residents meet regularly to discuss policies, care quality, and activities
State-approved Nurse Aide Training and Competency Evaluation Program on-site
Organized group of residents that meets regularly to discuss facility policies, quality of life, and activities.
Data sourced from CMS Long-Term Care Facility Characteristics quarterly report. Payer mix reflects the current resident census by primary payment source.
These measures show how residents usually do over time at this home, based on health outcomes and preventive care.
Texas average: 8.6
Texas average: 16.0
Texas average: 16.2%
Texas average: 16.2%
Texas average: 15.7%
Texas average: 3.2%
Texas average: 4.4%
Texas average: 0.8%
Texas average: 3.5%
Texas average: 2.9%
Texas average: 7.9%
Texas average: 97.3%
Texas average: 97.9%
Texas average: 2.13
Texas average: 2.07
Texas average: 90.4%
Texas average: 1.4%
Texas average: 88.0%
Texas average: 25.9%
Texas average: 12.0%
Texas average: 0.8%
Texas average: 53.7%
Texas average: 50.6%
Quality measures are calculated from Minimum Data Set (MDS) assessments. For most measures, lower percentages indicate better care quality.
Federal penalties imposed by CMS for regulatory violations, including civil money penalties (fines) and denials of payment for new Medicare/Medicaid admissions.
Source: CMS Penalties Database (Data as of Jan 2026)
Texas average: $80K
Texas average: 2.5
Texas average: 0.2
Penalties are imposed by CMS for violations of federal nursing home regulations.
Last updated: Jan 2026
Historical financial and operational data for Rowlett Health and Rehabilitation Center based on CMS SNF Cost Reports.
Loading trend charts...
Care Cost Calculator: See Prices in Your Area
Nursing Home Data Explorer
Don’t Wait Too Long: 7 Red Flag Signs Your Parent Needs Assisted Living Now
The True Cost of Assisted Living in 2025 – And How Families Are Paying For It
Understanding Senior Living Costs: Pricing Models, Discounts & Financial Assistance

Touring a community? Use this expert-backed checklist to stay organized, ask the right questions, and find the perfect fit.
We'll send you a PDF version of the touring checklist.


