Explore Open Rooms
1 Contact details
2 What type of senior care service are you looking for?
3 What budget do you have in mind for senior care?
4 How soon do you need to find care?
5 Additional details

Thank you for your interest!

Our team will be in touch shortly to help with next steps.

Nursing Home in San Antonio

CMS overall rating Info The Overall CMS Rating combines results from health inspections, staffing levels and quality measures. Health inspections carry the most weight. Staffing and quality scores can increase or decrease the final rating based on performance compared to state and national standards.

San Antonio North Nursing and Rehab

Overview of San Antonio North Nursing and Rehab

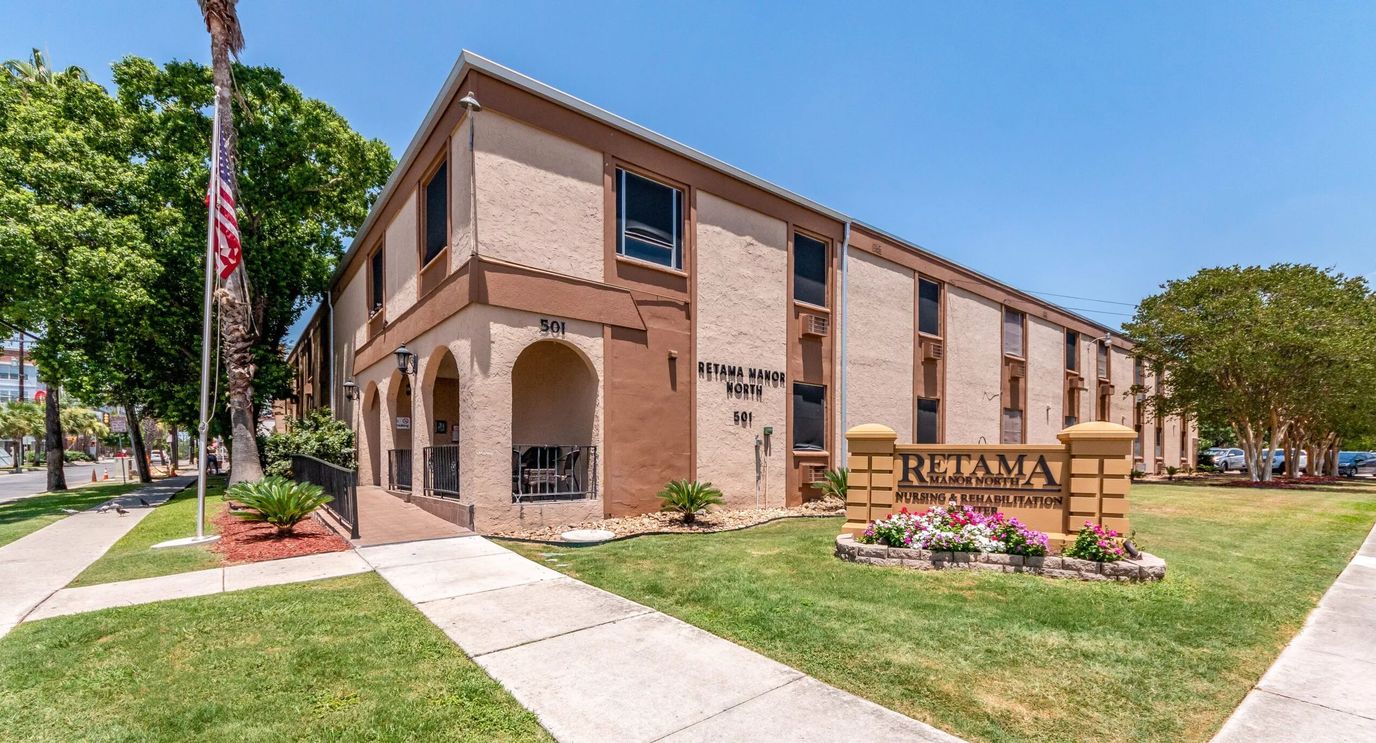
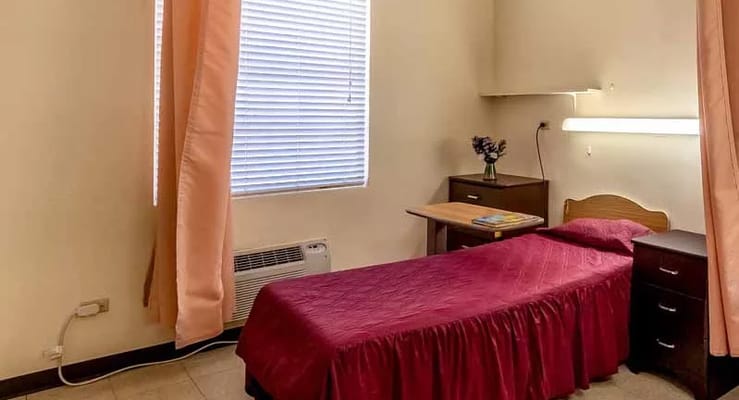
Choosing San Antonio North Nursing and Rehab means choosing a place where comfort, care, and community are at the crossroads. For those who need long-term care, the facility offers a wide range of services, including lab and x-ray services, medication management, dining services, assistance with daily activities, social services, dialysis, dental care, podiatry, and more. Every aspect of resident care is meticulously taken care of, ensuring their physical, emotional, and social well-being. From post-operative rehab to specialized care such as cardiac care, stroke recovery, and wound care, residents receive comprehensive and personalized care to support their recovery.
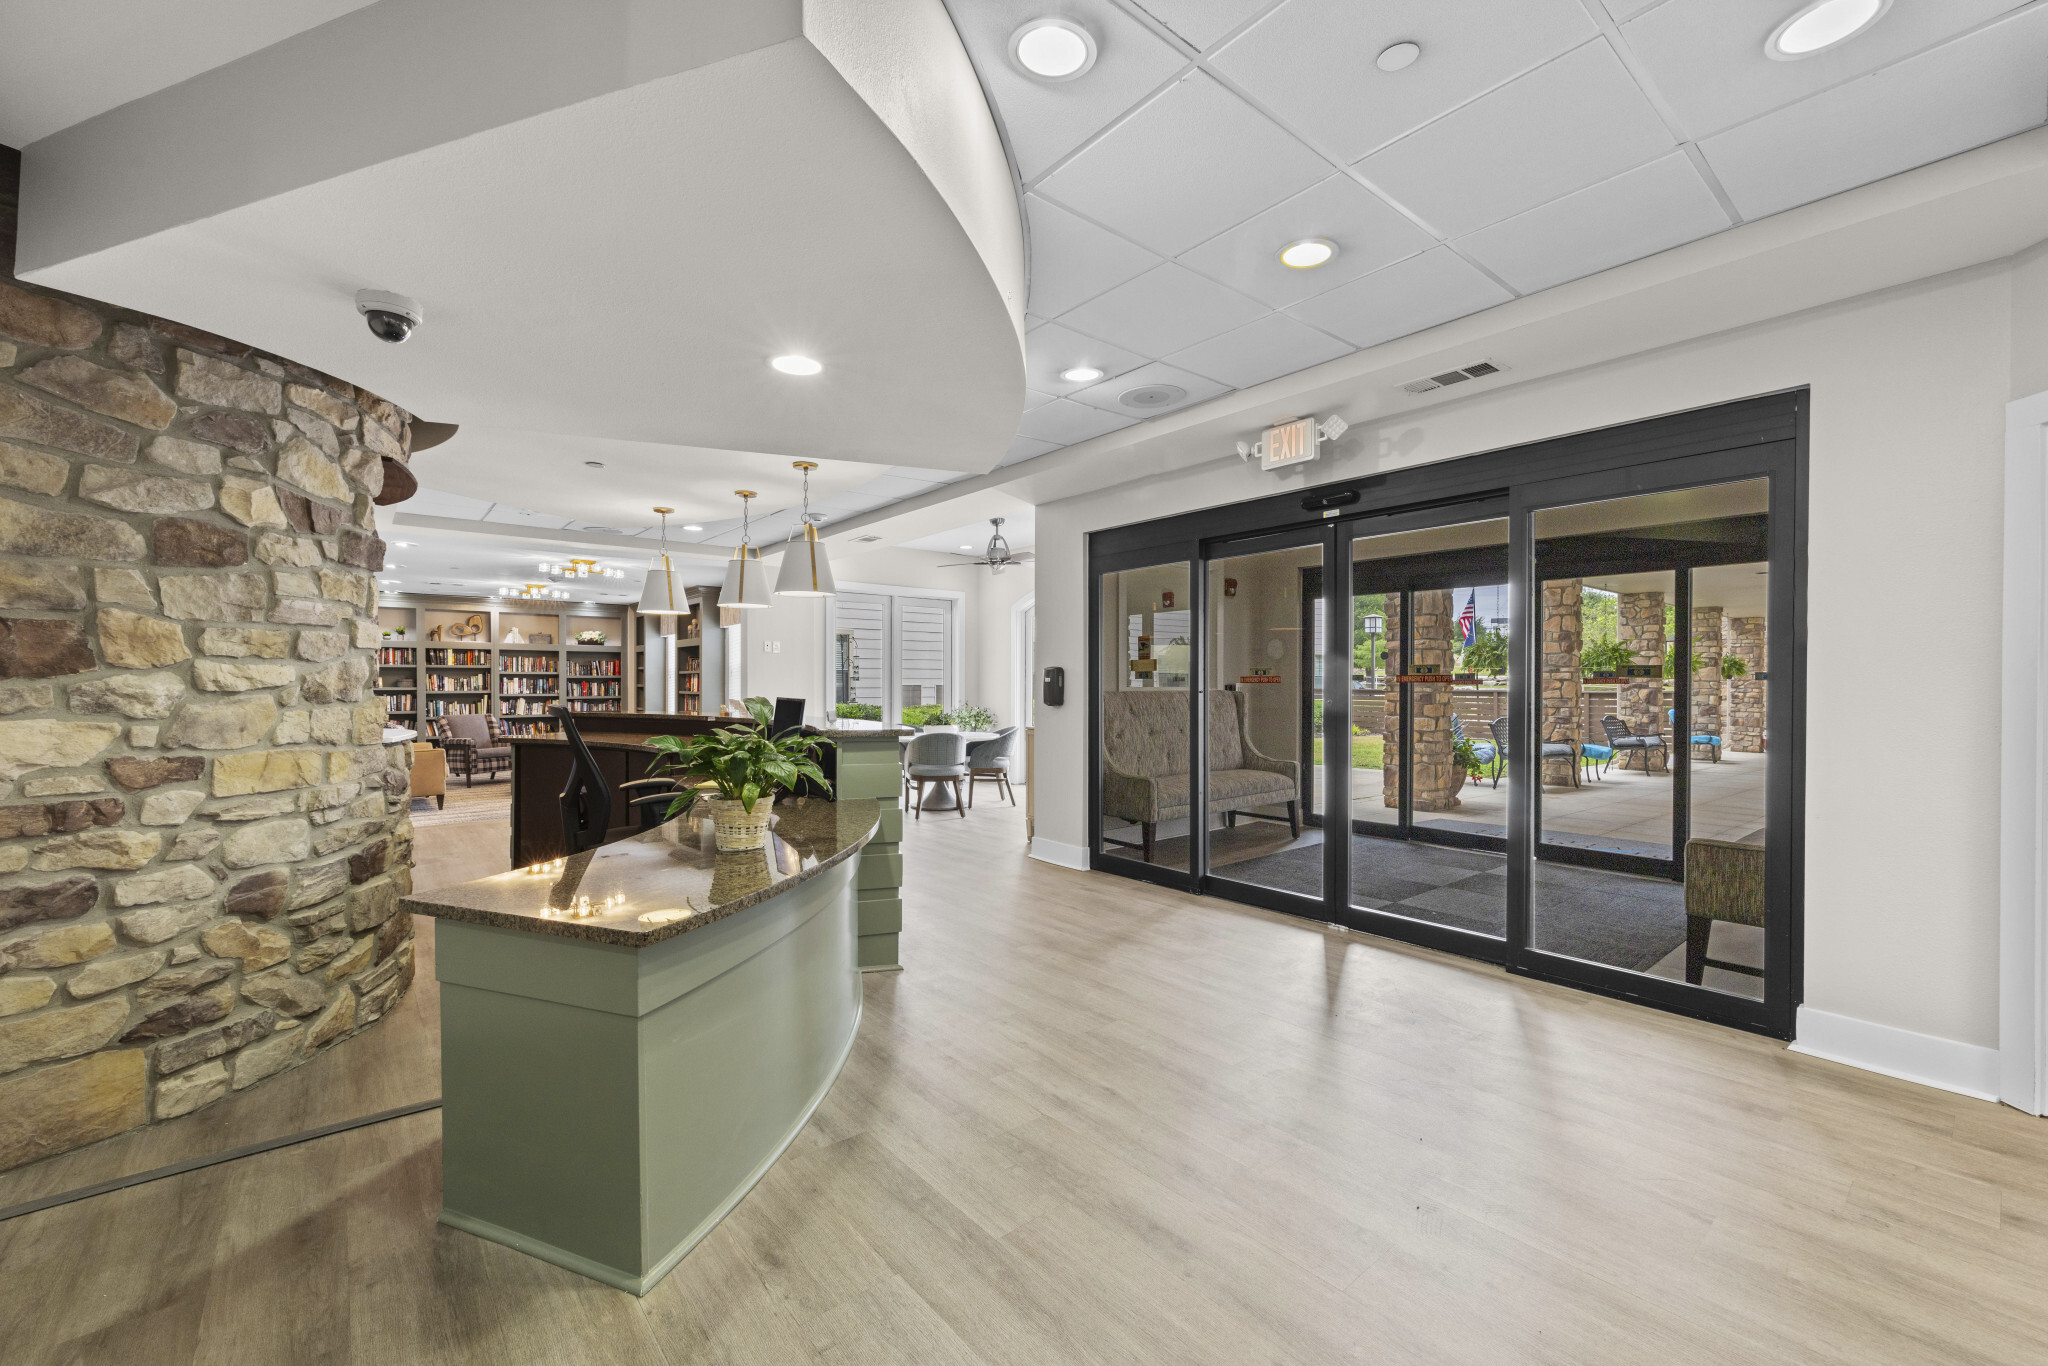
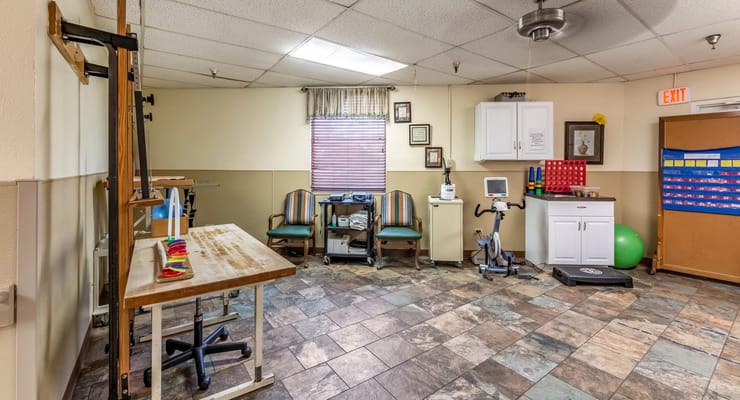
With breathtaking views that inspire healing, San Antonio North Nursing and Rehab boasts state-of-the-art facilities, designed to enhance the recovery journey. The therapy gym is equipped with modern equipment and expert therapists, offering physical, occupational, and speech therapies tailored to each resident’s needs. Located just minutes away from local hospitals, residents have access to quality medical care round the clock.

(210) 225-4588

Quality ratings

Measured by Centers for Medicare & Medicaid Services (CMS)

Overall rating Info The Overall CMS Rating combines results from health inspections, staffing levels and quality measures. Health inspections carry the most weight. Staffing and quality scores can increase or decrease the final rating based on performance compared to state and national standards.
1/5
Texas average: 3.0/5
Health Inspection Info Based on the results of the facility's three most recent standard inspections and any complaint investigations. CMS reviews the number, scope, and severity of deficiencies, with more recent findings weighted more heavily.
2/5
Texas average: 2.9/5
Staffing Info Measures average nursing staff hours per resident per day, including Registered Nurses (RNs) and total nursing staff. Ratings are adjusted based on the level of care residents require and are compared to state and national benchmarks.
1/5
Texas average: 2.4/5
Quality Measures Info Based on clinical and physical health indicators reported to CMS, such as hospital readmissions, falls, pressure ulcers, and improvements in mobility. These measures reflect how well residents' health needs are being managed.
2/5
Texas average: 4.0/5

Nursing care per resident

Info This shows how many total hours of nursing staff time are available per resident each day. Higher numbers usually mean more staff support.
3h 3m per day

This home provides 19% less nursing time per resident than the Texas average.

Texas average: 3h 47m per day

Staffing hours breakdown

Info Hours of care per resident per day, broken down by staff type. Data from CMS Medicare.
Staff type Facility State avg National avg
Registered Nurse (RN) Info Registered nurse hours per resident per day. 19m per day 26m per day 41m per day
Nurse Aide Info Nurse aide hours per resident per day. 1h 30m per day 2h 1m per day 2h 21m per day
Total Nursing (Weekend) Info Total number of nurse staff hours per resident per day on weekends. 2h 12m per day 2h 59m per day 3h 26m per day
Physical Therapist Info Physical therapist staff hours per resident per day. 4m per day 4m per day 4m per day
RN (Weekend) Info Registered nurse hours per resident per day on weekends. 18m per day 21m per day 29m per day

Capacity and availability

Medium-capacity home

Offers a balance of services and community atmosphere.

Total beds 118

This home usually has availability

Lower occupancy suggests more openings may be available.

Lower demand than the Texas average
Occupancy rate 33.9%
Residents per day 40
Occupancy rate
33.9%
Residents per day
40

Who this home usually serves

TYPE OF STAY

Mostly long-term care residents

Most residents stay for extended periods and receive ongoing daily care.

Might be optimal for
Long-term daily care Ongoing support needs

Breakdown by payment type

Medicare

25% of new residents, usually for short-term rehab.

Typical stay 24 days

Private pay

33% of new residents, often for short stays.

Typical stay 1 months

Medicaid

43% of new residents, often for long-term daily care.

Typical stay 10 - 11 months

Finances and operations

Governmental community
Operated by state authorities.
Home revenue
$8.5M
Surplus of revenue
$46.3K
Governmental community Operated by state authorities.
Home revenue
$8.5M
Surplus of revenue
$46.3K
Payroll costs Info The portion of the home's budget spent on staff, including nurses, caregivers, and other employees who support care and operations.
$1
0% of revenue
Other operating costs Info All remaining costs needed to run the home, such as food, utilities, building maintenance, supplies and administrative expenses.
$8.5M
Total costs $8.5M
Bed community size
118-bed community
A larger shared setting that may offer more common spaces and organized community services.
Years in operation
54 years in operation
A longer operating history, which may indicate experience navigating regulations and delivering ongoing care.
Walk Score
Walk Score: 87 / 100
Very walkable. Most errands can be accomplished on foot, and many essentials are within a short walk.

Services

Medicare/medicaid

About this community

Occupancy

Occupancy rate
34%
In line with Texas average
Occupied beds
40 / 118
Average residents 75 per day

License Details

Facility TypeNursing
StatusActive
IssuanceFebruary 28, 2025
ExpirationFebruary 28, 2028
CountyBEXAR

Additional Licensing Details

License Number144848
Year Opened9/1/1971

Ownership & Operating Entity

San Antonio North Nursing and Rehab is administrated by Deanna Truax.

Management CompanyTOBIN HILL NURSING AND REHAB CENTER LLC
OwnerUVALDE COUNTY HOSPITAL AUTHORITY
Ownership TypeLimited Liability Company (LLC)

Type Of Units

Medicare
2 units
Medicaid and Medicare
116 units
Total beds
118 units

Staffing

Key information about the people who lead and staff this community.

Leadership

Administrator Email [email protected]

Contact San Antonio North Nursing and Rehab

Inspection History

In Texas, the Health and Human Services Commission (HHSC) is the primary regulatory body that conducts unannounced inspections and publishes quality reports for all long-term care homes.

20 visits/inspections

8 visits/inspections triggered by complaints

10 routine inspections

Results

20 with issues

0 without issues

Latest inspection

Date December 9, 2025
Other

63 deficiencies

Deficiencies indicate regulatory issues. A higher number implies the facility had several areas requiring improvement.

Texas average: 32 deficiencies

Health Inspection History

Inspections
Total health inspections 18

Texas average 7.4


Last Health inspection on Jul 2025

Total health citations 52

Texas average 25.9

Citations per inspection
2.89

Texas average 3.67


Health citations are formal notices following inspections when they fail to comply with safety and care standards.

13 of 52 citations resulted from standard inspections; 31 of 52 resulted from complaint investigations; and 8 of 52 came from combined inspections (standard and complaint).

Breakdown of citation severity (last 3 years)
Critical Health citations More info 5
150% worse than Texas average

Texas average: 2


Serious Health citations More info 0
100% better than Texas average

Texas average: 0.4

5 critical citations More info Texas average: 2

0 serious citations More info Texas average: 0.4

44 moderate citations More info Texas average: 23

3 minor citations More info Texas average: 0.4
Citations history (last 3 years)
Nutrition moderate citation Info Issues related to food quality, meal service, and resident's nutritional needs. Jul 31, 2025
Corrected

Nutrition minor citation Info Issues related to food quality, meal service, and resident's nutritional needs. Jul 31, 2025
Corrected

Care Planning moderate citation Info Issues related to creating and updating personalized care plans for residents based on their needs and conditions. Jul 31, 2025
Corrected

Resident Rights moderate citation Info Issues related to resident's rights, including dignity, privacy, and the ability to make decisions about their care. Jul 31, 2025
Corrected

Compare Nursing Homes around San Antonio The information below is reported by the Texas Health and Human Services Commission.

5 facilities compared · CMS & TX Dept. of Health data · Updated Apr 2026

Filter by care type
Blue Skies of Texas East
NH

Nursing Home Licensed facility providing 24/7 skilled nursing care for residents with complex, ongoing medical needs. Staffed by RNs, LPNs, and CNAs. Inspected and star-rated annually by CMS. Accepts Medicare (short-term rehab) and Medicaid (long-term care).

AL

Assisted Living A licensed, long-term care setting for seniors or individuals with disabilities who need help with daily activities — like bathing, dressing, and medication management — but not 24-hour skilled nursing. Offers housing, meals, and around-the-clock support while aiming to maximize resident independence.

San Antonio (Valley High North)
80
68.3%
+8%
6.51
+1%
+79%
2
31
3.1
2
46
47
Air Force Village Inc
$15.2M
$4.6M
30%
676041
San Antonio North Nursing and Rehab
NH

Nursing Home Licensed facility providing 24/7 skilled nursing care for residents with complex, ongoing medical needs. Staffed by RNs, LPNs, and CNAs. Inspected and star-rated annually by CMS. Accepts Medicare (short-term rehab) and Medicaid (long-term care).

AL

Assisted Living A licensed, long-term care setting for seniors or individuals with disabilities who need help with daily activities — like bathing, dressing, and medication management — but not 24-hour skilled nursing. Offers housing, meals, and around-the-clock support while aiming to maximize resident independence.

San Antonio (Tobin Hill)
132
61.1%
-4%
3.05
+15%
-16%
4
52
2.9
5
103
87
Tobin Hill Nursing And Rehab Center Llc
$8.1M
$0.0M
0%
455817
Brookdale Hamilton Wolfe
-
NH

Nursing Home Licensed facility providing 24/7 skilled nursing care for residents with complex, ongoing medical needs. Staffed by RNs, LPNs, and CNAs. Inspected and star-rated annually by CMS. Accepts Medicare (short-term rehab) and Medicaid (long-term care).

AL

Assisted Living A licensed, long-term care setting for seniors or individuals with disabilities who need help with daily activities — like bathing, dressing, and medication management — but not 24-hour skilled nursing. Offers housing, meals, and around-the-clock support while aiming to maximize resident independence.

San Antonio
32
-
-
-
-
-
-
-
-
0
0
0.0
0
-
-
-
-
-
-
-
Desert Sands Assisted Living LLC
-
NH

Nursing Home Licensed facility providing 24/7 skilled nursing care for residents with complex, ongoing medical needs. Staffed by RNs, LPNs, and CNAs. Inspected and star-rated annually by CMS. Accepts Medicare (short-term rehab) and Medicaid (long-term care).

AL

Assisted Living A licensed, long-term care setting for seniors or individuals with disabilities who need help with daily activities — like bathing, dressing, and medication management — but not 24-hour skilled nursing. Offers housing, meals, and around-the-clock support while aiming to maximize resident independence.

San Antonio
42
-
-
-
-
-
-
-
-
0
0
0.0
0
-
-
-
-
-
-
-
Discovery Village Stone Oak
-
NH

Nursing Home Licensed facility providing 24/7 skilled nursing care for residents with complex, ongoing medical needs. Staffed by RNs, LPNs, and CNAs. Inspected and star-rated annually by CMS. Accepts Medicare (short-term rehab) and Medicaid (long-term care).

AL

Assisted Living A licensed, long-term care setting for seniors or individuals with disabilities who need help with daily activities — like bathing, dressing, and medication management — but not 24-hour skilled nursing. Offers housing, meals, and around-the-clock support while aiming to maximize resident independence.

San Antonio
125
-
-
-
-
-
-
-
-
0
0
0.0
0
-
-
-
-
-
-
-

Places of interest near San Antonio North Nursing and Rehab

Address 1.2 miles from city center — 0.2 miles to nearest hospital (Methodist Hospital Metropolitan)

Calculate Travel Distance to San Antonio North Nursing and Rehab

Add your location

Address

Staffing Data (Q2 2025)

This data corresponds to Q2 2025 and is based on CMS Payroll-Based Journal.

Total staff 93
Employees 93
Contractors 0
Staff to resident ratio 0.89:1
41% worse than Texas average

Texas average ratio: 1.51:1

Avg staff/day 40
Average shift 8.5 hours
5% better than Texas average

Texas average: 8.1 hours

Total staff hours (quarter) 31,068
Nursing staff breakdown
Registered Nurse

Manages medical care and health needs.

Total count 8
Average shift length Info Average shift length. Calculated as total hours divided by days worked and average staff per day. 8.4 hours

No contractors work on this role.

Licensed Practical Nurse

Assists with medical care and medications.

Total count 13
Average shift length Info Average shift length. Calculated as total hours divided by days worked and average staff per day. 9.5 hours

No contractors work on this role.

Certified Nursing Assistant

Helps with daily care and mobility.

Total count 29
Average shift length Info Average shift length. Calculated as total hours divided by days worked and average staff per day. 9.4 hours

No contractors work on this role.

Contractor staffing

Total hours from contractors

0%

0 contractor hours this quarter

No contractor roles were reported this quarter.

Staff by category
Certified Nursing Assistant2902910,41191100%9.4
Licensed Practical Nurse130135,14291100%9.5
Medication Aide/Technician6062,5859099%9
Registered Nurse8082,56991100%8.4
Physical Therapy Aide110112,5537785%6.8
RN Director of Nursing4041,7756470%8
Speech Language Pathologist5051,3308088%7.2
Other Dietary Services Staff3031,07491100%7.2
Respiratory Therapy Technician4047368290%5.8
Nurse Aide in Training3036956875%8.7
Qualified Social Worker3035886369%7.5
Administrator1015126470%8
Nurse Practitioner1015126470%8
Mental Health Service Worker1014565763%8
Qualified Activities Professional1011291516%8.6
29 Certified Nursing Assistant
% of Days 100%
13 Licensed Practical Nurse
% of Days 100%
6 Medication Aide/Technician
% of Days 99%
8 Registered Nurse
% of Days 100%
11 Physical Therapy Aide
% of Days 85%
4 RN Director of Nursing
% of Days 70%
5 Speech Language Pathologist
% of Days 88%
3 Other Dietary Services Staff
% of Days 100%
4 Respiratory Therapy Technician
% of Days 90%
3 Nurse Aide in Training
% of Days 75%
3 Qualified Social Worker
% of Days 69%
1 Administrator
% of Days 70%
1 Nurse Practitioner
% of Days 70%
1 Mental Health Service Worker
% of Days 63%
1 Qualified Activities Professional
% of Days 16%

Facility Characteristics

Source: CMS Long-Term Care Facility Characteristics (Data as of Jan 2026)

Total census
105 residents
Residents by payment source
Medicare
5 residents (4.8%)
Medicaid
97 residents (92.4%)
Private pay or other
3 residents (2.9%)
Programs & Services
Residents' Group

Residents meet regularly to discuss policies, care quality, and activities

Active Resident Council

Organized group of residents that meets regularly to discuss facility policies, quality of life, and activities.

Quality of care over time

These measures show how residents usually do over time at this home, based on health outcomes and preventive care.

High-risk clinical events score Info A composite score based on pressure ulcers, falls with injury, weight loss, walking ability decline, and activities of daily living decline. 10.5
22% worse than Texas average

Texas average: 8.6

Functional decline score Info A composite score based on activities of daily living decline, walking ability decline, and incontinence. 19.0
18% worse than Texas average

Texas average: 16.0

Long-stay resident measures
Above average Texas avg: 4.2 Info CMS star rating based on long-stay quality measure performance. 5 stars = significantly above average, 1 star = significantly below average.
Need for Help with Daily Activities Increased Info Percent of long-stay residents whose need for help with daily activities has increased 22.4%
39% worse than Texas average

Texas average: 16.2%

Walking Ability Worsened Info Percent of long-stay residents whose ability to move independently worsened 19.3%
19% worse than Texas average

Texas average: 16.2%

Low Risk Residents with Bowel/Bladder Incontinence Info Percent of low risk long-stay residents who lose control of their bowels or bladder 15.1%
In line with Texas average

Texas average: 15.7%

Falls with Major Injury Info Percent of long-stay residents experiencing one or more falls with major injury 6.2%
92% worse than Texas average

Texas average: 3.2%

High Risk Residents with Pressure Ulcers Info Percent of long-stay high risk residents with pressure ulcers 1.4%
68% better than Texas average

Texas average: 4.4%

Urinary Tract Infection Info Percent of long-stay residents with a urinary tract infection 0.9%
6% worse than Texas average

Texas average: 0.8%

Lost Too Much Weight Info Percent of long-stay residents who lose too much weight 3.3%
5% better than Texas average

Texas average: 3.5%

Depressive Symptoms Info Percent of long-stay residents who have depressive symptoms 1.6%
46% better than Texas average

Texas average: 2.9%

Antipsychotic Use Info Percent of long-stay residents who received an antipsychotic medication 0.6%
93% better than Texas average

Texas average: 7.9%

Pneumococcal Vaccine Info Percent of long-stay residents assessed and appropriately given the pneumococcal vaccine 99.2%
In line with Texas average

Texas average: 97.3%

Influenza Vaccine Info Percent of long-stay residents assessed and appropriately given the seasonal influenza vaccine 99.0%
In line with Texas average

Texas average: 97.9%

Hospitalizations per 1,000 days Info Number of hospitalizations per 1,000 long-stay resident days. 1.55
27% better than Texas average

Texas average: 2.13

ED visits per 1,000 days Info Number of outpatient emergency department visits per 1,000 long-stay resident days. 2.20
6% worse than Texas average

Texas average: 2.07

Short-stay resident measures
Significantly below average Texas avg: 2.9 Info CMS star rating based on short-stay quality measure performance. 5 stars = much above average, 1 star = much below average.
Pneumococcal Vaccine Info Percent of short-stay residents assessed and appropriately given the pneumococcal vaccine 77.0%
15% worse than Texas average

Texas average: 90.4%

Antipsychotic medication increase Info Percent of short-stay residents who newly received an antipsychotic medication 2.2%
53% worse than Texas average

Texas average: 1.4%

Influenza Vaccine Info Percent of short-stay residents assessed and appropriately given the seasonal influenza vaccine 79.2%
10% worse than Texas average

Texas average: 88.0%

Re-hospitalized after SNF stay Info Percentage of short-stay residents who were re-hospitalized after their nursing home admission. 30.4%
17% worse than Texas average

Texas average: 25.9%

Emergency department visits Info Percentage of short-stay residents who had an outpatient emergency department visit. 16.4%
37% worse than Texas average

Texas average: 12.0%

Falls with major injury Info Percentage of SNF residents who experience falls with major injury during their stay. 1.6%
113% worse than Texas average

Texas average: 0.8%

Ability to care for self at discharge Info Percentage of residents at or above expected ability to care for themselves at discharge. 31.8%
41% worse than Texas average

Texas average: 53.7%

Penalties and fines

Federal penalties imposed by CMS for regulatory violations, including civil money penalties (fines) and denials of payment for new Medicare/Medicaid admissions.

Source: CMS Penalties Database (Data as of Jan 2026)

Total fines amount $60K
25% lower than Texas average

Texas average: $80K

Number of fines 4
61% more fines than Texas average

Texas average: 2.5

Payment Denials Info Serious action where Medicare and/or Medicaid temporarily stops payments for new residents until issues are fixed. 2
807% more payment denials than Texas average

Texas average: 0.2

Fines amount comparison
This facility $60K
Texas average $80K
Penalty History

Penalties are imposed by CMS for violations of federal nursing home regulations.

Civil Money Penalty Info Fines imposed for noncompliance, which can be assessed per day or per instance of violation. May 28, 2024
$17K
Civil Money Penalty Info Fines imposed for noncompliance, which can be assessed per day or per instance of violation. Jul 26, 2023
$10K
Civil Money Penalty Info Fines imposed for noncompliance, which can be assessed per day or per instance of violation. Jul 26, 2023
$10K
Payment Denial Info Serious action where Medicare and/or Medicaid temporarily stops payments for new residents until issues are fixed. Jul 26, 2023
38 days

Last updated: Jan 2026

Guides for Better Senior Living

Care Cost Calculator: See Prices in Your Area

Nursing Home Data Explorer

Don’t Wait Too Long: 7 Red Flag Signs Your Parent Needs Assisted Living Now

The True Cost of Assisted Living in 2025 – And How Families Are Paying For It

Understanding Senior Living Costs: Pricing Models, Discounts & Financial Assistance

Financial Aid for Texas Seniors

Get financial aid guidance

Community Care for the Aged and Disabled (CCAD)

TX Medicaid CCAD

Age 65+ or disabled, Texas resident, Medicaid-eligible, care need (not always nursing home level).

~$2,829/month (300% FBR, individual).

$2,000 (individual), $3,000 (couple).

Large state; rural access challenges.

Texas Community Care Services

TX CCS

Age 60+, Texas resident, at risk of decline.

~$2,000/month (individual, varies).

$5,000 (individual).

Limited funding; high demand in urban areas.

Area Agency on Aging (AAA) Services

Texas AAA Services

Age 60+, TX resident; no income/asset limits.

None; donations encouraged.

Not assessed.

28 AAAs; includes Meals on Wheels in some areas.

Medicare Savings Program (MSP)

Texas Medicare Savings Program

Age 65+ or disabled, TX resident, Medicare Part A/B.

~$2,510/month (QMB), ~$3,380/month (SLMB), ~$3,598/month (QI)—individual.

$9,430 (individual), $14,130 (couple).

Includes Extra Help for Part D; no waitlist.

Low-Income Home Energy Assistance Program (LIHEAP)

Texas Comprehensive Energy Assistance Program (CEAP)

Age 60+ prioritized, TX resident, low-income.

~$3,970/month (185% FPL).

Not assessed.

Priority for elderly/disabled; covers gas, electric, propane.

Family Caregiver Support Program (FCSP)

Texas Family Caregiver Support Program

Caregivers of 60+ needing care or 55+ caregivers of others; TX resident; 2+ ADLs.

No strict cap; prioritizes low-income (~$24,980/year).

Not assessed.

High rural demand; includes grandparent caregivers.

Senior Community Service Employment Program (SCSEP)

Texas SCSEP

Age 55+, unemployed, low-income, TX resident.

~$1,983/month (125% FPL).

Not specified.

Priority for veterans, rural residents; AARP partnership.

VA Aid and Attendance (A&A) and Housebound Benefits

Texas VA Aid and Attendance/Housebound

Age 65+ or disabled veteran/spouse, TX resident, wartime service, ADL help (A&A) or homebound.

Net income < ~$1,984/month (veteran with dependent, A&A); pension offsets income.

~$155,356 (net worth).

High veteran population; supports rural/urban needs.

Property Tax Exemption for Seniors

Texas Senior Property Tax Exemption

Age 65+, TX resident, homeowner (homestead).

None; tax-based eligibility.

Not assessed.

$25,000+ exemption; optional freeze in some counties; saves ~$500-$1,000/year.

Senior Farmers’ Market Nutrition Program (SFMNP)

Texas SFMNP

Age 60+, TX resident, low-income.

~$2,322/month (185% FPL).

Not assessed.

Vouchers (~$50/season); serves ~20,000 via 28 AAAs.