San Francisco Health Care and Rehab Inc.
Nursing Home · San Francisco, CA
CMS overall rating Info The Overall CMS Rating is scored from 1 to 5 stars and combines results from health inspections, staffing levels, and quality measures. Health inspections carry the most weight. Staffing and quality scores can increase or decrease the final rating based on performance compared to state and national standards.

San Francisco Health Care and Rehab Inc.

Nursing Home · San Francisco, CA
CMS overall rating Info The Overall CMS Rating is scored from 1 to 5 stars and combines results from health inspections, staffing levels, and quality measures. Health inspections carry the most weight. Staffing and quality scores can increase or decrease the final rating based on performance compared to state and national standards.
Calculator: See prices in your area
San Francisco Health Care and Rehab Inc. accepts Medicare, Medicaid, and private pay.

Overview of San Francisco Health Care and Rehab INC.

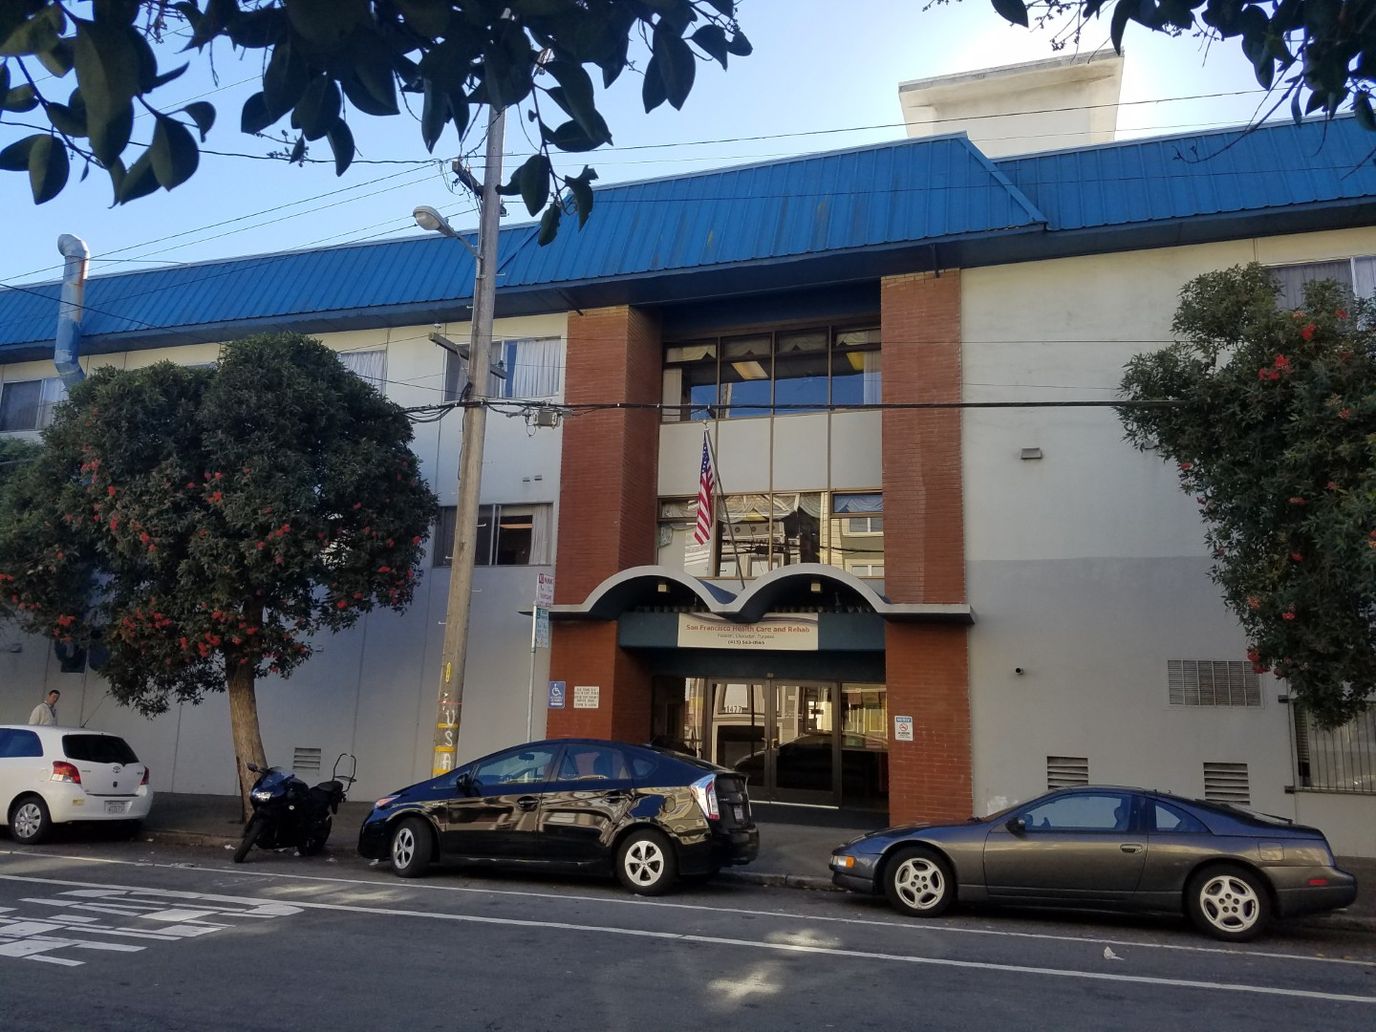
San Francisco Health Care is a renowned nursing home in San Francisco, CA, that offers nursing services, therapy, mental health services, and other medical services. With 24-hour care options, older adults receive the utmost attention for their comfort and safety. X-ray, housekeeping, and pharmacy services are just some of the community’s unique offerings, dedicated to improving older adults’ quality of life. The community also strives to promote diversity and inclusivity with a multilingual team and a welcoming setting, ensuring older adults feel a sense of belonging during their stay.

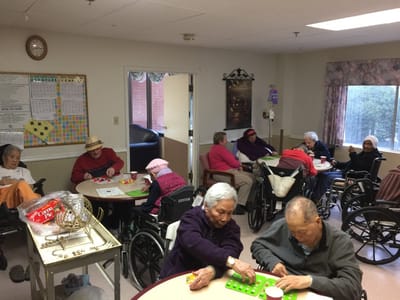
Parties, light exercises, and community events are conducted to encourage residents to make new friends and have fun. A restaurant-style dining is also provided, so residents have a hassle-free dining experience that caters to their dietary needs and preferences. Occupational, speech, and physical therapy are also provided to help residents go back to their routines. As one of San Francisco’s trusted nursing homes, this senior living community makes a good option for those seeking a wide range of care for their healthcare needs.

Quality ratings

Measured by Centers for Medicare & Medicaid Services (CMS)

Overall rating Info The Overall CMS Rating combines results from health inspections, staffing levels and quality measures. Health inspections carry the most weight. Staffing and quality scores can increase or decrease the final rating based on performance compared to state and national standards.
▼ 72.2% Below CA avg. ▼ 72.2% Below CA avg.Click the badge to see the full State ranking.Click here to see the full State ranking.
Health Inspection Info Based on the results of the facility's three most recent standard inspections and any complaint investigations. CMS reviews the number, scope, and severity of deficiencies, with more recent findings weighted more heavily.
▼ 68.3% Below CA avg. ▼ 68.3% Below CA avg.Click the badge to see the full State ranking.Click here to see the full State ranking.
Staffing Info Measures average nursing staff hours per resident per day, including Registered Nurses (RNs) and total nursing staff. Ratings are adjusted based on the level of care residents require and are compared to state and national benchmarks.
▼ 13.0% Below CA avg. ▼ 13.0% Below CA avg.Click the badge to see the full State ranking.Click here to see the full State ranking.
Quality Measures Info Based on clinical and physical health indicators reported to CMS, such as hospital readmissions, falls, pressure ulcers, and improvements in mobility. These measures reflect how well residents' health needs are being managed.
▼ 6.1% Below CA avg. ▼ 6.1% Below CA avg.Click the badge to see the full State ranking.Click here to see the full State ranking.

Staffing hours breakdown

Info Daily nursing hours per resident by staff type, reported to CMS. Higher is generally better — compare this facility to state and national averages to see where staffing stands.

Hours per resident per day — compared to California state averages

Total nursing care / resident Info This home is ranked 124th out of 275 homes in California.

Total adjusted nursing hours per resident per day, combining RN, LPN, and aide time. CMS adjusts this for case-mix so facilities can be fairly compared.
4h 6m per day
Rank #124 / 275Nurse hours — State benchmarkedThis home is ranked 124th out of 275 homes in California.Shows adjusted nurse hours per resident per day benchmarked to the California average, with a ranking across 275 California SNFs. More hours mean more direct care. The national average is about 3.5 hrs; below 3.0 is a red flag.Click the rank badge to see the full State ranking.Click here to see the full State ranking.
This facility California avg (4h 23m per day)
vs California avg
-6%

2 of 6 metrics below state avg

Standout metric RN (Weekend) is +80% above state avg
Staff typeHours / Day / Residentvs state avg
Registered Nurse (RN) Info RNs hold the highest nursing license and can assess residents, interpret test results, and direct care plans. More RN hours per day often signals stronger clinical oversight and faster response to health changes. 53m per day ▲ 36% State avg: 39m per day · National avg: 41m per day
LPN / LVN Info Licensed Practical Nurses (LPNs) or Licensed Vocational Nurses (LVNs) deliver routine hands-on care — medication administration, wound dressing, and monitoring vital signs. They work under RN supervision and make up a large share of daily bedside care. 25m per day ▼ 66% State avg: 1h 13m per day · National avg: 52m per day
Nurse Aide Info Certified Nurse Aides (CNAs) provide the most direct day-to-day assistance: bathing, dressing, feeding, and mobility. Nurse aide hours are typically the largest staffing category and directly affect residents' quality of life. 2h 45m per day ▲ 4% State avg: 2h 39m per day · National avg: 2h 21m per day
Total Nursing (Weekend) Info Combined nursing hours (RN + LPN + Nurse Aide) per resident per day on weekends. Staffing often drops on weekends — this figure reveals whether the facility maintains adequate coverage outside of weekday hours. 3h 37m per day ▼ 12% State avg: 4h 5m per day · National avg: 3h 26m per day
Physical Therapist Info Hours per resident per day provided by licensed Physical Therapists (PTs) or PT Assistants. PT services help residents recover mobility after injury or illness and are especially important for post-acute (short-stay) rehabilitation. 6m per day ▲ 20% State avg: 5m per day · National avg: 4m per day
RN (Weekend) Info Registered nurse hours specifically on weekends. Facilities sometimes reduce RN presence on Saturdays and Sundays — a low weekend RN figure compared to weekday hours can indicate reduced clinical oversight when most administrative staff are absent. 54m per day ▲ 80% State avg: 30m per day · National avg: 29m per day

Capacity and availability

This home usually has availability

Occupancy lower than 85% suggests more openings may be available.

Lower occupancy than the California average: 84.7%
Occupancy rate 60.2% Rank #256 / 281Occupancy rate — State benchmarkedThis home is ranked 256th out of 281 homes in California.Shows this facility's occupancy rate versus the California average, with its Statewide rank out of 281. Higher occupancy signals strong local demand and financial stability.Click the rank badge to see the full State ranking.Click here to see the full State ranking.
Avg. Length of Stay 134 days
Occupancy rate
60.2% Rank #256 / 281Occupancy rate — State benchmarkedThis home is ranked 256th out of 281 homes in California.Shows this facility's occupancy rate versus the California average, with its Statewide rank out of 281. Higher occupancy signals strong local demand and financial stability.Click the rank badge to see the full State ranking.Click here to see the full State ranking.
Avg. Length of Stay
134 days

Who this home usually serves

TYPE OF STAY

Mix of rehab and long-term care

This home supports both short-term rehab and long-term care, with residents staying for a wide range of durations.

Breakdown by payment type

Medicare

37% of new residents, usually for short-term rehab.

Typical stay 1 - 2 months

Private pay

58% of new residents, often for short stays.

Typical stay 1 - 2 months

Medicaid

4% of new residents, often for long-term daily care.

Typical stay 5 - 6 years

Finances and operations

Privately-owned community
Operated by a business corporation.
Home revenue
$18.3M
Profit
$260.7K
Privately-owned community Operated by a business corporation.
Home revenue
$18.3M Rank #124 / 279Revenue — State benchmarkedThis home is ranked 124th out of 279 homes in California.Shows this facility's annual revenue compared to the California SNF average. Higher revenue generally means more resources for staffing and capital — read alongside Payroll %.Click the rank badge to see the full State ranking.Click here to see the full State ranking.
Profit
$260.7K
Payroll costs Info The portion of the home's budget spent on staff, including nurses, caregivers, and other employees who support care and operations. Rank #106 / 279Payroll — State benchmarkedThis home is ranked 106th out of 279 homes in California.Shows total annual staff payroll benchmarked to the California average. Higher payroll investment relative to peers often signals better staffing and less reliance on cheaper contract labor.Click the rank badge to see the full State ranking.Click here to see the full State ranking.
$10.6M
57.9% of revenue Rank #81 / 279Payroll % — State benchmarkedThis home is ranked 81st out of 279 homes in California.Shows payroll as a percentage of revenue versus the California average. Well-run California SNFs typically land around 56–66% — the top third Statewide. Below 25% may signal understaffing or heavy agency use — read with Staffing ratings.Click the rank badge to see the full State ranking.Click here to see the full State ranking.
Other operating costs Info All remaining costs needed to run the home, such as food, utilities, building maintenance, supplies and administrative expenses.
$7.4M
Total costs $18.0M
Walk Score
Walk Score: 96 / 100 Rank #6 / 279Walk Score — State benchmarkedThis home is ranked 6th out of 279 homes in California.Shows how walkable this facility's neighborhood is compared to the average Walk Score across California SNFs. Higher scores benefit residents, families, and staff.Click the rank badge to see the full State ranking.Click here to see the full State ranking.
Walker's paradise. Daily errands do not require a car, with many shops and services nearby.
BBB Rating
BBB Rating: A- (Not Accredited)
An independent rating from the Better Business Bureau based on factors such as complaint history, transparency, and business practices.
How BBB ratings work

License Details

CMS Certification Number56272

What does this home offer?

Housing options icon

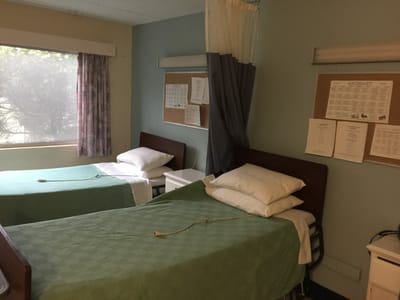
Housing Options: Private / Shared Rooms

Building type icon
Building type icon

Building Type: 2-story

Dining services icon

Dining Services

Housekeeping icon
Housekeeping icon

Housekeeping Services

Social and recreational activities icon

Social and Recreational Activities

Rehabilitative support icon

Rehabilitative Support

On-site medical care and health services icon

On-site Medical Care and Health Services

Types of Care at San Francisco Health Care and Rehab Inc.

Nursing Home

Contact San Francisco Health Care and Rehab Inc.

Inspection History

In California, the Department of Social Services (for assisted living facilities) and the Department of Public Health (for nursing homes) conduct inspections to ensure resident safety and regulatory compliance.

Since 2021 · 5 years of data 38 citations 0 complaint visits

Inspection Scorecard Info This scorecard compares key inspection, citation, and complaint metrics at this facility against the California state average. Metrics rated ≥15% worse than average are highlighted in red; those ≥15% better are highlighted in green.

Since 2021 vs. California state average
Latest Inspection February 28, 2025 Routine

Citations Info Citations are formal regulatory issues recorded during state inspections.

MetricThis FacilityCA Averagevs. CA Avg
Total citations Info Formal regulatory issues recorded by inspectors across all inspection types. 3810 This facility has 280% more total citations than a typical California nursing home (38 vs. CA avg 10). Click this badge to view the full California ranking.↑ 280% worse
Citations per year Info Average citations per year since 2021. 7.62 This facility has 280% more citations per year than a typical California nursing home (7.6 vs. CA avg 2). Click this badge to view the full California ranking.↑ 280% worse

Inspections & Visits Info State inspections evaluate whether the facility meets health and safety standards.

MetricThis FacilityCA Averagevs. CA Avg
Total visits Info Combined count of complaint visits, other regulatory visits, and official scheduled inspections. 016 This facility has 100% fewer total visits than a typical California nursing home (0 vs. CA avg 16). Click this badge to view the full California ranking.↓ 100% better
Complaint visits Info On-site visits triggered by formal complaints filed by residents, families, or staff. 013 This facility has 100% fewer complaint visits than a typical California nursing home (0 vs. CA avg 13). Click this badge to view the full California ranking.↓ 100% better
Other visits Info Regulatory visits that are neither routine inspections nor complaint investigations — administrative check-ins, follow-up reviews, licensing-related visits. 07 This facility has 100% fewer other visits than a typical California nursing home (0 vs. CA avg 7). Click this badge to view the full California ranking.↓ 100% better

Inspection Reports Summary Info An editor-reviewed summary of the themes and findings across this facility's recent inspection reports.

This facility’s inspection record is mixed, showing ongoing issues with medication errors, care planning, infection control, and environmental safety. On February 28, 2025, inspectors cited 15 deficiencies including a 25.9% medication error rate, inadequate care plans, environmental hazards causing falls, poor kitchen sanitation, and failure to implement infection control precautions. Earlier findings included immediate jeopardy for unsafe smoking practices in January 2024 and substantiated complaints for inadequate care planning and supervision in April 2023.

Read the full inspection reports for this facility, including detailed findings and corrective actions.

Show Inspection Reports

Health Inspection History

Inspections Since 2021
Total health inspections 7

California average 12.5


Last Health inspection on Feb 2025

Total health citations
36 Rank #119 / 279Health citations — State benchmarkedThis home is ranked 119th out of 279 homes in California.Shows this facility's total health deficiency citations benchmarked to the California State average, with a ranking across all 279 CA SNFs. Lower citation counts earn a better rank.Click the rank badge to see the full State ranking.Click here to see the full State ranking.

California average 50.2

Citations per inspection
5.14 Rank #196 / 279Citations per inspection — State benchmarkedThis home is ranked 196th out of 279 homes in California.Shows average deficiency citations per CMS inspection for this facility versus the California mean across 279 SNFs with citation data. Lower is better.Click the rank badge to see the full State ranking.Click here to see the full State ranking.

California average 4.65


Health citations are formal notices following inspections when they fail to comply with safety and care standards.

30 of 36 citations resulted from standard inspections; and 6 of 36 resulted from complaint investigations.

Breakdown of citation severity (last 5 years)
Critical Health citations
1
150% worse than California average

California average: 0.4


Serious Health citations
2
100% worse than California average

California average: 1

1 critical citation California average: 0.4

2 serious citations California average: 1

33 moderate citations California average: 47.2

0 minor citations California average: 1.5
Citations history (last 5 years)
Environmental moderate citation Feb 28, 2025
Corrected

Infection Control moderate citation Feb 28, 2025
Corrected

Nutrition moderate citation Feb 28, 2025
Corrected

Nutrition moderate citation Feb 28, 2025
Corrected

Financial Assistance for
Nursing Home in California

San Francisco Health Care and Rehab Inc. is located in San Francisco, California.
Here are the financial assistance programs available to residents in California.

Get Financial aid guidance

Multipurpose Senior Services Program

MSSP (Medi-Cal Waiver)

Age 65+
General California resident, Medi-Cal eligible, nursing home risk.
Income Limits (2025) ~$2,829/month 300% FBR, individual
Asset Limits $2,000 (individual), $3,000 (couple).
CA

County-managed; waitlists possible.

Benefits
In-home support (4-6 hours/day) Respite care (14 days/year) Meals (~$6/meal) Transportation (8 trips/month) Care management

In-Home Supportive Services (IHSS)

California IHSS

Age 65+
General California resident, Medicaid-eligible or low-income.
Income Limits ~$1,732/month individual, Medi-Cal threshold
Asset Limits $2,000 individual
CA

Can hire family as caregivers.

Benefits
Personal care (up to 283 hours/month) Homemaker services Respite (varies)

Multipurpose Senior Services Program (MSSP)

CA MSSP

Age 65+
General California resident, Medi-Cal-eligible, nursing home-eligible but community-capable.
Income Limits ~$2,829/month 300% FBR, individual
Asset Limits $2,000 individual
CA

Available in 38 counties; waitlists common.

Benefits
Case management Respite care (up to 10 days/year) Minor home mods (avg. $500) Adult day care (~$50/day)

Property Tax Postponement Program (PTP)

CA PTP

Age 62+
General California resident, own and live in home, 40% equity.
Income Limits (2025) ~$51,500/year household, adjusted annually
Asset Limits Equity-based; no strict asset cap.
CA

Deferred taxes accrue interest (5% as of 2024); repaid upon sale/death.

Benefits
Property tax deferral (avg. $1,000-$3,000/year, varies by county)

Assisted Living Waiver (ALW)

CA ALW

Age 65+ or disabled
General California resident, Medi-Cal-eligible, nursing home-eligible.
Income Limits ~$2,829/month 300% FBR, individual
Asset Limits $2,000 individual
CA

Available in 15 counties (e.g., LA, Sacramento); waitlists common.

Benefits
Personal care in ALFs (5-7 hours/day) Medication management Social services

California CARES Program

CA CARES

Age
General Caregivers of California residents 60+ needing help with 3+ daily activities; no caregiver age limit.
Income Limits No strict limit; cost-sharing above ~$2,500/month threshold.
Asset Limits Not applicable; need-based.
CA

High demand in urban areas; complements IHSS respite.

Benefits
Respite care (up to 10 days/year) Counseling (4-6 sessions/year) Training (2-3 workshops/year) Supplies (~$200/year)

Places of interest near San Francisco Health Care and Rehab Inc.

Address 1.6 miles from city center Info Estimated distance in miles from San Francisco's city center to San Francisco Health Care and Rehab Inc.'s address, calculated via Google Maps.

Calculate Travel Distance to San Francisco Health Care and Rehab Inc.

Add your location

Address

Staffing Data

Reporting period: April 1 – June 30, 2025 (Q2 2025). Source: CMS Payroll-Based Journal report.

Total staff 213
Employees 55
Contractors 158
Staff to resident ratio 1.95:1
1954028% better than California average
California average ratio: 0.00:1 California average ratio: 0.00:1See full California ranking
Avg staff/day 61
Average shift 8.7 hours
13% better than California average
California average: 7.7 hours California average shift: 7.7 hoursSee full California ranking
Total staff hours (quarter) 48,226

Nursing staff breakdown

Q2 2025 · Apr 1 – Jun 30 More info This data comes from the CMS Payroll-Based Journal report covering April 1 – June 30, 2025.
Registered Nurse

Manages medical care and health needs.

Total count 24
Average shift length Info Average shift length. Calculated as total hours divided by days worked and average staff per day. 9.3 hours

This role is partially covered by contractors.

Licensed Practical Nurse

Assists with medical care and medications.

Total count 35
Average shift length Info Average shift length. Calculated as total hours divided by days worked and average staff per day. 7.7 hours

This role is partially covered by contractors.

Certified Nursing Assistant

Helps with daily care and mobility.

Total count 138
Average shift length Info Average shift length. Calculated as total hours divided by days worked and average staff per day. 8.8 hours

This role is partially covered by contractors.

Contractor staffing

Q2 2025 · Apr 1 – Jun 30 More info This data comes from the CMS Payroll-Based Journal report covering April 1 – June 30, 2025.

Total hours from contractors

52%

25,097 contractor hours this quarter

Certified Nursing Assistant: 104 Licensed Practical Nurse: 29 Registered Nurse: 15 Respiratory Therapy Technician: 4 Physical Therapy Assistant: 2 Speech Language Pathologist: 1 Qualified Social Worker: 1 Medical Director: 1 Nurse Practitioner: 1

Staff by category

Q2 2025 · Apr 1 – Jun 30 More info This data comes from the CMS Payroll-Based Journal report covering April 1 – June 30, 2025.
Certified Nursing Assistant3410413829,01191100%8.8
Registered Nurse915248,68791100%9.3
Licensed Practical Nurse629354,14591100%7.7
Occupational Therapy Aide5052,19091100%7.6
Physical Therapy Assistant0221,2307380%11.3
Respiratory Therapy Technician0441,1187077%8.4
Speech Language Pathologist0116796268%11
Clinical Nurse Specialist1014966268%8
Nurse Practitioner0113924954%8
Qualified Social Worker0112305965%3.9
Medical Director0114867%8
138 Certified Nursing Assistant
% of Days 100%
24 Registered Nurse
% of Days 100%
35 Licensed Practical Nurse
% of Days 100%
5 Occupational Therapy Aide
% of Days 100%
2 Physical Therapy Assistant
% of Days 80%
4 Respiratory Therapy Technician
% of Days 77%
1 Speech Language Pathologist
% of Days 68%
1 Clinical Nurse Specialist
% of Days 68%
1 Nurse Practitioner
% of Days 54%
1 Qualified Social Worker
% of Days 65%
1 Medical Director
% of Days 7%

Facility Characteristics

Source: CMS Long-Term Care Facility Characteristics (Data as of Jan 2026)

Total residents 109
Medicare
20
18.3% of residents
Medicaid
65
59.6% of residents
Private pay or other
24
22% of residents
Programs & Services
Residents Group

Residents meet regularly to discuss policies, care quality, and activities

Active Resident Council

Organized group of residents that meets regularly to discuss facility policies, quality of life, and activities.

Quality of care over time

These measures show how residents usually do over time at this home, based on health outcomes and preventive care.

High-risk clinical events score Info A composite score based on pressure ulcers, falls with injury, weight loss, walking ability decline, and activities of daily living decline. 6.9
In line with California average

California average: 6.6

Functional decline score Info A composite score based on activities of daily living decline, walking ability decline, and incontinence. 10.9
In line with California average

California average: 11.3

Long-stay resident measures
Above average California avg: 4.2 Info CMS star rating based on long-stay quality measure performance. 5 stars = significantly above average, 1 star = significantly below average.
Need for Help with Daily Activities Increased Info Percent of long-stay residents whose need for help with daily activities has increased 11.7%
6% worse than California average

California average: 11.1%

Walking Ability Worsened Info Percent of long-stay residents whose ability to move independently worsened 11.9%
In line with California average

California average: 12.0%

Low Risk Residents with Bowel/Bladder Incontinence Info Percent of low risk long-stay residents who lose control of their bowels or bladder 9.1%
20% better than California average

California average: 11.3%

Falls with Major Injury Info Percent of long-stay residents experiencing one or more falls with major injury 1.6%
In line with California average

California average: 1.7%

High Risk Residents with Pressure Ulcers Info Percent of long-stay high risk residents with pressure ulcers 2.6%
48% better than California average

California average: 5.0%

Urinary Tract Infection Info Percent of long-stay residents with a urinary tract infection 0.6%
56% better than California average

California average: 1.2%

Lost Too Much Weight Info Percent of long-stay residents who lose too much weight 6.6%
57% worse than California average

California average: 4.2%

Depressive Symptoms Info Percent of long-stay residents who have depressive symptoms 0.6%
91% better than California average

California average: 6.7%

Antipsychotic Use Info Percent of long-stay residents who received an antipsychotic medication 6.4%
36% better than California average

California average: 10.1%

Pneumococcal Vaccine Info Percent of long-stay residents assessed and appropriately given the pneumococcal vaccine 96.0%
In line with California average

California average: 98.5%

Influenza Vaccine Info Percent of long-stay residents assessed and appropriately given the seasonal influenza vaccine 99.0%
In line with California average

California average: 98.2%

Hospitalizations per 1,000 days Info Number of hospitalizations per 1,000 long-stay resident days. 2.29
In line with California average

California average: 2.25

ED visits per 1,000 days Info Number of outpatient emergency department visits per 1,000 long-stay resident days. 2.35
48% worse than California average

California average: 1.59

Short-stay resident measures
Significantly above average California avg: 3.5 Info CMS star rating based on short-stay quality measure performance. 5 stars = much above average, 1 star = much below average.
Pneumococcal Vaccine Info Percent of short-stay residents assessed and appropriately given the pneumococcal vaccine 70.0%
25% worse than California average

California average: 94.0%

Antipsychotic medication increase Info Percent of short-stay residents who newly received an antipsychotic medication 1.3%
11% better than California average

California average: 1.5%

Influenza Vaccine Info Percent of short-stay residents assessed and appropriately given the seasonal influenza vaccine 64.4%
31% worse than California average

California average: 93.2%

Re-hospitalized after SNF stay Info Percentage of short-stay residents who were re-hospitalized after their nursing home admission. 17.1%
26% better than California average

California average: 23.2%

Emergency department visits Info Percentage of short-stay residents who had an outpatient emergency department visit. 16.0%
43% worse than California average

California average: 11.2%

Falls with major injury Info Percentage of SNF residents who experience falls with major injury during their stay. 0.0%
100% better than California average

California average: 0.8%

Ability to care for self at discharge Info Percentage of residents at or above expected ability to care for themselves at discharge. 66.7%
24% better than California average

California average: 53.7%

Successful return to home or community Info Rate of successful return to home or community from a skilled nursing facility. 50.6%
In line with California average

California average: 50.6%

Penalties and fines

Federal penalties imposed by CMS for regulatory violations, including civil money penalties (fines) and denials of payment for new Medicare/Medicaid admissions.

Source: CMS Penalties Database (Data as of Jan 2026)

Total fines amount $152K Rank #72 / 129Federal fines — State benchmarkedThis home is ranked 72nd out of 129 homes in California.Shows this facility's cumulative CMS federal fine dollars versus the California average among facilities with fines, and where it ranks among 129 skilled nursing facilities in the pool. Lower total dollars mean a better rank.Click the rank badge to see the full State ranking.Click here to see the full State ranking.
179% higher than California average

California average: $55K

Number of fines 2
15% fewer fines than California average

California average: 2.4

Payment Denials Info Serious action where Medicare and/or Medicaid temporarily stops payments for new residents until issues are fixed. 0
100% fewer payment denials than California average

California average: 0.5

Fines amount comparison
This facility $152K
California average $55K
Penalty History

Penalties are imposed by CMS for violations of federal nursing home regulations.

2 penalties in the past 3 years

Multiple penalties were reported in the last 3 years.

Civil Money Penalty Info Fines imposed for noncompliance, which can be assessed per day or per instance of violation. Feb 28, 2025
$29K
Civil Money Penalty Info Fines imposed for noncompliance, which can be assessed per day or per instance of violation. Jan 22, 2024
$124K

Last updated: Jan 2026

Compare Nursing Home around San Francisco

The information below is reported by the California Department of Social Services and Department of Public Health.

2 facilities compared · CMS & CA Dept. of Health data

Filter by care type
The Avenues Transitional Care Center
NH

Nursing Home Licensed facility providing 24/7 skilled nursing care for residents with complex, ongoing medical needs. Staffed by RNs, LPNs, and CNAs. Inspected and star-rated annually by CMS. Accepts Medicare (short-term rehab) and Medicaid (long-term care).

HC

Home Care Professional care delivered in the person's own home — from companionship and errands to skilled nursing and therapy. Allows seniors to age in place. Medicare covers skilled home health when medically necessary.

MC

Memory Care Secured, specialized care for people living with Alzheimer's or dementia. Staff trained in cognitive impairment, with higher staff-to-resident ratios and an environment designed to reduce confusion and wandering risk.

RC

Respite Care Short-term temporary care — days to weeks — to give family caregivers a break. Full care provided during the stay. Often used after hospitalization or to trial a facility before a permanent placement decision.

San Francisco (Outer Sunset)140 88.1% +4%4.22 -9%0%$0263.71128A 85 Craig Orgill$24.6M$14.3M57.9%55963
San Francisco Health Care and Rehab Inc.
NH

Nursing Home Licensed facility providing 24/7 skilled nursing care for residents with complex, ongoing medical needs. Staffed by RNs, LPNs, and CNAs. Inspected and star-rated annually by CMS. Accepts Medicare (short-term rehab) and Medicaid (long-term care).

San Francisco (North Of The Panhandle)168 60.2% -29%4.10 +32%-3%$152.4k365.13121A- 96 Stan Stukov$18.3M$10.6M57.9%56272

Guides for Better Senior Living

Care Cost Calculator: See Prices in Your Area

Nursing Home Data Explorer

Don’t Wait Too Long: 7 Red Flag Signs Your Parent Needs Assisted Living Now

The True Cost of Assisted Living in 2025 – And How Families Are Paying For It

Understanding Senior Living Costs: Pricing Models, Discounts & Financial Assistance

Frequently Asked Questions about San Francisco Health Care and Rehab Inc.

What neighborhood is San Francisco Health Care and Rehab Inc. in?

San Francisco Health Care and Rehab Inc. is in the North of the Panhandle neighborhood of San Francisco.

Is San Francisco Health Care and Rehab Inc. in a walkable area?

San Francisco Health Care and Rehab Inc. has a walk score of 96. Walker's paradise. Daily errands do not require a car, with many shops and services nearby.

What is the address of San Francisco Health Care and Rehab Inc.?

San Francisco Health Care and Rehab Inc. is located at 1477 Grove St, San Francisco, CA 94117, United States.

What is the phone number of San Francisco Health Care and Rehab Inc.?

(415) 563-0565 will put you in contact with the team at San Francisco Health Care and Rehab Inc..

Is San Francisco Health Care and Rehab Inc. Medicare or Medicaid certified?

Yes — San Francisco Health Care and Rehab Inc. is a CMS-certified provider of Medicare and Medicaid.

Explore Open Rooms
1 Contact details
2 What type of senior care service are you looking for?
3 What budget do you have in mind for senior care?
4 How soon do you need to find care?
5 Additional details

Thank you for your interest!

Our team will be in touch shortly to help with next steps.