Nursing Home

Sandstone Nephi

Overview of Sandstone Nephi

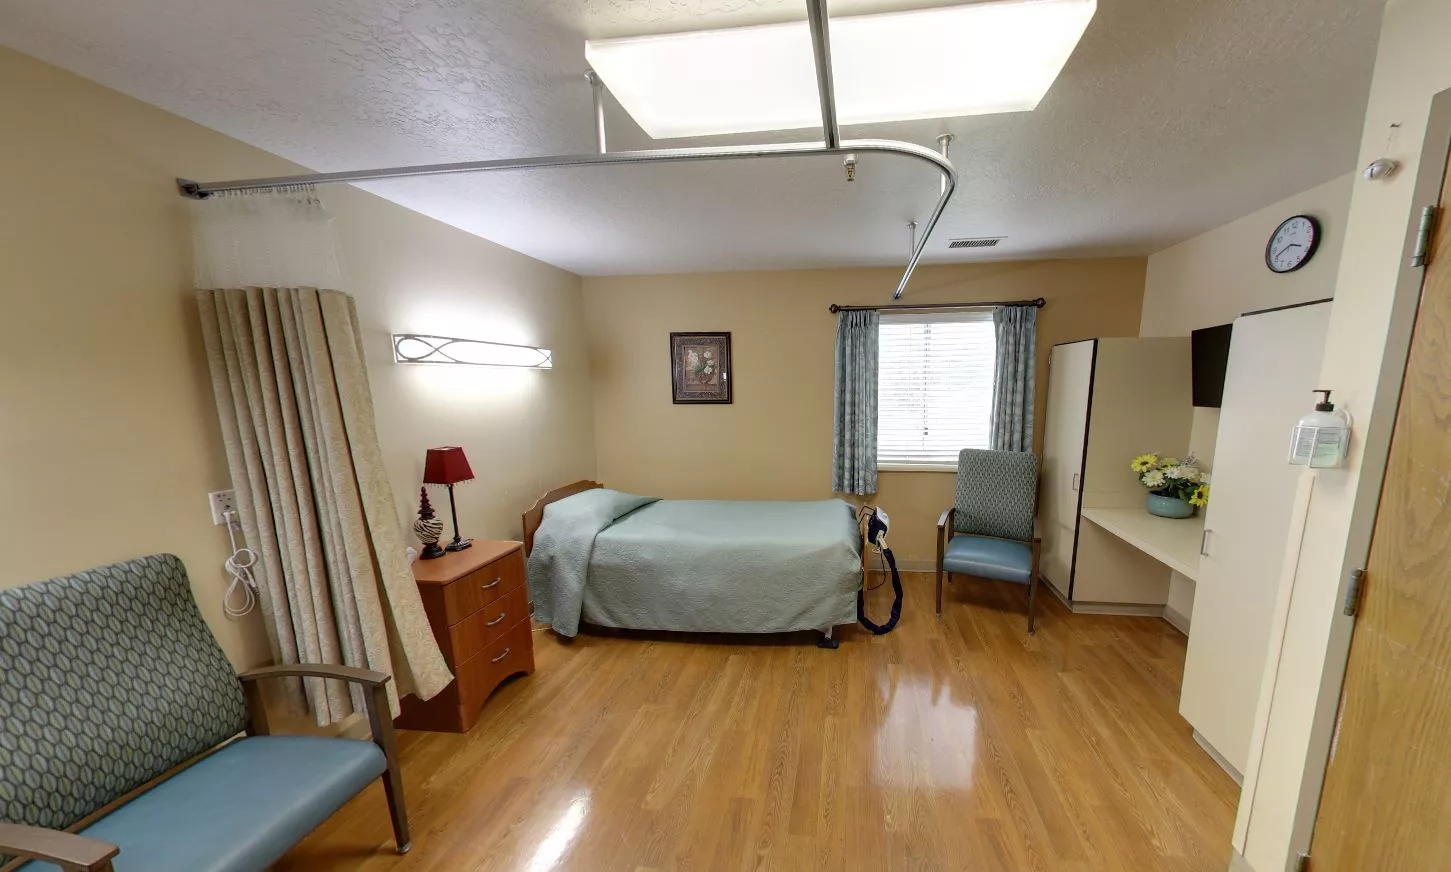
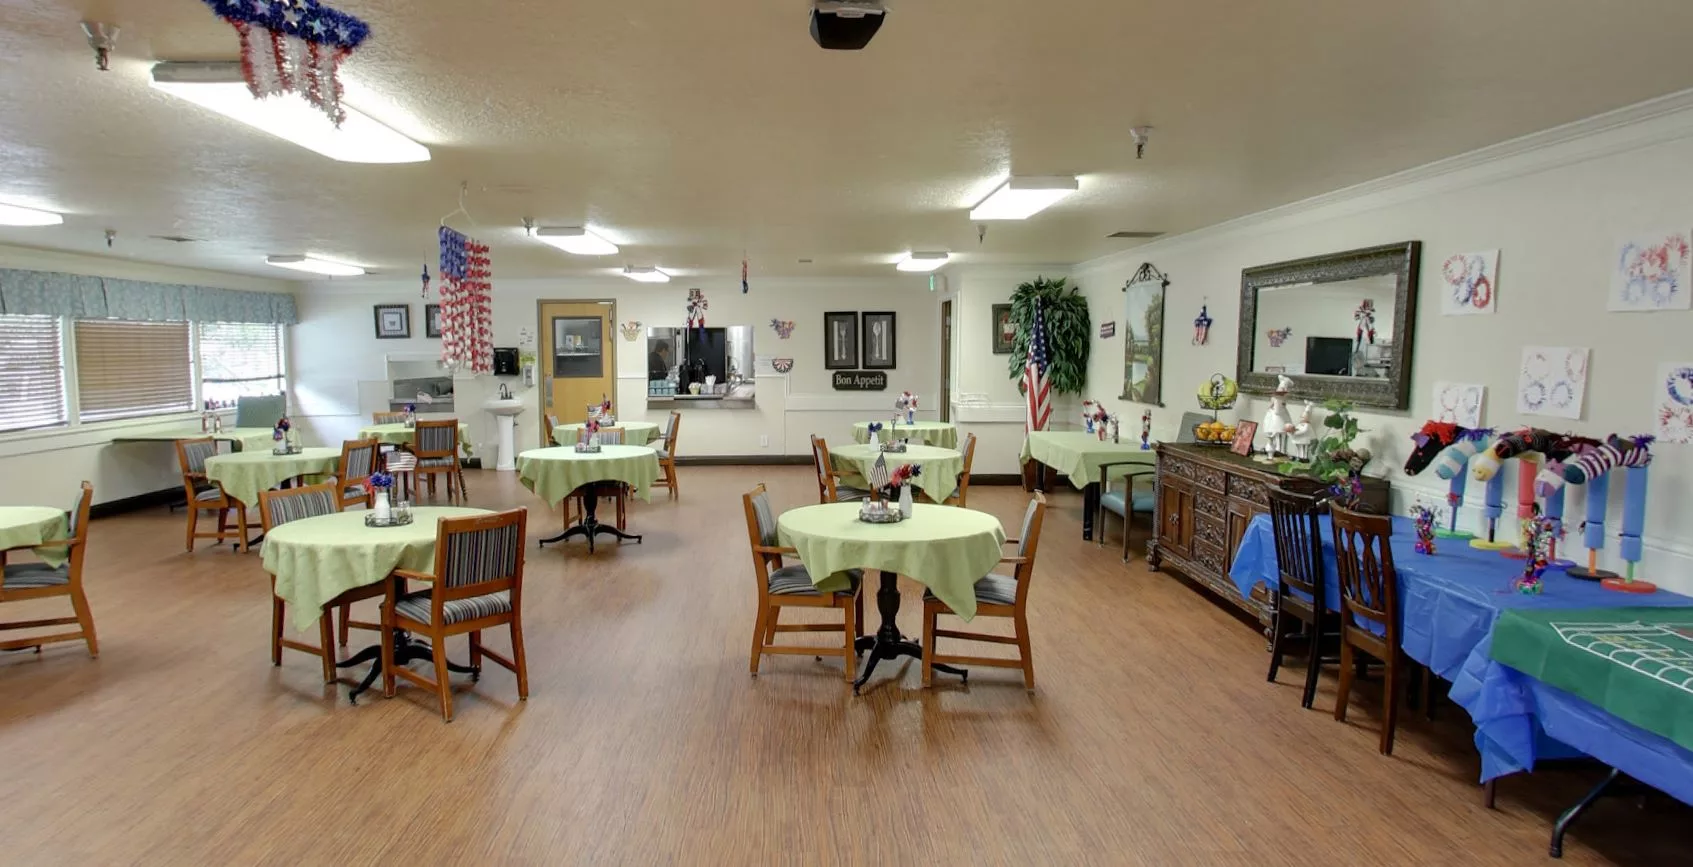
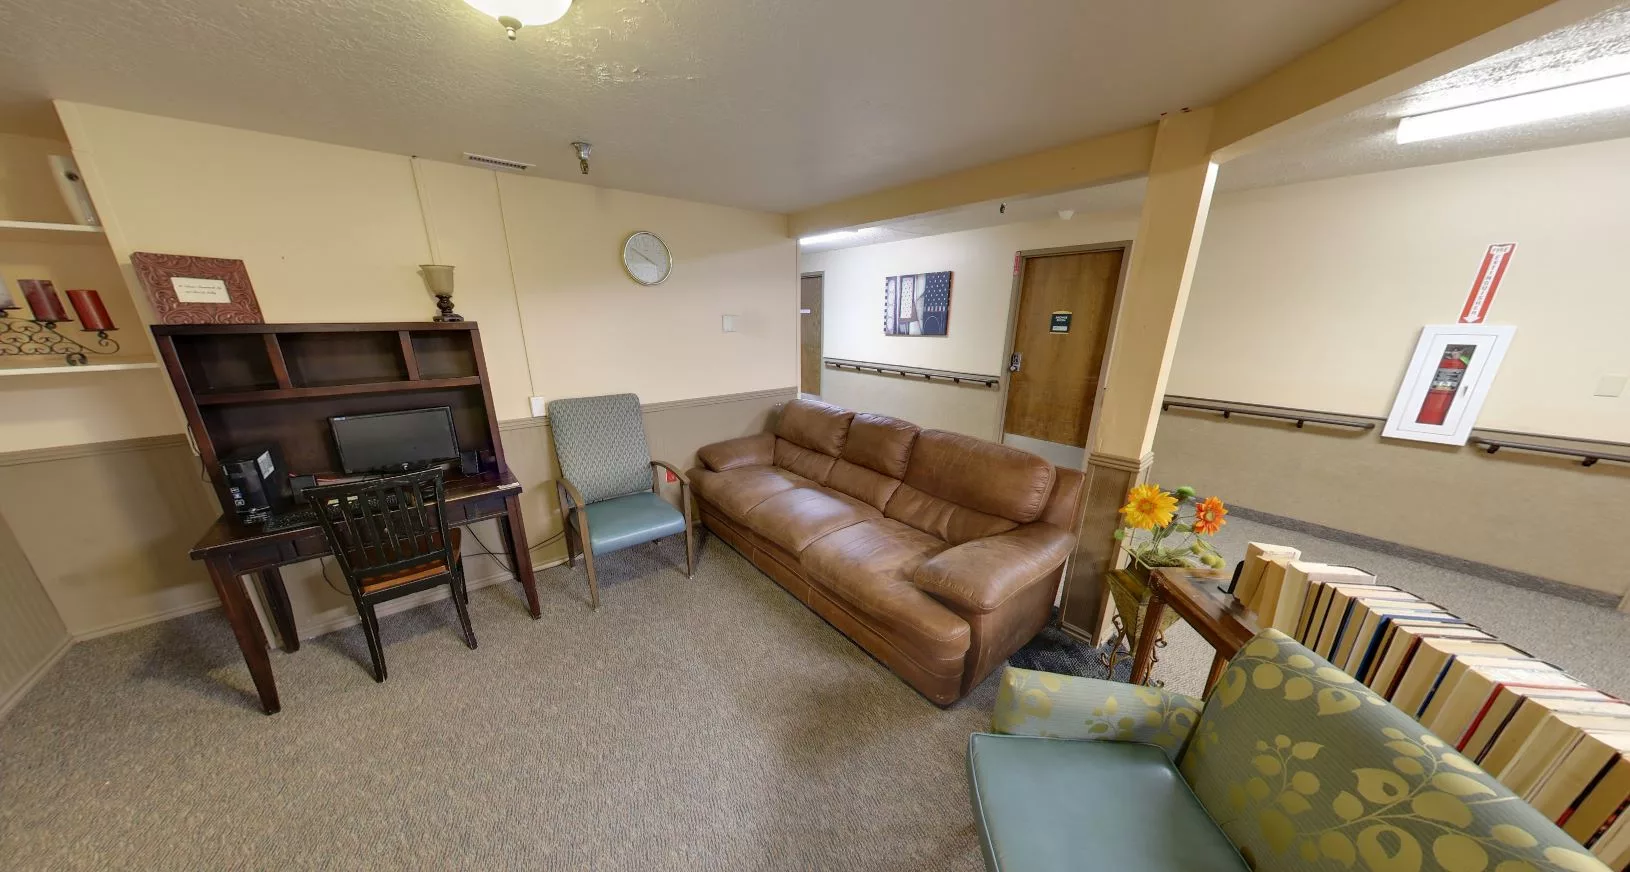
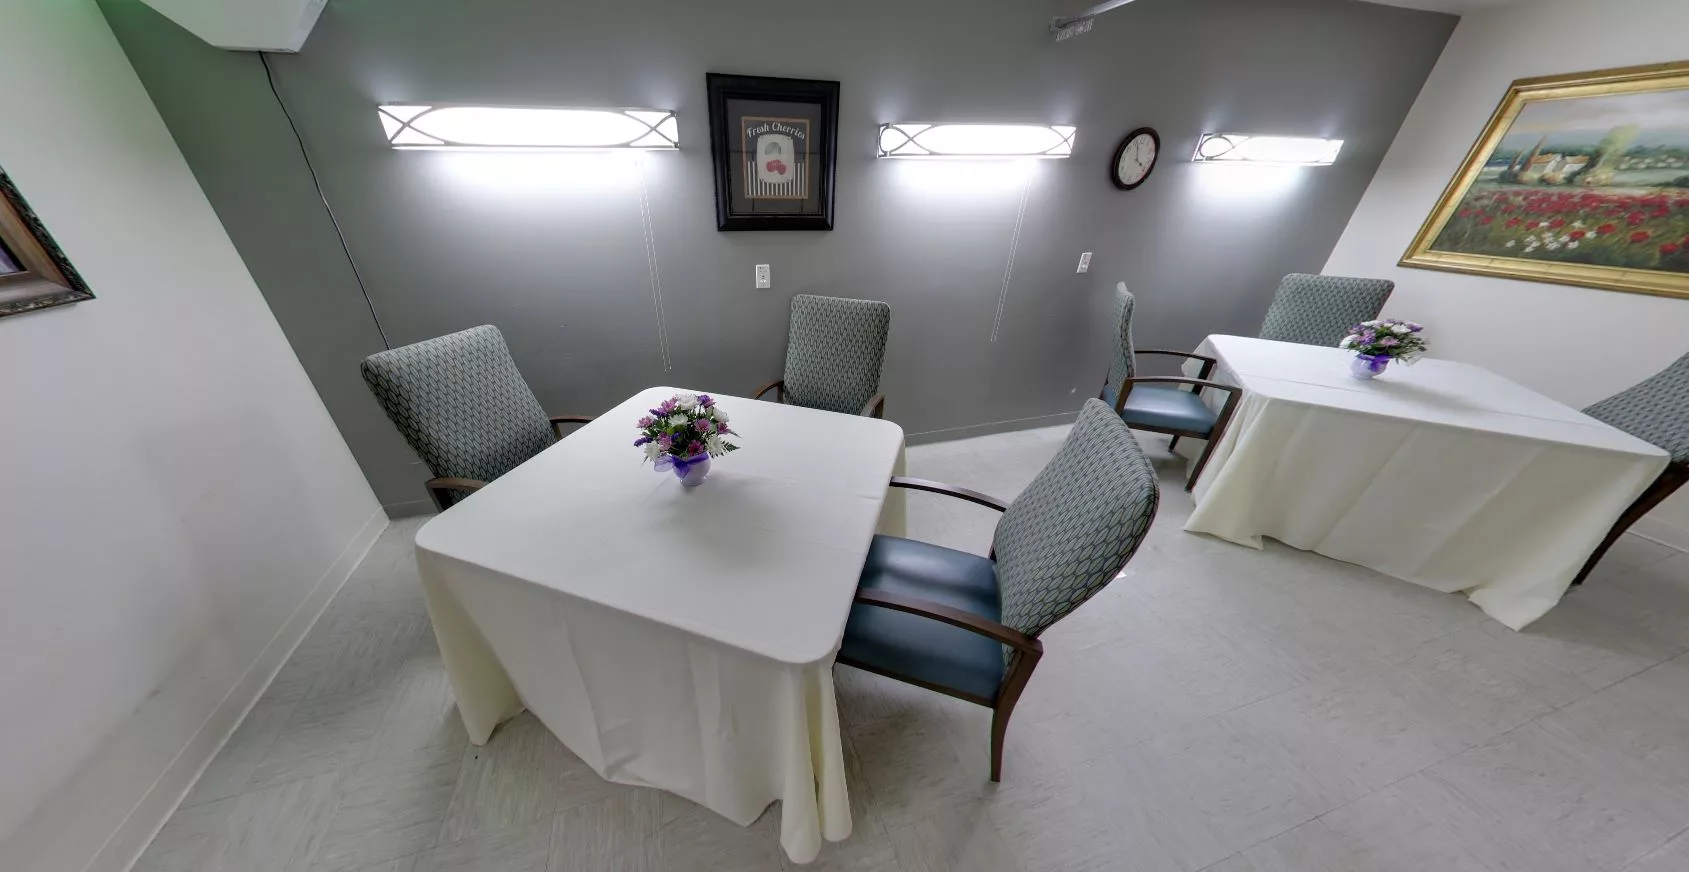
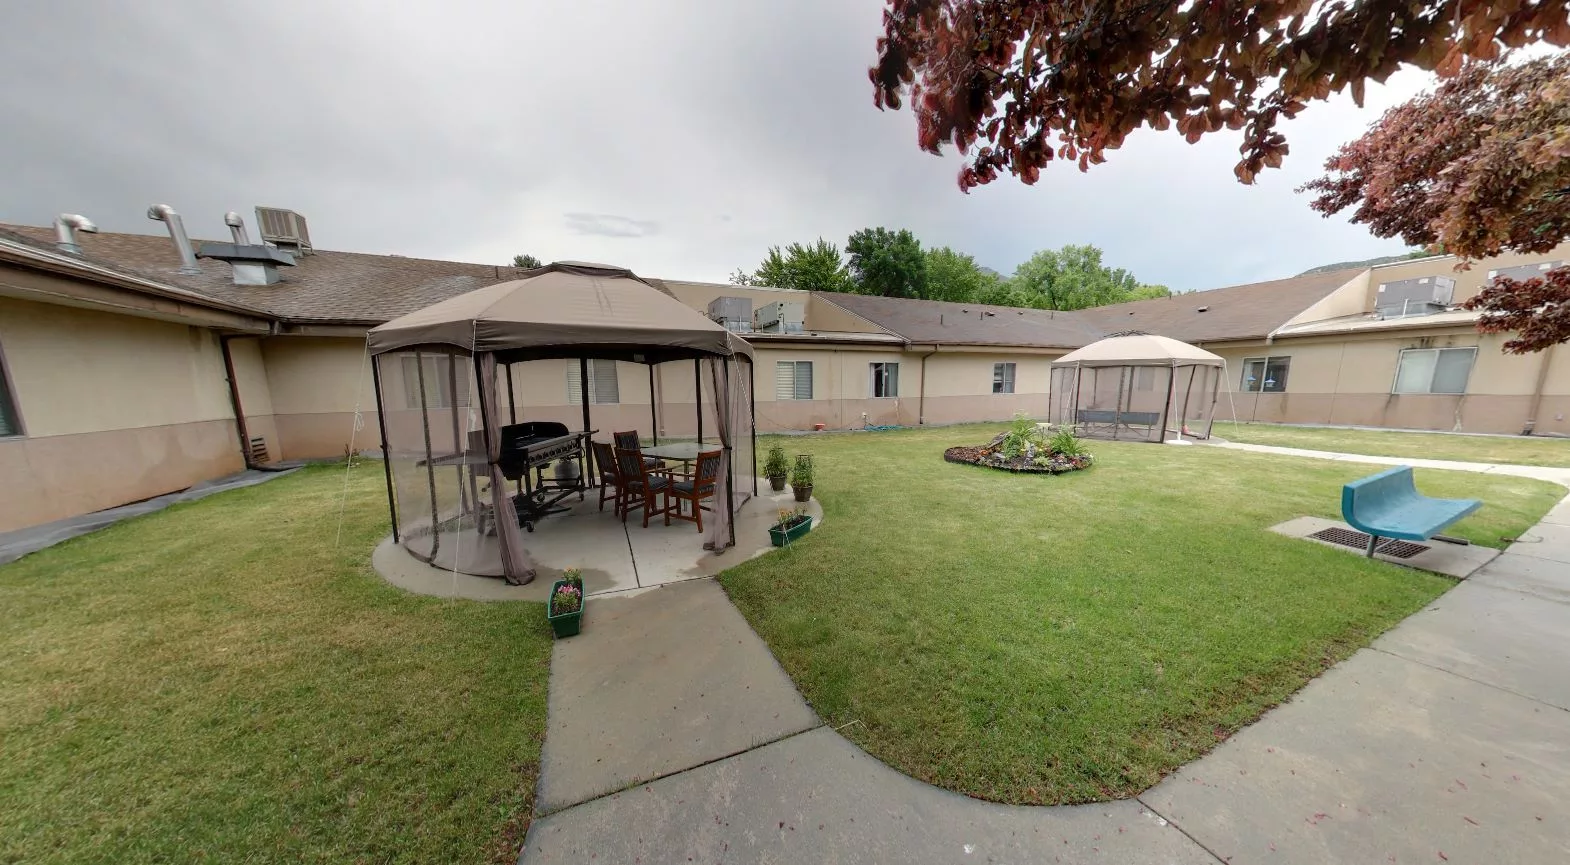
Situated in the serene city of Nephi, Utah, Sandstone Nephi emerges as a comprehensive senior community offering expert short-term rehabilitation, skilled nursing, assisted living, and long-term facilities. Sandstone Nephi stands as a beacon of complete care, dedicated to fostering a thriving community where residents can rediscover joy and pursue their passions in a nurturing environment.
Nestled in the captivating landscape of Nephi, Utah, Sandstone Nephi encapsulates the essence of its picturesque surroundings. As a part of the Sandstone Healthcare Group, with additional locations in Arizona and Nevada, the facility ensures residents receive nothing short of stellar care, striving to facilitate a return to their most beloved activities. Boasting an array of physical, occupational, and speech therapy services, Sandstone Nephi remains steadfast in its commitment to delivering exceptional skilled nursing care and rehabilitation, empowering residents to rediscover their cherished pursuits.

(435) 623-1721

Quality ratings

Measured by Centers for Medicare & Medicaid Services (CMS)

Overall rating Info Official CMS rating based on health inspections, staffing and quality measures.
4/5
Utah average: 3.4/5
Health Inspection Info Official CMS rating based on deficiencies found during state health inspections.
4/5
Utah average: 2.8/5
Staffing Info Official CMS rating based on nurse staffing hours per resident per day.
3/5
Utah average: 3.1/5
Quality Measures Info Official CMS rating based on clinical outcomes for residents.
4/5
Utah average: 4.4/5

Nursing care per resident

Info Average daily nursing hours per resident (adjusted for acuity). Higher values indicate more nursing time per resident.
3h 45m per day

This home provides 1% more nursing time per resident than the Utah average.

Utah average: 3h 43m per day

Capacity and availability

Smaller home

May offer a more intimate, personalized care environment.

Total beds 80

This home usually has availability

Lower occupancy suggests more openings may be available.

Lower demand than the Utah average
Occupancy rate 47.6%
Residents per day (avg) 36
Occupancy rate
47.6%
Residents per day (avg)
36

Who this home usually serves

TYPE OF STAY

Mix of rehab and long-term care

This home supports both short-term rehab and long-term care, with residents staying for a wide range of durations.

Breakdown by payment type

Medicare

33% of new residents, usually for short-term rehab.

Typical stay 24 days

Private pay

40% of new residents, often for short stays.

Typical stay 2 months

Medicaid

27% of new residents, often for long-term daily care.

Typical stay 9 - 10 months

Finances and operations

Privately-owned community
Operated by a business corporation.
Home revenue
$6.1M
Profit
$172.3K
Privately-owned community Operated by a business corporation.
Home revenue
$6,122,178.00
Profit
$172,309.00
Payroll costs Info The portion of the home's budget spent on staff, including nurses, caregivers, and other employees who support care and operations.
$1.7M
27.6% of revenue
Other operating costs Info All remaining costs needed to run the home, such as food, utilities, building maintenance, supplies and administrative expenses.
$4.3M
Total costs $5.9M

Types of Care at Sandstone Nephi

Nursing Home
Contact Sandstone Nephi

Health Inspection History

Inspections
Total health inspections 3

Utah average 3.5


Last Health inspection on May 2025

Total health citations 8
Citations per inspection
2.67

Health citations are formal notices following inspections when they fail to comply with safety and care standards.

All 8 citations resulted from standard inspections.

Breakdown of citation severity (last 3 years)
Critical Health citations More info 0
100% better than Utah average

Utah average: 0.7


Serious Health citations More info 0
100% better than Utah average

Utah average: 2.5

0 critical citations More info Utah average: 0.7

0 serious citations More info Utah average: 2.5

8 moderate citations More info Utah average: 24.5

0 minor citations More info Utah average: 0.1
Citations history (last 3 years)
Quality of Care moderate citation May 29, 2025
Corrected

Care Planning moderate citation May 29, 2025
Corrected

Infection Control moderate citation Jun 05, 2023
Corrected

Nutrition moderate citation Jun 05, 2023
Corrected

Compare Nursing Homes around Juab County

The information below is reported by the Utah Department of Health and Human Services, Health Facility Licensing.
Sandstone Nephi
SNF

Nursing Home 24/7 care needed

AL

Assisted Living For seniors needing help with daily tasks but not full-time nursing.

Nephi
80
22
NEPHI NURSING & REHAB LLC
47.6%
$6,088,739.00
$1,691,691.00
27.8%
36
4/5
3.7483
4/5
3/5
4/5
8
+17%
+1%
-32%

Places of interest near Sandstone Nephi

Address 55.9 miles from city center — 0.74 miles to nearest hospital (James M. Besendorfer, MD)

Address 1100 N 400 E, Nephi, UT 84648

Calculate Travel Distance to Sandstone Nephi

Add your location

Address

Staffing Data

Source: CMS Payroll-Based Journal (Q2 2025)

71
Total Staff
46
Employees
25
Contractors
15,531
Total Hours (Quarter)
22
Avg Staff/Day
7.8
Avg Shift (hrs)
Nursing Staff Breakdown
Role Count Avg Shift (hrs) Uses Contractors?
Registered Nurse148 Yes
Licensed Practical Nurse78.3 Yes
Certified Nursing Assistant318.7 Yes
Staff by Category
Administration
1 staff
8hs shift avg
Nursing Staff
53 staff
8.4hs shift avg
Physicians & Practitioners
2 staff
5.6hs shift avg
Therapy Services
8 staff
5.4hs shift avg
Activities & Recreation
0 staff
0hs shift avg
Social Services
1 staff
3hs shift avg
Dietary Services
5 staff
7.6hs shift avg
Other Services
1 staff
8.3hs shift avg
Contractor Analysis
22.1%
of total hours from contractors
3,433 contractor hours this quarter
Certified Nursing Assistant: 10 Registered Nurse: 5 Licensed Practical Nurse: 1 Respiratory Therapy Technician: 3 Qualified Social Worker: 1 Physical Therapy Aide: 1 Speech Language Pathologist: 1 Physical Therapy Assistant: 3
Role Employees Contractors Total Staff Total Hours Days Worked % of Days Avg Shift (hrs)
Certified Nursing Assistant2110317,12691100%8.7
Registered Nurse95142,93091100%8
Licensed Practical Nurse6171,6718796%8.3
Other Dietary Services Staff5059168695%7.6
Dental Services Staff1015296470%8.3
Administrator1015126470%8
Physical Therapy Aide0115026369%8
Nurse Practitioner1014966268%8
Speech Language Pathologist0114146571%6.4
Clinical Nurse Specialist1012056470%3.2
Nurse Aide in Training101661011%6.6
Physical Therapy Assistant033573437%1.6
Qualified Social Worker011571921%3
Respiratory Therapy Technician033492629%1.9

Facility Characteristics

Source: CMS Long-Term Care Facility Characteristics (Data as of Jan 2026)

Total census
35 residents
Residents by payment source
Medicare
6 residents (17.1%)
Medicaid
25 residents (71.4%)
Private pay or other
4 residents (11.4%)
Programs & Services
Residents' Group

Residents meet regularly to discuss policies, care quality, and activities

Active Resident Council

Organized group of residents that meets regularly to discuss facility policies, quality of life, and activities.

Quality of care over time

These measures show how residents usually do over time at this home, based on health outcomes and preventive care.

High-risk clinical events score Info A composite score based on pressure ulcers, falls with injury, weight loss, walking ability decline, and activities of daily living decline. 5.3
43% better than Utah average

Utah average: 9.3

Functional decline score Info A composite score based on activities of daily living decline, walking ability decline, and incontinence. 7.3
63% better than Utah average

Utah average: 20.1

Long-stay resident measures
Need for Help with Daily Activities Increased Info Percent of long-stay residents whose need for help with daily activities has increased 5.5%
65% better than Utah average

Utah average: 15.7%

Walking Ability Worsened Info Percent of long-stay residents whose ability to move independently worsened 4.4%
79% better than Utah average

Utah average: 21.3%

Low Risk Residents with Bowel/Bladder Incontinence Info Percent of low risk long-stay residents who lose control of their bowels or bladder 12.2%
47% better than Utah average

Utah average: 23.1%

Falls with Major Injury Info Percent of long-stay residents experiencing one or more falls with major injury 1.5%
44% better than Utah average

Utah average: 2.6%

High Risk Residents with Pressure Ulcers Info Percent of long-stay high risk residents with pressure ulcers 12.1%
188% worse than Utah average

Utah average: 4.2%

Urinary Tract Infection Info Percent of long-stay residents with a urinary tract infection 0.7%
64% better than Utah average

Utah average: 2.1%

Lost Too Much Weight Info Percent of long-stay residents who lose too much weight 3.0%
27% better than Utah average

Utah average: 4.1%

Depressive Symptoms Info Percent of long-stay residents who have depressive symptoms 24.2%
47% worse than Utah average

Utah average: 16.5%

Antipsychotic Use Info Percent of long-stay residents who received an antipsychotic medication 11.9%
12% better than Utah average

Utah average: 13.5%

Pneumococcal Vaccine Info Percent of long-stay residents assessed and appropriately given the pneumococcal vaccine 100.0%
In line with Utah average

Utah average: 97.1%

Influenza Vaccine Info Percent of long-stay residents assessed and appropriately given the seasonal influenza vaccine 94.4%
In line with Utah average

Utah average: 98.0%

Short-stay resident measures
Pneumococcal Vaccine Info Percent of short-stay residents assessed and appropriately given the pneumococcal vaccine 98.1%
5% better than Utah average

Utah average: 92.9%

Antipsychotic medication increase Info Percent of short-stay residents who newly received an antipsychotic medication 0.0%
100% better than Utah average

Utah average: 1.1%

Influenza Vaccine Info Percent of short-stay residents assessed and appropriately given the seasonal influenza vaccine 95.1%
5% better than Utah average

Utah average: 91.0%

Guides for Better Senior Living

Care Cost Calculator: See Prices in Your Area

Nursing Home Data Explorer

Don’t Wait Too Long: 7 Red Flag Signs Your Parent Needs Assisted Living Now

The True Cost of Assisted Living in 2025 – And How Families Are Paying For It

Understanding Senior Living Costs: Pricing Models, Discounts & Financial Assistance

Financial Aid for Utah Seniors

Get financial aid guidance

Aging Waiver

UT Medicaid Aging Waiver

Age 65+, Utah resident, Medicaid-eligible, nursing home-level care need.

~$2,829/month (300% FBR, individual).

$2,000 (individual), $3,000 (couple).

Rural challenges; waitlists possible.

Utah Alternatives Program

UT Alternatives

Age 60+, Utah resident, at risk of nursing home.

~$2,000/month (individual, varies).

$5,000 (individual).

Limited funding; rural focus.

Older Americans Act (OAA) Services

Utah OAA Services

Age 60+, UT resident; no income/asset limits.

None; donations encouraged.

Not assessed.

12 AAAs; includes Meals on Wheels; rural emphasis.

Medicare Savings Program (MSP)

Utah Medicare Savings Program

Age 65+ or disabled, UT resident, Medicare Part A/B.

~$2,510/month (QMB), ~$3,380/month (SLMB), ~$3,598/month (QI)—individual.

$9,430 (individual), $14,130 (couple).

Includes Extra Help for Part D; no waitlist.

Home Energy Assistance Target (HEAT) Program

Utah HEAT Program

Age 60+ prioritized, UT resident, low-income household.

~$3,970/month (185% FPL).

Not assessed.

Covers gas, electric, propane; emergency aid available.

Utah Caregiver Support Program

Utah Family Caregiver Support Program (FCSP)

Caregivers of 60+ needing care or 55+ caregivers of others; UT resident; 2+ ADLs.

No strict cap; prioritizes low-income (~$24,980/year).

Not assessed.

Includes grandparent caregivers; serves ~1,500 annually.

Senior Community Service Employment Program (SCSEP)

Utah SCSEP

Age 55+, unemployed, low-income, UT resident.

~$1,983/month (125% FPL).

Not specified.

Priority for veterans, rural residents; AARP partnership.

VA Aid and Attendance (A&A) and Housebound Benefits

Utah VA Aid and Attendance/Housebound

Age 65+ or disabled veteran/spouse, UT resident, wartime service, ADL help (A&A) or homebound.

Net income < ~$1,984/month (veteran with dependent, A&A); pension offsets income.

~$155,356 (net worth).

Supports rural veterans; high demand near VA centers.

Property Tax Abatement and Deferral Programs

Utah Circuit Breaker and Deferral Programs

Age 66+ (abatement) or 75+ (deferral), UT resident 10+ months/year, homeowner.

~$40,000/year (household, abatement); no limit for deferral.

Not assessed; home value < ~$500,000 typical.

Abatement up to $1,200; deferral accrues interest (2.5%-5%).

Senior Farmers’ Market Nutrition Program (SFMNP)

Utah SFMNP

Age 60+, UT resident, low-income.

~$2,322/month (185% FPL).

Not assessed.

Vouchers (~$50/season); serves ~5,000 via 12 AAAs.

Tour Icon
Planning a tour? Check our touring checklist.
Chat Icon
Thinking of living here? We can help you speak to a current resident