Explore Open Rooms
1 Contact details
2 What type of senior care service are you looking for?
3 What budget do you have in mind for senior care?
4 How soon do you need to find care?
5 Additional details

Thank you for your interest!

Our team will be in touch shortly to help with next steps.

Nursing Home in Juab County

CMS overall rating Info The Overall CMS Rating combines results from health inspections, staffing levels and quality measures. Health inspections carry the most weight. Staffing and quality scores can increase or decrease the final rating based on performance compared to state and national standards.
Sandstone Nephi

Nursing Home in Juab County

CMS overall rating Info The Overall CMS Rating combines results from health inspections, staffing levels and quality measures. Health inspections carry the most weight. Staffing and quality scores can increase or decrease the final rating based on performance compared to state and national standards.

Sandstone Nephi

Overview of Sandstone Nephi

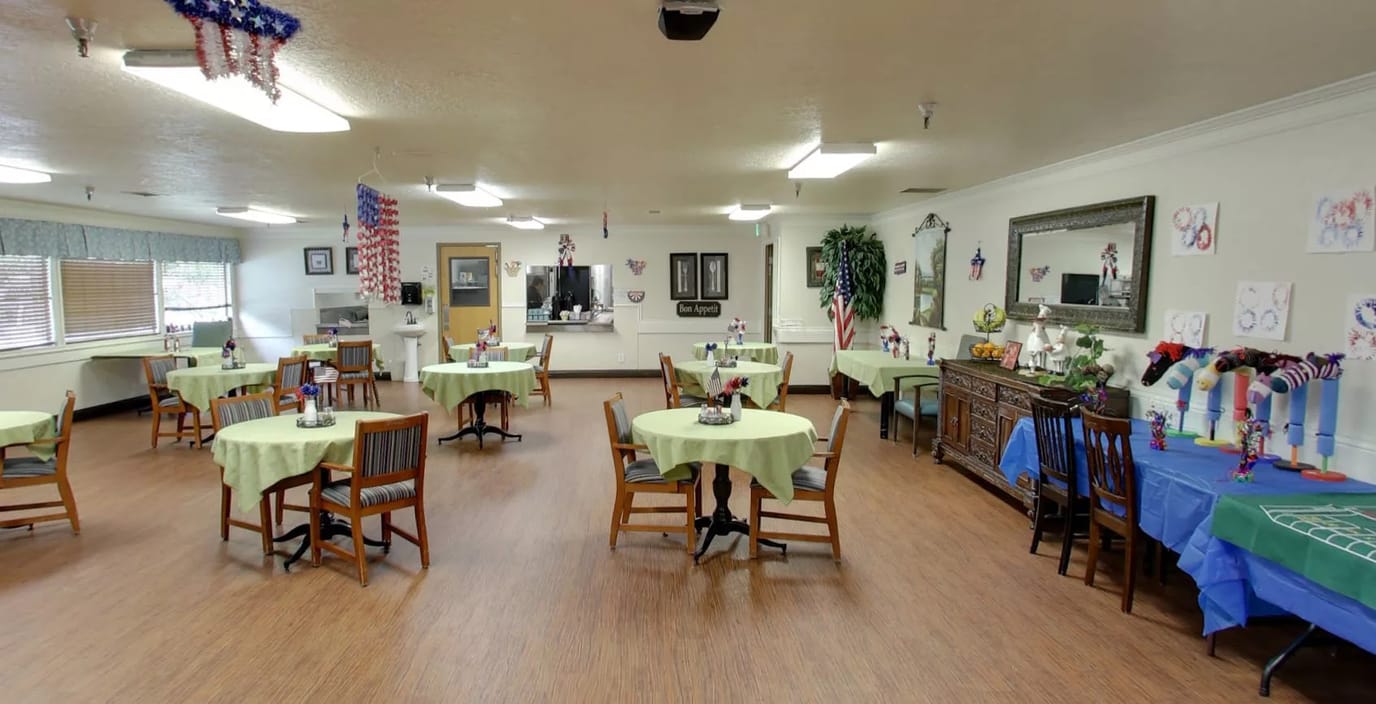
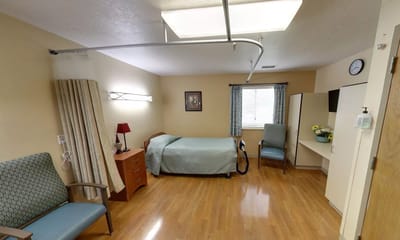
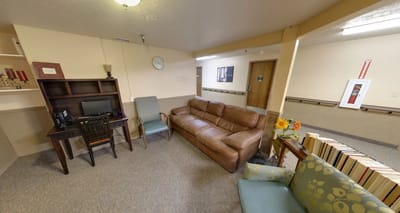
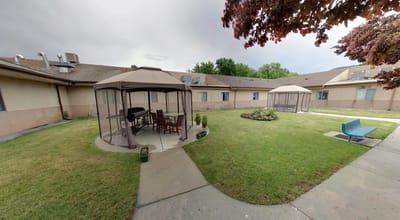
Situated in the serene city of Nephi, Utah, Sandstone Nephi emerges as a comprehensive senior community offering expert short-term rehabilitation, skilled nursing, assisted living, and long-term facilities. Sandstone Nephi stands as a beacon of complete care, dedicated to fostering a thriving community where residents can rediscover joy and pursue their passions in a nurturing environment.
Nestled in the captivating landscape of Nephi, Utah, Sandstone Nephi encapsulates the essence of its picturesque surroundings. As a part of the Sandstone Healthcare Group, with additional locations in Arizona and Nevada, the facility ensures residents receive nothing short of stellar care, striving to facilitate a return to their most beloved activities. Boasting an array of physical, occupational, and speech therapy services, Sandstone Nephi remains steadfast in its commitment to delivering exceptional skilled nursing care and rehabilitation, empowering residents to rediscover their cherished pursuits.

(435) 623-1721

Quality ratings

Measured by Centers for Medicare & Medicaid Services (CMS)

Overall rating Info The Overall CMS Rating combines results from health inspections, staffing levels and quality measures. Health inspections carry the most weight. Staffing and quality scores can increase or decrease the final rating based on performance compared to state and national standards.
4/5
Utah average: 3.4/5
Health Inspection Info Based on the results of the facility's three most recent standard inspections and any complaint investigations. CMS reviews the number, scope, and severity of deficiencies, with more recent findings weighted more heavily.
4/5
Utah average: 2.8/5
Staffing Info Measures average nursing staff hours per resident per day, including Registered Nurses (RNs) and total nursing staff. Ratings are adjusted based on the level of care residents require and are compared to state and national benchmarks.
3/5
Utah average: 3.1/5
Quality Measures Info Based on clinical and physical health indicators reported to CMS, such as hospital readmissions, falls, pressure ulcers, and improvements in mobility. These measures reflect how well residents' health needs are being managed.
4/5
Utah average: 4.4/5

Nursing care per resident

Info This shows how many total hours of nursing staff time are available per resident each day. Higher numbers usually mean more staff support.
3h 45m per day

This home provides 1% more nursing time per resident than the Utah average.

Utah average: 3h 43m per day

Capacity and availability

Smaller home

May offer a more intimate, personalized care environment.

Total beds 80

This home usually has availability

Lower occupancy suggests more openings may be available.

Lower demand than the Utah average: 70.1%
Occupancy rate 47.6%
Residents per day (avg) 36
Occupancy rate
47.6%
Residents per day (avg)
36

Who this home usually serves

TYPE OF STAY

Mix of rehab and long-term care

This home supports both short-term rehab and long-term care, with residents staying for a wide range of durations.

Breakdown by payment type

Medicare

33% of new residents, usually for short-term rehab.

Typical stay 24 days

Private pay

40% of new residents, often for short stays.

Typical stay 2 months

Medicaid

27% of new residents, often for long-term daily care.

Typical stay 9 - 10 months

Finances and operations

Privately-owned community
Operated by a business corporation.
Home revenue
$6.1M
Profit
$172.3K
Privately-owned community Operated by a business corporation.
Home revenue
$6.1M
Profit
$172.3K
Payroll costs Info The portion of the home's budget spent on staff, including nurses, caregivers, and other employees who support care and operations.
$1.7M
27.6% of revenue
Other operating costs Info All remaining costs needed to run the home, such as food, utilities, building maintenance, supplies and administrative expenses.
$4.3M
Total costs $5.9M

Types of Care at Sandstone Nephi

Nursing Home

Contact Sandstone Nephi

Health Inspection History

Inspections
Total health inspections 3

Utah average 3.5


Last Health inspection on May 2025

Total health citations 8

Utah average 27.7

Citations per inspection
2.67

Utah average 7.62


Health citations are formal notices following inspections when they fail to comply with safety and care standards.

All 8 citations resulted from standard inspections.

Breakdown of citation severity (last 3 years)
Critical Health citations More info 0
100% better than Utah average

Utah average: 0.7


Serious Health citations More info 0
100% better than Utah average

Utah average: 2.5

0 critical citations More info Utah average: 0.7

0 serious citations More info Utah average: 2.5

8 moderate citations More info Utah average: 24.5

0 minor citations More info Utah average: 0.1
Citations history (last 3 years)
Quality of Care moderate citation Info Issues related to how well residents receive appropriate treatment and support for their medical and daily care needs. May 29, 2025
Corrected

Care Planning moderate citation Info Issues related to creating and updating personalized care plans for residents based on their needs and conditions. May 29, 2025
Corrected

Infection Control moderate citation Info Issues related to preventing and controlling infections, including hygiene practices and safety protocols. Jun 05, 2023
Corrected

Nutrition moderate citation Info Issues related to food quality, meal service, and resident's nutritional needs. Jun 05, 2023
Corrected

Compare Nursing Homes around Juab County The information below is reported by the Utah Department of Health and Human Services, Health Facility Licensing.

1 facility compared · CMS & UT Dept. of Health data · Updated Apr 2026

Filter by care type
Sandstone Nephi
NH

Nursing Home Licensed facility providing 24/7 skilled nursing care for residents with complex, ongoing medical needs. Staffed by RNs, LPNs, and CNAs. Inspected and star-rated annually by CMS. Accepts Medicare (short-term rehab) and Medicaid (long-term care).

AL

Assisted Living A licensed, long-term care setting for seniors or individuals with disabilities who need help with daily activities — like bathing, dressing, and medication management — but not 24-hour skilled nursing. Offers housing, meals, and around-the-clock support while aiming to maximize resident independence.

Nephi (Nephi)80 47.6% -32%3.75 +17%+1%082.7036- 22 Nephi Nursing & Rehab Llc$6.1M$1.7M27.8%465107

Places of interest near Sandstone Nephi

Address 55.9 miles from city center Info Estimated distance in miles from Nephi's city center to Sandstone Nephi's address, calculated via Google Maps. — 0.74 miles to nearest hospital (James M. Besendorfer, MD)

Calculate Travel Distance to Sandstone Nephi

Add your location

Address

Staffing Data (Q2 2025)

This data corresponds to Q2 2025 and is based on CMS Payroll-Based Journal.

Total staff 71
Employees 46
Contractors 25
Staff to resident ratio 2.03:1
0% compared with Utah average

Utah average ratio: 2.12:1

Avg staff/day 22
Average shift 7.8 hours
0% compared with Utah average

Utah average: 7.9 hours

Total staff hours (quarter) 15,531
Nursing staff breakdown
Registered Nurse

Manages medical care and health needs.

Total count 14
Average shift length Info Average shift length. Calculated as total hours divided by days worked and average staff per day. 8 hours

This role is partially covered by contractors.

Licensed Practical Nurse

Assists with medical care and medications.

Total count 7
Average shift length Info Average shift length. Calculated as total hours divided by days worked and average staff per day. 8.3 hours

This role is partially covered by contractors.

Certified Nursing Assistant

Helps with daily care and mobility.

Total count 31
Average shift length Info Average shift length. Calculated as total hours divided by days worked and average staff per day. 8.7 hours

This role is partially covered by contractors.

Contractor staffing

Total hours from contractors

22.1%

3,433 contractor hours this quarter

Certified Nursing Assistant: 10 Registered Nurse: 5 Respiratory Therapy Technician: 3 Physical Therapy Assistant: 3 Licensed Practical Nurse: 1 Qualified Social Worker: 1 Physical Therapy Aide: 1 Speech Language Pathologist: 1
Staff by category
Certified Nursing Assistant2110317,12691100%8.7
Registered Nurse95142,93091100%8
Licensed Practical Nurse6171,6718796%8.3
Other Dietary Services Staff5059168695%7.6
Dental Services Staff1015296470%8.3
Administrator1015126470%8
Physical Therapy Aide0115026369%8
Nurse Practitioner1014966268%8
Speech Language Pathologist0114146571%6.4
Clinical Nurse Specialist1012056470%3.2
Nurse Aide in Training101661011%6.6
Physical Therapy Assistant033573437%1.6
Qualified Social Worker011571921%3
Respiratory Therapy Technician033492629%1.9
31 Certified Nursing Assistant
% of Days 100%
14 Registered Nurse
% of Days 100%
7 Licensed Practical Nurse
% of Days 96%
5 Other Dietary Services Staff
% of Days 95%
1 Dental Services Staff
% of Days 70%
1 Administrator
% of Days 70%
1 Physical Therapy Aide
% of Days 69%
1 Nurse Practitioner
% of Days 68%
1 Speech Language Pathologist
% of Days 71%
1 Clinical Nurse Specialist
% of Days 70%
1 Nurse Aide in Training
% of Days 11%
3 Physical Therapy Assistant
% of Days 37%
1 Qualified Social Worker
% of Days 21%
3 Respiratory Therapy Technician
% of Days 29%

Facility Characteristics

Source: CMS Long-Term Care Facility Characteristics (Data as of Jan 2026)

Total residents 35
Medicare
6
17.1% of residents
Medicaid
25
71.4% of residents
Private pay or other
4
11.4% of residents
Programs & Services
Residents Group

Residents meet regularly to discuss policies, care quality, and activities

Active Resident Council

Organized group of residents that meets regularly to discuss facility policies, quality of life, and activities.

Quality of care over time

These measures show how residents usually do over time at this home, based on health outcomes and preventive care.

High-risk clinical events score Info A composite score based on pressure ulcers, falls with injury, weight loss, walking ability decline, and activities of daily living decline. 5.3
43% better than Utah average

Utah average: 9.3

Functional decline score Info A composite score based on activities of daily living decline, walking ability decline, and incontinence. 7.3
63% better than Utah average

Utah average: 20.1

Long-stay resident measures
Need for Help with Daily Activities Increased Info Percent of long-stay residents whose need for help with daily activities has increased 5.5%
65% better than Utah average

Utah average: 15.7%

Walking Ability Worsened Info Percent of long-stay residents whose ability to move independently worsened 4.4%
79% better than Utah average

Utah average: 21.3%

Low Risk Residents with Bowel/Bladder Incontinence Info Percent of low risk long-stay residents who lose control of their bowels or bladder 12.2%
47% better than Utah average

Utah average: 23.1%

Falls with Major Injury Info Percent of long-stay residents experiencing one or more falls with major injury 1.5%
44% better than Utah average

Utah average: 2.6%

High Risk Residents with Pressure Ulcers Info Percent of long-stay high risk residents with pressure ulcers 12.1%
188% worse than Utah average

Utah average: 4.2%

Urinary Tract Infection Info Percent of long-stay residents with a urinary tract infection 0.7%
64% better than Utah average

Utah average: 2.1%

Lost Too Much Weight Info Percent of long-stay residents who lose too much weight 3.0%
27% better than Utah average

Utah average: 4.1%

Depressive Symptoms Info Percent of long-stay residents who have depressive symptoms 24.2%
47% worse than Utah average

Utah average: 16.5%

Antipsychotic Use Info Percent of long-stay residents who received an antipsychotic medication 11.9%
12% better than Utah average

Utah average: 13.5%

Pneumococcal Vaccine Info Percent of long-stay residents assessed and appropriately given the pneumococcal vaccine 100.0%
In line with Utah average

Utah average: 97.1%

Influenza Vaccine Info Percent of long-stay residents assessed and appropriately given the seasonal influenza vaccine 94.4%
In line with Utah average

Utah average: 98.0%

Short-stay resident measures
Pneumococcal Vaccine Info Percent of short-stay residents assessed and appropriately given the pneumococcal vaccine 98.1%
5% better than Utah average

Utah average: 92.9%

Antipsychotic medication increase Info Percent of short-stay residents who newly received an antipsychotic medication 0.0%
100% better than Utah average

Utah average: 1.1%

Influenza Vaccine Info Percent of short-stay residents assessed and appropriately given the seasonal influenza vaccine 95.1%
5% better than Utah average

Utah average: 91.0%

Guides for Better Senior Living

Care Cost Calculator: See Prices in Your Area

Nursing Home Data Explorer

Don’t Wait Too Long: 7 Red Flag Signs Your Parent Needs Assisted Living Now

The True Cost of Assisted Living in 2025 – And How Families Are Paying For It

Understanding Senior Living Costs: Pricing Models, Discounts & Financial Assistance

Financial Aid for Utah Seniors

Get financial aid guidance

Aging Waiver

UT Medicaid Aging Waiver

Age 65+, Utah resident, Medicaid-eligible, nursing home-level care need.

~$2,829/month (300% FBR, individual).

$2,000 (individual), $3,000 (couple).

Rural challenges; waitlists possible.

Utah Alternatives Program

UT Alternatives

Age 60+, Utah resident, at risk of nursing home.

~$2,000/month (individual, varies).

$5,000 (individual).

Limited funding; rural focus.

Older Americans Act (OAA) Services

Utah OAA Services

Age 60+, UT resident; no income/asset limits.

None; donations encouraged.

Not assessed.

12 AAAs; includes Meals on Wheels; rural emphasis.

Medicare Savings Program (MSP)

Utah Medicare Savings Program

Age 65+ or disabled, UT resident, Medicare Part A/B.

~$2,510/month (QMB), ~$3,380/month (SLMB), ~$3,598/month (QI)—individual.

$9,430 (individual), $14,130 (couple).

Includes Extra Help for Part D; no waitlist.

Home Energy Assistance Target (HEAT) Program

Utah HEAT Program

Age 60+ prioritized, UT resident, low-income household.

~$3,970/month (185% FPL).

Not assessed.

Covers gas, electric, propane; emergency aid available.

Utah Caregiver Support Program

Utah Family Caregiver Support Program (FCSP)

Caregivers of 60+ needing care or 55+ caregivers of others; UT resident; 2+ ADLs.

No strict cap; prioritizes low-income (~$24,980/year).

Not assessed.

Includes grandparent caregivers; serves ~1,500 annually.

Senior Community Service Employment Program (SCSEP)

Utah SCSEP

Age 55+, unemployed, low-income, UT resident.

~$1,983/month (125% FPL).

Not specified.

Priority for veterans, rural residents; AARP partnership.

VA Aid and Attendance (A&A) and Housebound Benefits

Utah VA Aid and Attendance/Housebound

Age 65+ or disabled veteran/spouse, UT resident, wartime service, ADL help (A&A) or homebound.

Net income < ~$1,984/month (veteran with dependent, A&A); pension offsets income.

~$155,356 (net worth).

Supports rural veterans; high demand near VA centers.

Property Tax Abatement and Deferral Programs

Utah Circuit Breaker and Deferral Programs

Age 66+ (abatement) or 75+ (deferral), UT resident 10+ months/year, homeowner.

~$40,000/year (household, abatement); no limit for deferral.

Not assessed; home value < ~$500,000 typical.

Abatement up to $1,200; deferral accrues interest (2.5%-5%).

Senior Farmers’ Market Nutrition Program (SFMNP)

Utah SFMNP

Age 60+, UT resident, low-income.

~$2,322/month (185% FPL).

Not assessed.

Vouchers (~$50/season); serves ~5,000 via 12 AAAs.

Tour Icon
Planning a tour? Check our touring checklist.
Chat Icon
Thinking of living here? We can help you speak to a current resident