Santa Clarita Post Acute
Nursing Home · Valencia, CA
CMS overall rating Info The Overall CMS Rating is scored from 1 to 5 stars and combines results from health inspections, staffing levels, and quality measures. Health inspections carry the most weight. Staffing and quality scores can increase or decrease the final rating based on performance compared to state and national standards.

Santa Clarita Post Acute

Nursing Home · Valencia, CA
CMS overall rating Info The Overall CMS Rating is scored from 1 to 5 stars and combines results from health inspections, staffing levels, and quality measures. Health inspections carry the most weight. Staffing and quality scores can increase or decrease the final rating based on performance compared to state and national standards.
Calculator: See prices in your area
Santa Clarita Post Acute accepts Medicare, Medicaid, and private pay.

Overview of Santa Clarita Post Acute

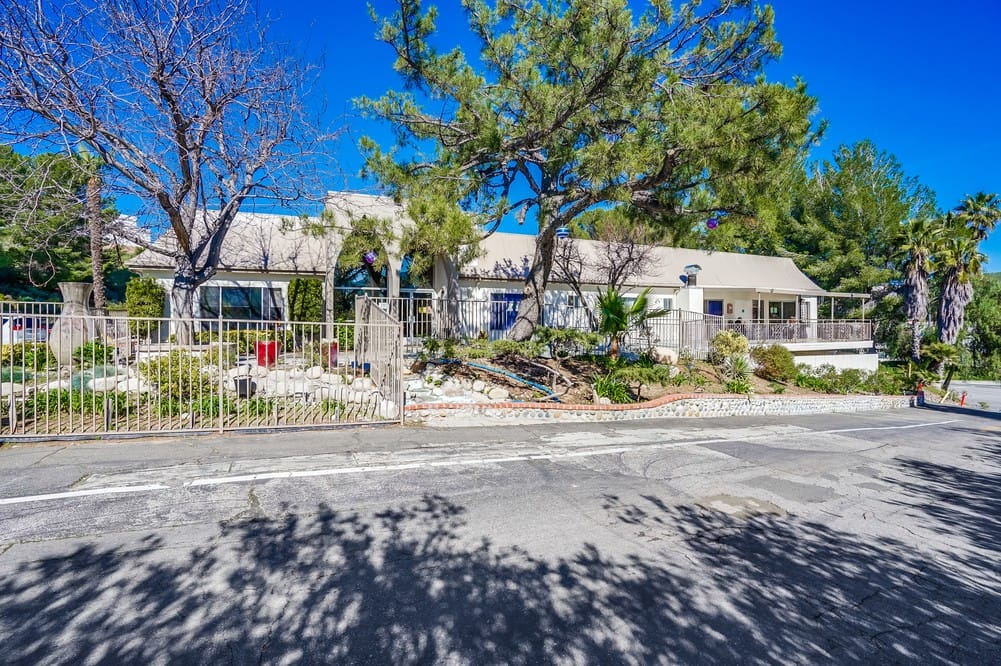
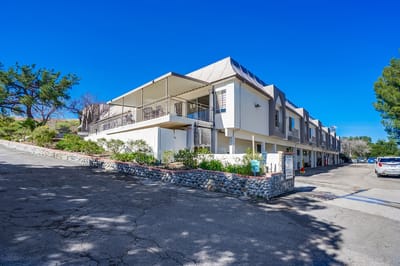
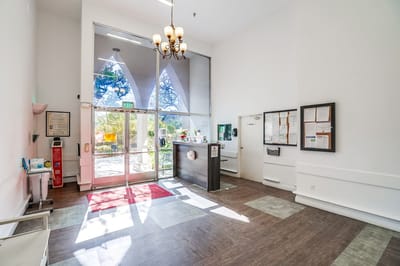
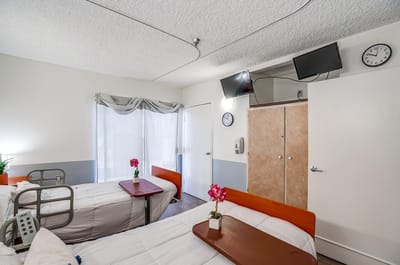
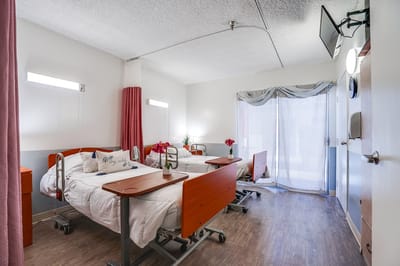
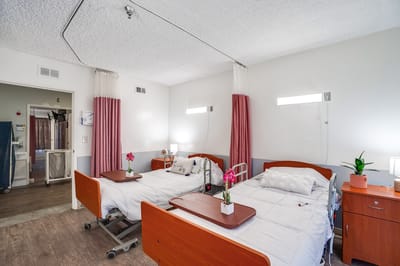
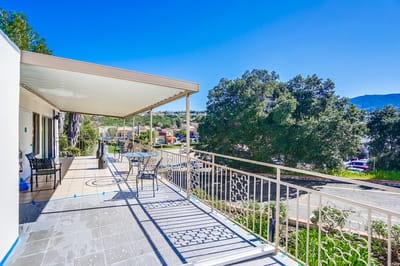
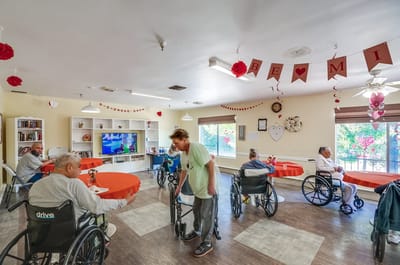
Santa Clarita Post Acute is a nursing home in Newhall, CA, offering rehabilitation and skilled nursing. Promoting a nurturing and welcoming environment, the community ensures older adults experience the utmost comfort and safety. Restaurant-style dining, social services, and therapies are among the excellent services provided to improve residents’ quality of life. The community also works closely with residents to provide the best possible care tailored to their unique needs and preferences.

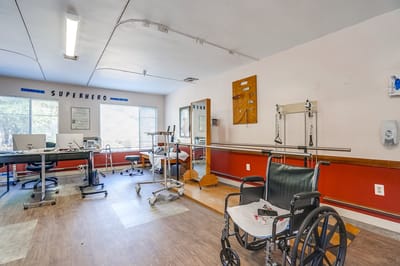
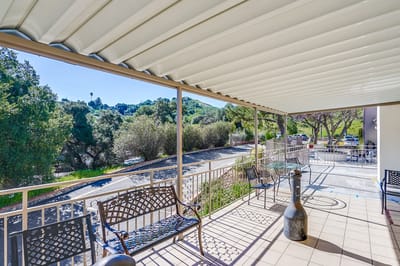
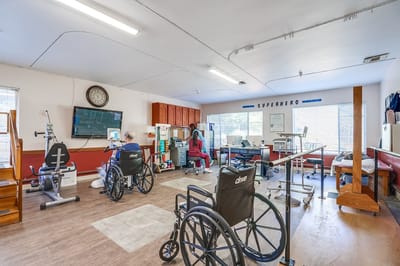
Light exercises, social events, and games are among the many activities that aim to help residents stay active and happy. A beauty and barber shop, cozy common areas, and state-of-the-art rehabilitation equipment also ensure residents can focus on their recovery and rehabilitation. Located near fast-food chains, shops, and bus stops in Newhall, the community guarantees accessibility and convenience. Dedicated to older adults’ welfare, this nursing home is one of the best choices for senior living in California.

Quality ratings

Measured by Centers for Medicare & Medicaid Services (CMS)

Overall rating Info The Overall CMS Rating combines results from health inspections, staffing levels and quality measures. Health inspections carry the most weight. Staffing and quality scores can increase or decrease the final rating based on performance compared to state and national standards.
▼ 68.2% Below CA avg. ▼ 68.2% Below CA avg.Click the badge to see the full State ranking.Click here to see the full State ranking.
Health Inspection Info Based on the results of the facility's three most recent standard inspections and any complaint investigations. CMS reviews the number, scope, and severity of deficiencies, with more recent findings weighted more heavily.
▼ 64.2% Below CA avg. ▼ 64.2% Below CA avg.Click the badge to see the full State ranking.Click here to see the full State ranking.
Staffing Info Measures average nursing staff hours per resident per day, including Registered Nurses (RNs) and total nursing staff. Ratings are adjusted based on the level of care residents require and are compared to state and national benchmarks.
▼ 36.3% Below CA avg. ▼ 36.3% Below CA avg.Click the badge to see the full State ranking.Click here to see the full State ranking.
Quality Measures Info Based on clinical and physical health indicators reported to CMS, such as hospital readmissions, falls, pressure ulcers, and improvements in mobility. These measures reflect how well residents' health needs are being managed.
▼ 26.6% Below CA avg. ▼ 26.6% Below CA avg.Click the badge to see the full State ranking.Click here to see the full State ranking.

Staffing hours breakdown

Info Daily nursing hours per resident by staff type, reported to CMS. Higher is generally better — compare this facility to state and national averages to see where staffing stands.

Hours per resident per day — compared to California state averages

Total nursing care / resident Info This home is ranked 308th out of 346 homes in California. Total adjusted nursing hours per resident per day, combining RN, LPN, and aide time. CMS adjusts this for case-mix so facilities can be fairly compared.
3h 22m per day
Rank #308 / 346Nurse hours — State benchmarkedThis home is ranked 308th out of 346 homes in California. Shows adjusted nurse hours per resident per day benchmarked to the California average, with a ranking across 346 California SNFs. More hours mean more direct care. The national average is about 3.5 hrs; below 3.0 is a red flag.Click the rank badge to see the full State ranking.Click here to see the full State ranking.
This facility California avg (4h 13m per day)
vs California avg
-20%

5 of 6 metrics below state avg

Standout metric Physical Therapist is +200% above state avg
Staff typeHours / Day / Residentvs state avg
Registered Nurse (RN) Info RNs hold the highest nursing license and can assess residents, interpret test results, and direct care plans. More RN hours per day often signals stronger clinical oversight and faster response to health changes. 26m per day ▼ 33% State avg: 39m per day · National avg: 41m per day
LPN / LVN Info Licensed Practical Nurses (LPNs) or Licensed Vocational Nurses (LVNs) deliver routine hands-on care — medication administration, wound dressing, and monitoring vital signs. They work under RN supervision and make up a large share of daily bedside care. 1h 11m per day ▼ 3% State avg: 1h 13m per day · National avg: 52m per day
Nurse Aide Info Certified Nurse Aides (CNAs) provide the most direct day-to-day assistance: bathing, dressing, feeding, and mobility. Nurse aide hours are typically the largest staffing category and directly affect residents' quality of life. 2h 34m per day ▼ 3% State avg: 2h 39m per day · National avg: 2h 21m per day
Total Nursing (Weekend) Info Combined nursing hours (RN + LPN + Nurse Aide) per resident per day on weekends. Staffing often drops on weekends — this figure reveals whether the facility maintains adequate coverage outside of weekday hours. 3h 46m per day ▼ 8% State avg: 4h 5m per day · National avg: 3h 26m per day
Physical Therapist Info Hours per resident per day provided by licensed Physical Therapists (PTs) or PT Assistants. PT services help residents recover mobility after injury or illness and are especially important for post-acute (short-stay) rehabilitation. 15m per day ▲ 200% State avg: 5m per day · National avg: 4m per day
RN (Weekend) Info Registered nurse hours specifically on weekends. Facilities sometimes reduce RN presence on Saturdays and Sundays — a low weekend RN figure compared to weekday hours can indicate reduced clinical oversight when most administrative staff are absent. 19m per day ▼ 37% State avg: 30m per day · National avg: 29m per day

Types of Care at Santa Clarita Post Acute

Nursing Home

Capacity and availability

This home usually has availability

Occupancy lower than 85% suggests more openings may be available.

Lower occupancy than the California average: 84.7%
Occupancy rate 56.6% Rank #318 / 351Occupancy rate — State benchmarkedThis home is ranked 318th out of 351 homes in California. Shows this facility's occupancy rate versus the California average, with its Statewide rank out of 351. Higher occupancy signals strong local demand and financial stability.Click the rank badge to see the full State ranking.Click here to see the full State ranking.
Avg. Length of Stay 769 days
Occupancy rate
56.6% Rank #318 / 351Occupancy rate — State benchmarkedThis home is ranked 318th out of 351 homes in California. Shows this facility's occupancy rate versus the California average, with its Statewide rank out of 351. Higher occupancy signals strong local demand and financial stability.Click the rank badge to see the full State ranking.Click here to see the full State ranking.
Avg. Length of Stay
769 days
Walk Score
Walk Score: 69 / 100 Rank #146 / 359Walk Score — State benchmarkedThis home is ranked 146th out of 359 homes in California. Shows how walkable this facility's neighborhood is compared to the average Walk Score across California SNFs. Higher scores benefit residents, families, and staff.Click the rank badge to see the full State ranking.Click here to see the full State ranking.
Moderately walkable. Some errands can be accomplished on foot, with a mix of nearby amenities.

Contact Santa Clarita Post Acute

Staffing Data

Reporting period: October 1 – December 31, 2025 (Q4 2025). Source: CMS Payroll-Based Journal report.

Total staff 153
Employees 145
Contractors 8
Staff to resident ratio 1.65:1
1645061% better than California average
California average ratio: 0.00:1 California average ratio: 0.00:1See full California ranking
Avg staff/day 70
Average shift 7.3 hours
5% worse than California average
California average: 7.7 hours California average shift: 7.7 hoursSee full California ranking
Total staff hours (quarter) 47,297

Nursing staff breakdown

Q4 2025 · Oct 1 – Dec 31 More info This data comes from the CMS Payroll-Based Journal report covering October 1 – December 31, 2025.
Registered Nurse

Manages medical care and health needs.

Total count 9
Average shift length Info Average shift length. Calculated as total hours divided by days worked and average staff per day. 7.2 hours

No contractors work on this role.

Licensed Practical Nurse

Assists with medical care and medications.

Total count 27
Average shift length Info Average shift length. Calculated as total hours divided by days worked and average staff per day. 7.7 hours

No contractors work on this role.

Certified Nursing Assistant

Helps with daily care and mobility.

Total count 75
Average shift length Info Average shift length. Calculated as total hours divided by days worked and average staff per day. 7.1 hours

No contractors work on this role.

Contractor staffing

Q4 2025 · Oct 1 – Dec 31 More info This data comes from the CMS Payroll-Based Journal report covering October 1 – December 31, 2025.

Total hours from contractors

0.9%

438 contractor hours this quarter

Other Physician: 5 Occupational Therapy Aide: 1 Medical Director: 1 Occupational Therapy Assistant: 1

Staff by category

Q4 2025 · Oct 1 – Dec 31 More info This data comes from the CMS Payroll-Based Journal report covering October 1 – December 31, 2025.
Certified Nursing Assistant7507523,15892100%7.1
Licensed Practical Nurse270278,06892100%7.7
Registered Nurse9093,79092100%7.2
Physical Therapy Aide7072,3608997%7.8
Respiratory Therapy Technician5052,2809199%7.5
RN Director of Nursing3031,5007076%8
Other Dietary Services Staff4041,41092100%7.5
Speech Language Pathologist5051,1007582%6.9
Physical Therapy Assistant4046657784%6.1
Qualified Social Worker1015166470%8.1
Administrator1015126470%8
Dental Services Staff1015006368%7.9
Physical Therapist1014866065%8.1
Nurse Practitioner1014085155%8
Occupational Therapy Aide0112893841%7.6
Dietitian1011071718%6.3
Other Physician0556744%5.2
Occupational Therapy Assistant0114667%7.7
Medical Director0113633%12
75 Certified Nursing Assistant
% of Days 100%
27 Licensed Practical Nurse
% of Days 100%
9 Registered Nurse
% of Days 100%
7 Physical Therapy Aide
% of Days 97%
5 Respiratory Therapy Technician
% of Days 99%
3 RN Director of Nursing
% of Days 76%
4 Other Dietary Services Staff
% of Days 100%
5 Speech Language Pathologist
% of Days 82%
4 Physical Therapy Assistant
% of Days 84%
1 Qualified Social Worker
% of Days 70%
1 Administrator
% of Days 70%
1 Dental Services Staff
% of Days 68%
1 Physical Therapist
% of Days 65%
1 Nurse Practitioner
% of Days 55%
1 Occupational Therapy Aide
% of Days 41%
1 Dietitian
% of Days 18%
5 Other Physician
% of Days 4%
1 Occupational Therapy Assistant
% of Days 7%
1 Medical Director
% of Days 3%

Penalties and fines

Includes penalties issued in 2024

Federal penalties imposed by CMS for regulatory violations, including civil money penalties (fines) and denials of payment for new Medicare/Medicaid admissions.

Source: CMS Penalties Database (Data as of Jan 2026)

Total fines amount $146K Rank #316 / 354Federal fines — State benchmarkedThis home is ranked 316th out of 354 homes in California. Shows this facility's cumulative CMS federal fine dollars versus the California average among facilities with fines, and where it ranks among 354 skilled nursing facilities in the pool. Lower total dollars mean a better rank.Click the rank badge to see the full State ranking.Click here to see the full State ranking.
167% higher than California average

California average: $55K

Number of fines 4
69% more fines than California average

California average: 2.4

Payment Denials Info Serious action where Medicare and/or Medicaid temporarily stops payments for new residents until issues are fixed. 2
304% more payment denials than California average

California average: 0.5

Fines amount comparison
This facility $146K
California average $55K
Penalty History

Penalties are imposed by CMS for violations of federal nursing home regulations.

4 penalties in the past 3 years

Multiple penalties were reported in the last 3 years.

Civil Money Penalty Info Fines imposed for noncompliance, which can be assessed per day or per instance of violation. Jul 2, 2024
$85K
Payment Denial Info Serious action where Medicare and/or Medicaid temporarily stops payments for new residents until issues are fixed. Jul 2, 2024
17 days
Civil Money Penalty Info Fines imposed for noncompliance, which can be assessed per day or per instance of violation. Feb 1, 2024
$17K
Civil Money Penalty Info Fines imposed for noncompliance, which can be assessed per day or per instance of violation. Feb 1, 2024
$17K

Last updated: Jan 2026

Quality of care over time

These measures show how residents usually do over time at this home, based on health outcomes and preventive care.

High-risk clinical events score Info A composite score based on pressure ulcers, falls with injury, weight loss, walking ability decline, and activities of daily living decline. 6.2
7% better than California average

California average: 6.6

Functional decline score Info A composite score based on activities of daily living decline, walking ability decline, and incontinence. 8.8
23% better than California average

California average: 11.3

Long-stay resident measures
Above average Info CMS star rating based on long-stay quality measure performance. 5 stars = significantly above average, 1 star = significantly below average.
Need for Help with Daily Activities Increased Info Percent of long-stay residents whose need for help with daily activities has increased 4.4%
60% better than California average

California average: 11.1%

Walking Ability Worsened Info Percent of long-stay residents whose ability to move independently worsened 7.8%
35% better than California average

California average: 12.0%

Low Risk Residents with Bowel/Bladder Incontinence Info Percent of low risk long-stay residents who lose control of their bowels or bladder 14.0%
24% worse than California average

California average: 11.3%

Falls with Major Injury Info Percent of long-stay residents experiencing one or more falls with major injury 2.0%
20% worse than California average

California average: 1.7%

High Risk Residents with Pressure Ulcers Info Percent of long-stay high risk residents with pressure ulcers 9.3%
88% worse than California average

California average: 5.0%

Urinary Tract Infection Info Percent of long-stay residents with a urinary tract infection 2.6%
110% worse than California average

California average: 1.2%

Lost Too Much Weight Info Percent of long-stay residents who lose too much weight 7.2%
70% worse than California average

California average: 4.2%

Depressive Symptoms Info Percent of long-stay residents who have depressive symptoms 6.9%
In line with California average

California average: 6.7%

Antipsychotic Use Info Percent of long-stay residents who received an antipsychotic medication 13.1%
30% worse than California average

California average: 10.1%

Pneumococcal Vaccine Info Percent of long-stay residents assessed and appropriately given the pneumococcal vaccine 100.0%
In line with California average

California average: 98.5%

Influenza Vaccine Info Percent of long-stay residents assessed and appropriately given the seasonal influenza vaccine 100.0%
In line with California average

California average: 98.2%

Hospitalizations per 1,000 days Info Number of hospitalizations per 1,000 long-stay resident days. 2.18
In line with California average

California average: 2.25

ED visits per 1,000 days Info Number of outpatient emergency department visits per 1,000 long-stay resident days. 1.26
21% better than California average

California average: 1.59

Short-stay resident measures
Significantly below average Info CMS star rating based on short-stay quality measure performance. 5 stars = much above average, 1 star = much below average.
Pneumococcal Vaccine Info Percent of short-stay residents assessed and appropriately given the pneumococcal vaccine 99.1%
5% better than California average

California average: 94.0%

Antipsychotic medication increase Info Percent of short-stay residents who newly received an antipsychotic medication 3.1%
115% worse than California average

California average: 1.5%

Influenza Vaccine Info Percent of short-stay residents assessed and appropriately given the seasonal influenza vaccine 100.0%
7% better than California average

California average: 93.2%

Re-hospitalized after SNF stay Info Percentage of short-stay residents who were re-hospitalized after their nursing home admission. 22.4%
In line with California average

California average: 23.2%

Emergency department visits Info Percentage of short-stay residents who had an outpatient emergency department visit. 12.9%
15% worse than California average

California average: 11.2%

Falls with major injury Info Percentage of SNF residents who experience falls with major injury during their stay. 0.0%
100% better than California average

California average: 0.8%

Ability to care for self at discharge Info Percentage of residents at or above expected ability to care for themselves at discharge. 33.0%
39% worse than California average

California average: 53.7%

Successful return to home or community Info Rate of successful return to home or community from a skilled nursing facility. 52.8%
In line with California average

California average: 50.6%

Breakdown by payment type

Medicare

43% of new residents, usually for short-term rehab.

Typical stay 3 days

Private pay

17% of new residents, often for short stays.

Typical stay 4 - 5 months

Medicaid

40% of new residents, often for long-term daily care.

Typical stay 10 days

Facility Characteristics

Source: CMS Long-Term Care Facility Characteristics (Data as of Jan 2026)

Total residents 93
Medicare
27
29% of residents
Medicaid
53
57% of residents
Private pay or other
13
14% of residents
Programs & Services
Residents Group

Residents meet regularly to discuss policies, care quality, and activities

Active Resident Council

Organized group of residents that meets regularly to discuss facility policies, quality of life, and activities.

Finances and operations

Privately-owned community
Home revenue
$4.7M
Profit
$1.7M
Privately-owned community
Home revenue
$4.7M Rank #340 / 347Revenue — State benchmarkedThis home is ranked 340th out of 347 homes in California. Shows this facility's annual revenue compared to the California SNF average. Higher revenue generally means more resources for staffing and capital — read alongside Payroll %.Click the rank badge to see the full State ranking.Click here to see the full State ranking.
Profit
$1.7M
Payroll costs Info The portion of the home's budget spent on staff, including nurses, caregivers, and other employees who support care and operations. Rank #343 / 347Payroll — State benchmarkedThis home is ranked 343rd out of 347 homes in California. Shows total annual staff payroll benchmarked to the California average. Higher payroll investment relative to peers often signals better staffing and less reliance on cheaper contract labor.Click the rank badge to see the full State ranking.Click here to see the full State ranking.
$2.5M
53.9% of revenue Rank #126 / 347Payroll % — State benchmarkedThis home is ranked 126th out of 347 homes in California. Shows payroll as a percentage of revenue versus the California average. Well-run California SNFs typically land around 56–67% — the top third Statewide. Below 25% may signal understaffing or heavy agency use — read with Staffing ratings.Click the rank badge to see the full State ranking.Click here to see the full State ranking.
Other operating costs Info All remaining costs needed to run the home, such as food, utilities, building maintenance, supplies and administrative expenses.
$444.4K
Total costs $3.0M

What does this home offer?

Housing options icon

Housing Options: Private / Semi-Private Rooms

Building type icon
Building type icon

Building Type: Single-story

Dining services icon

Dining Services

Beauty services icon

Beauty Services

Social and recreational activities icon

Social and Recreational Activities

Rehabilitative support icon

Rehabilitative Support

On-site medical care and health services icon

On-site Medical Care and Health Services

Who this home usually serves

TYPE OF STAY

Mostly short-term rehab stays

Most residents typically stay for a few weeks or months before returning home or moving on.

Places of interest near Santa Clarita Post Acute

Address 1.8 miles from city center Info Estimated distance in miles from Newhall's city center to Santa Clarita Post Acute's address, calculated via Google Maps.

Calculate Travel Distance to Santa Clarita Post Acute

Add your location

Address

Financial Assistance for
Nursing Home in California

Santa Clarita Post Acute is located in Newhall, California.
Here are the financial assistance programs available to residents in California.

Get Financial aid guidance

Multipurpose Senior Services Program

MSSP (Medi-Cal Waiver)

Age 65+
General California resident, Medi-Cal eligible, nursing home risk.
Income Limits (2025) ~$2,829/month 300% FBR, individual
Asset Limits $2,000 (individual), $3,000 (couple).
CA

County-managed; waitlists possible.

Benefits
In-home support (4-6 hours/day) Respite care (14 days/year) Meals (~$6/meal) Transportation (8 trips/month) Care management

In-Home Supportive Services (IHSS)

California IHSS

Age 65+
General California resident, Medicaid-eligible or low-income.
Income Limits ~$1,732/month individual, Medi-Cal threshold
Asset Limits $2,000 individual
CA

Can hire family as caregivers.

Benefits
Personal care (up to 283 hours/month) Homemaker services Respite (varies)

Multipurpose Senior Services Program (MSSP)

CA MSSP

Age 65+
General California resident, Medi-Cal-eligible, nursing home-eligible but community-capable.
Income Limits ~$2,829/month 300% FBR, individual
Asset Limits $2,000 individual
CA

Available in 38 counties; waitlists common.

Benefits
Case management Respite care (up to 10 days/year) Minor home mods (avg. $500) Adult day care (~$50/day)

Property Tax Postponement Program (PTP)

CA PTP

Age 62+
General California resident, own and live in home, 40% equity.
Income Limits (2025) ~$51,500/year household, adjusted annually
Asset Limits Equity-based; no strict asset cap.
CA

Deferred taxes accrue interest (5% as of 2024); repaid upon sale/death.

Benefits
Property tax deferral (avg. $1,000-$3,000/year, varies by county)

Assisted Living Waiver (ALW)

CA ALW

Age 65+ or disabled
General California resident, Medi-Cal-eligible, nursing home-eligible.
Income Limits ~$2,829/month 300% FBR, individual
Asset Limits $2,000 individual
CA

Available in 15 counties (e.g., LA, Sacramento); waitlists common.

Benefits
Personal care in ALFs (5-7 hours/day) Medication management Social services

California CARES Program

CA CARES

Age
General Caregivers of California residents 60+ needing help with 3+ daily activities; no caregiver age limit.
Income Limits No strict limit; cost-sharing above ~$2,500/month threshold.
Asset Limits Not applicable; need-based.
CA

High demand in urban areas; complements IHSS respite.

Benefits
Respite care (up to 10 days/year) Counseling (4-6 sessions/year) Training (2-3 workshops/year) Supplies (~$200/year)

Frequently Asked Questions about Santa Clarita Post Acute

What neighborhood is Santa Clarita Post Acute in?

Santa Clarita Post Acute is in the Newhall neighborhood.

Is Santa Clarita Post Acute in a walkable area?

Santa Clarita Post Acute has a walk score of 69. Moderately walkable. Some errands can be accomplished on foot, with a mix of nearby amenities.

What is the best email address for Santa Clarita Post Acute?

The team at Santa Clarita Post Acute can be reached at [email protected].

What is the address of Santa Clarita Post Acute?

Santa Clarita Post Acute is located at 23801 Newhall Ave, Newhall, CA 91321.

What is the phone number of Santa Clarita Post Acute?

(661) 254-2425 will put you in contact with the team at Santa Clarita Post Acute.

Is Santa Clarita Post Acute Medicare or Medicaid certified?

Yes — Santa Clarita Post Acute is a CMS-certified provider of Medicare and Medicaid.

Guides for Better Senior Living

Care Cost Calculator: See Prices in Your Area

Nursing Home Data Explorer

Don’t Wait Too Long: 7 Red Flag Signs Your Parent Needs Assisted Living Now

The True Cost of Assisted Living in 2025 – And How Families Are Paying For It

Understanding Senior Living Costs: Pricing Models, Discounts & Financial Assistance

Explore Open Rooms
1 Contact details
2 What type of senior care service are you looking for?
3 What budget do you have in mind for senior care?
4 How soon do you need to find care?
5 Additional details

Thank you for your interest!

Our team will be in touch shortly to help with next steps.