Explore Open Rooms

1 Contact details
2 What type of senior care service are you looking for?
3 What budget do you have in mind for senior care?
4 How soon do you need to find care?
5 Additional details

Thank you for your interest!

Our team will be in touch shortly to help with next steps.

Nursing Home in Sacramento County

CMS overall rating Info The Overall CMS Rating combines results from health inspections, staffing levels and quality measures. Health inspections carry the most weight. Staffing and quality scores can increase or decrease the final rating based on performance compared to state and national standards.

Saylor Lane Health Care Center

3500 Folsom Blvd, Sacramento, CA 95816 View map
Overview of Saylor Lane Health Care Center

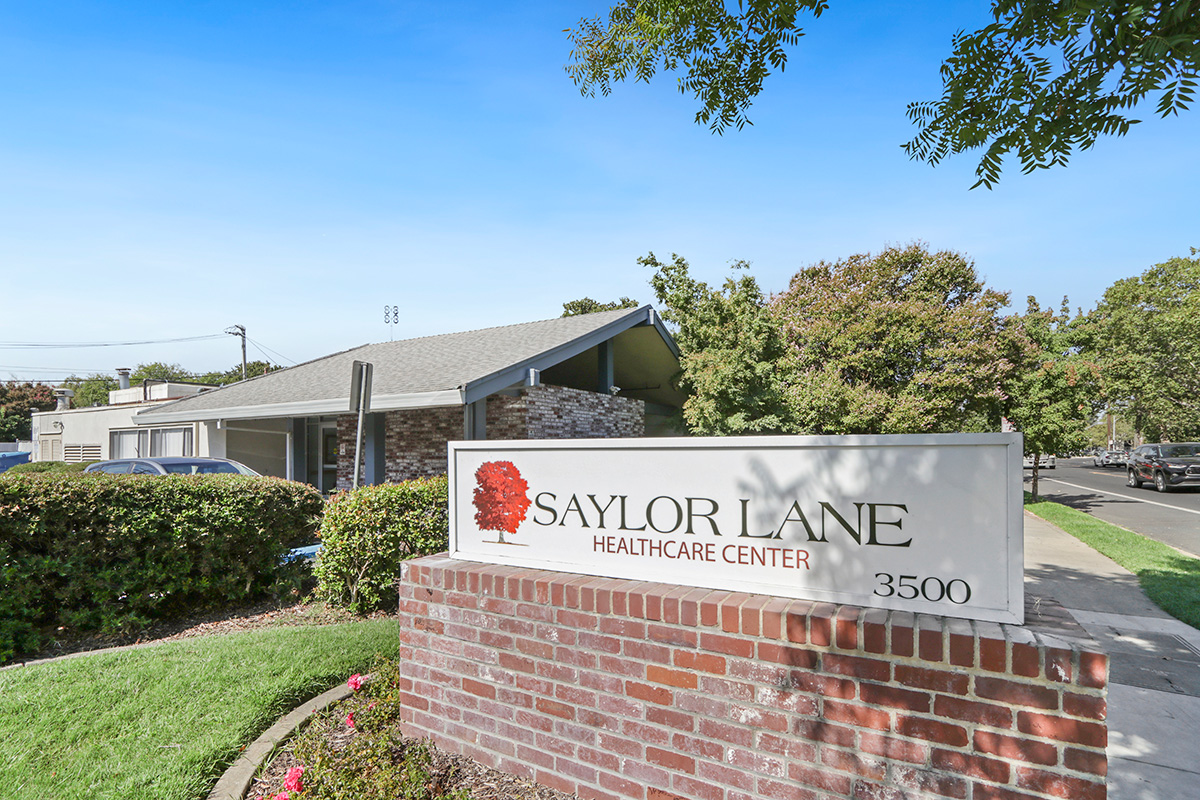
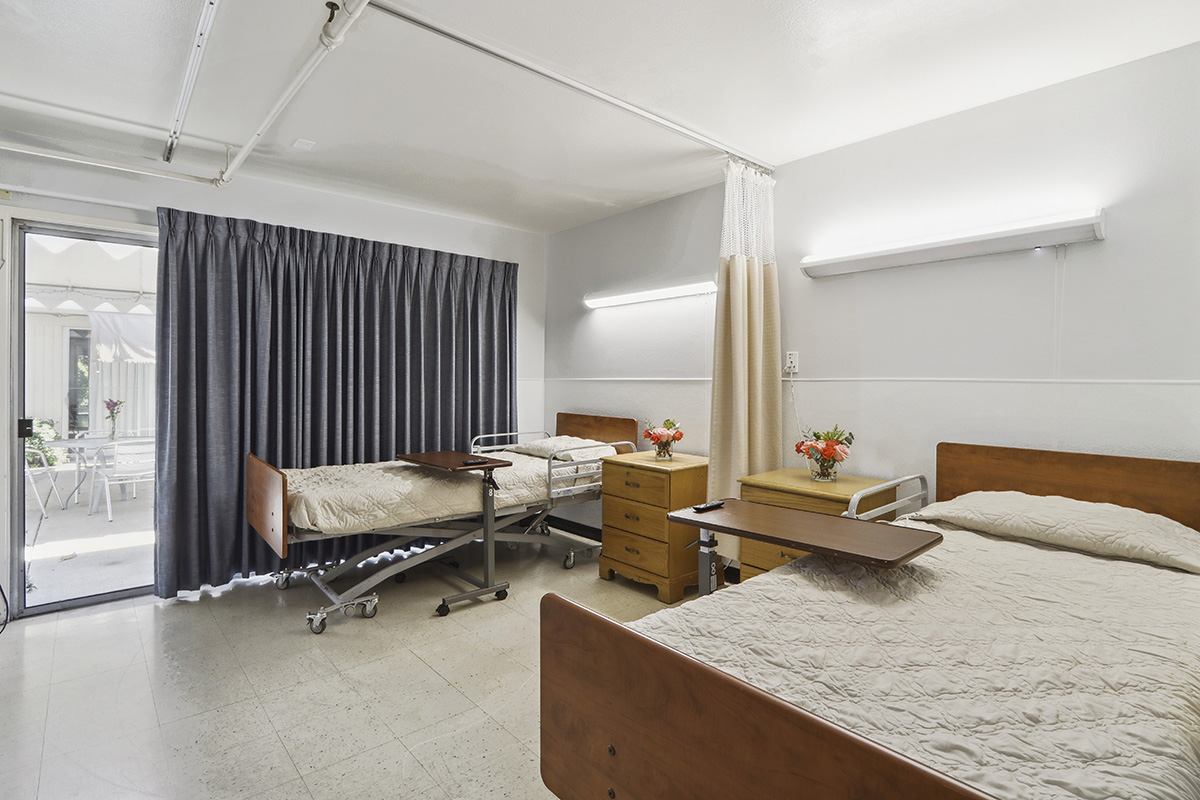
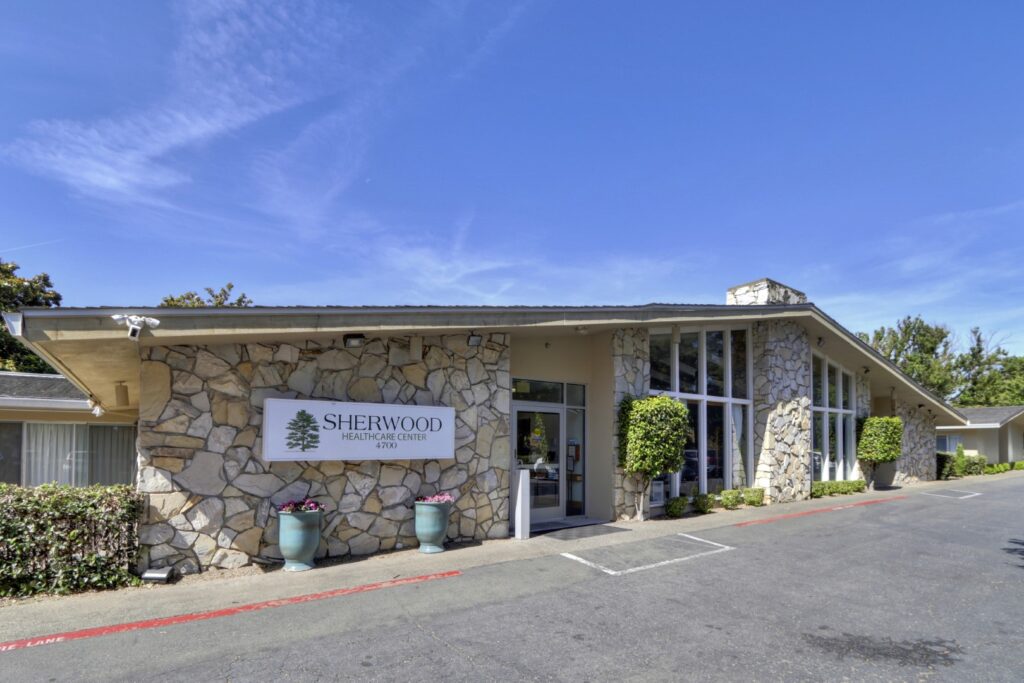
Ideally situated near Mercy General Hospital in Sacramento, CA, Saylor Lane Health Care Center is a distinguished community that offers skilled nursing. Here, residents enjoy the highest quality of care with a respectful and highly skilled team attending to their needs around the clock. The community is a Medicare and Medi-Cal provider, ensuring residents receive the utmost care they deserve while staying within their financial capabilities.

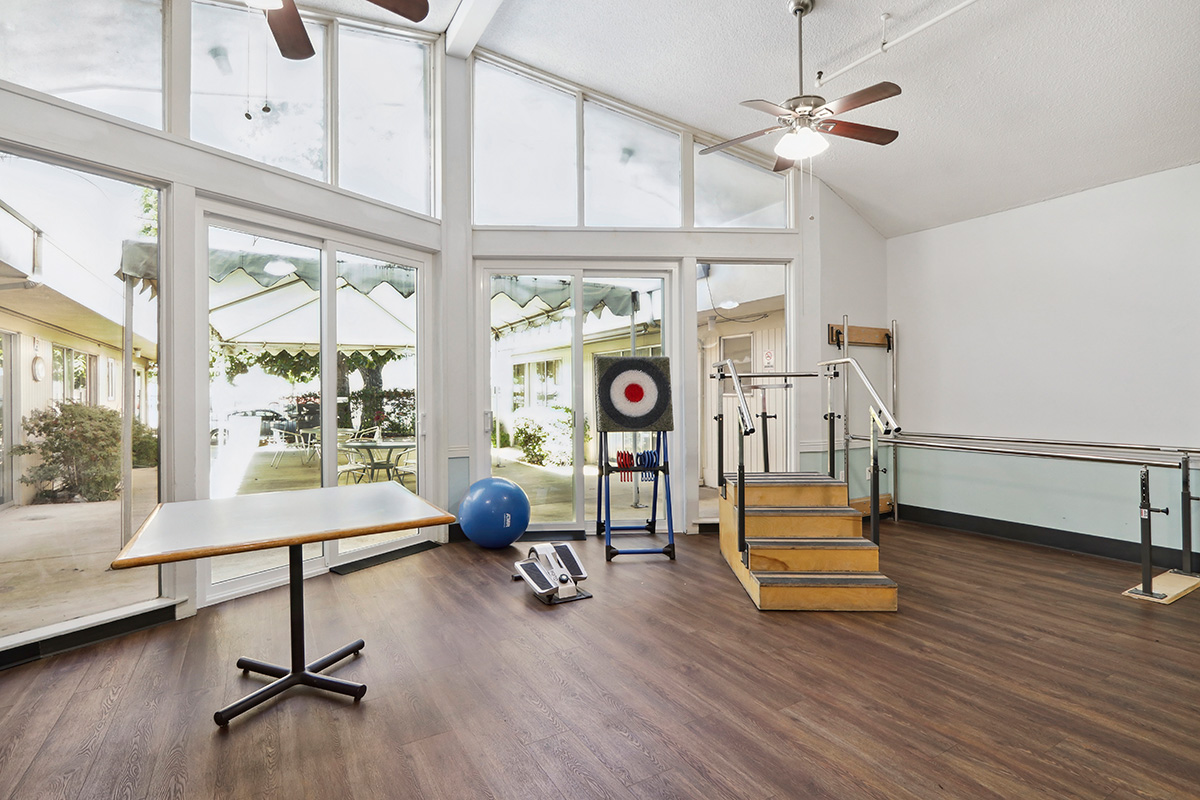
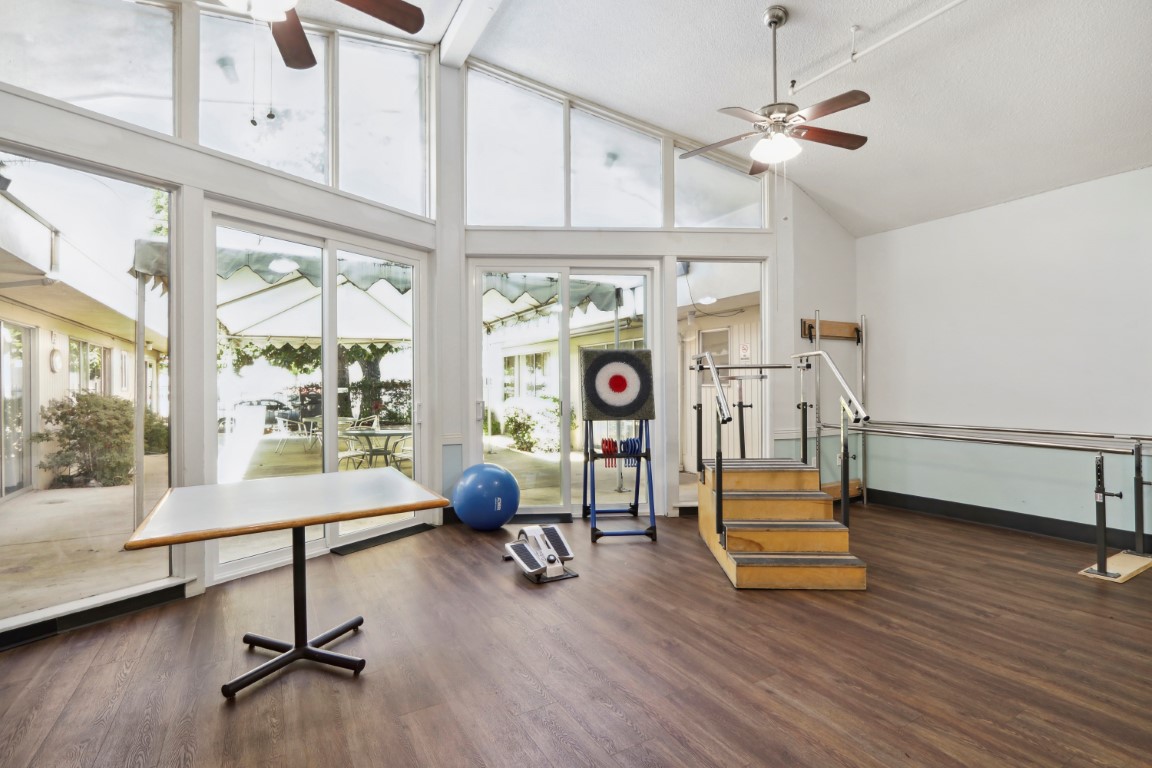
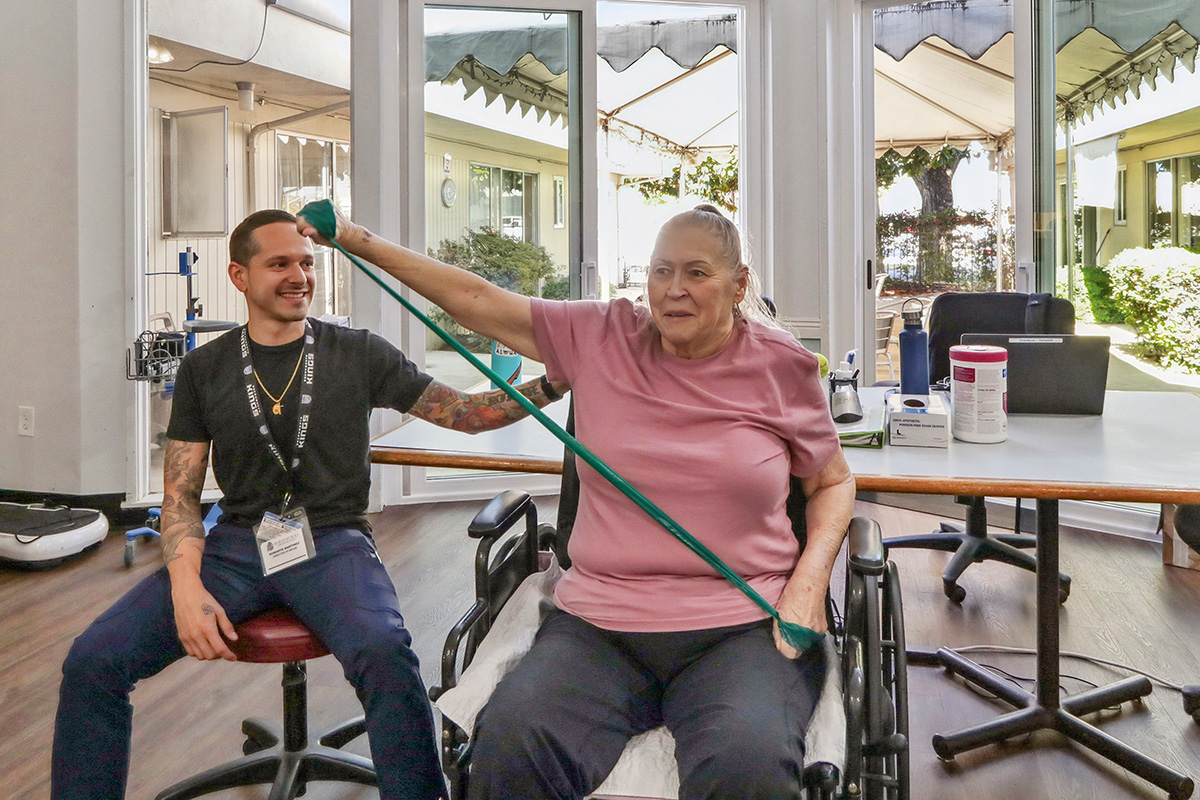
A fun-filled calendar of fun activities and engaging programs is also orchestrated, promoting social interactions and an active lifestyle. Physical, occupational, and speech therapies are provided to enhance residents’ living experiences. Residents maintain dignity and independence, accompanied by the community’s top-notch services and extensive amenities.

(916) 457-3500

Quality ratings

Measured by Centers for Medicare & Medicaid Services (CMS)

Overall rating Info The Overall CMS Rating combines results from health inspections, staffing levels and quality measures. Health inspections carry the most weight. Staffing and quality scores can increase or decrease the final rating based on performance compared to state and national standards.
4/5
California average: 3.6/5
Health Inspection Info Based on the results of the facility's three most recent standard inspections and any complaint investigations. CMS reviews the number, scope, and severity of deficiencies, with more recent findings weighted more heavily.
3/5
California average: 3.2/5
Staffing Info Measures average nursing staff hours per resident per day, including Registered Nurses (RNs) and total nursing staff. Ratings are adjusted based on the level of care residents require and are compared to state and national benchmarks.
3/5
California average: 3.5/5
Quality Measures Info Based on clinical and physical health indicators reported to CMS, such as hospital readmissions, falls, pressure ulcers, and improvements in mobility. These measures reflect how well residents' health needs are being managed.
5/5
California average: 4.3/5

Nursing care per resident

Info This shows how many total hours of nursing staff time are available per resident each day. Higher numbers usually mean more staff support.
4h 23m per day

This home provides 0% more nursing time per resident than the California average.

California average: 4h 23m per day

Staffing hours breakdown

Info Hours of care per resident per day, broken down by staff type. Data from CMS Medicare.
Staff type Facility State avg National avg
Registered Nurse (RN) Info Registered nurse hours per resident per day. 23m per day 39m per day 41m per day
Nurse Aide Info Nurse aide hours per resident per day. 2h 41m per day 2h 39m per day 2h 21m per day
Total Nursing (Weekend) Info Total number of nurse staff hours per resident per day on weekends. 3h 54m per day 4h 5m per day 3h 26m per day
Physical Therapist Info Physical therapist staff hours per resident per day. 4m per day 5m per day 4m per day
RN (Weekend) Info Registered nurse hours per resident per day on weekends. 17m per day 30m per day 29m per day

Capacity and availability

Smaller home

May offer a more intimate, personalized care environment.

Total beds 42

This home usually has limited availability

Occupancy is moderate, suggesting balanced demand.

Similar demand to the California average
Occupancy rate 87.2%
Residents per day (avg) 37
Occupancy rate
87.2%
Residents per day (avg)
37

Who this home usually serves

TYPE OF STAY

Primarily short stays

Residents typically stay for brief periods, with frequent admissions and discharges throughout the year.

Might be optimal for
Post-acute recovery Temporary care Transitional stays

Breakdown by payment type

Medicare

28% of new residents, usually for short-term rehab.

Typical stay 1 months

Private pay

69% of new residents, often for short stays.

Typical stay 25 days

Medicaid

4% of new residents, often for long-term daily care.

Typical stay 1 years

Finances and operations

Privately-owned community
Home revenue
$6.6M
Profit
$448.8K
Privately-owned community
Home revenue
$6,618,272.00
Profit
$448,803.00
Payroll costs Info The portion of the home's budget spent on staff, including nurses, caregivers, and other employees who support care and operations.
$3.1M
47% of revenue
Other operating costs Info All remaining costs needed to run the home, such as food, utilities, building maintenance, supplies and administrative expenses.
$3.1M
Total costs $6.2M
Walk Score
Walk Score: 89 / 100
Very walkable. Most errands can be accomplished on foot, and many essentials are within a short walk.

About this community

License Details

Status2001-05-16t00:00:00z

Additional Licensing Details

CMS Certification Number55417
Inspection Rating4-Star Medicare Rating

Payment & Insurance

1 service
Accept Medicare

Therapy & Rehabilitation

1 service
Rehabilitation Services

Staffing & Medical

2 services
Skilled Nursing
24-Hour Staffing

Amenities & Lifestyle

0 amenities
Specific ProgramsNursing, Rehabilitation, Social Services

What does this home offer?

Accepts Medicaid icon

Accept Medicaid: Yes

Housing options icon

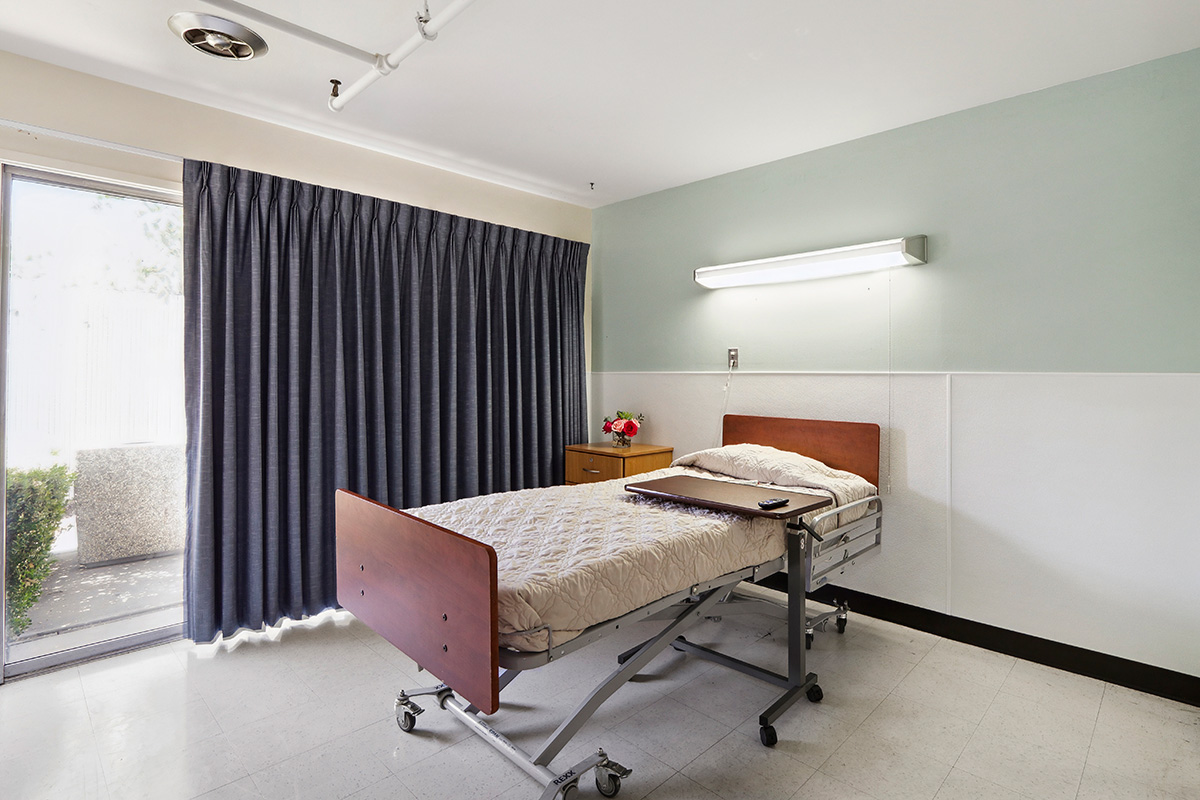
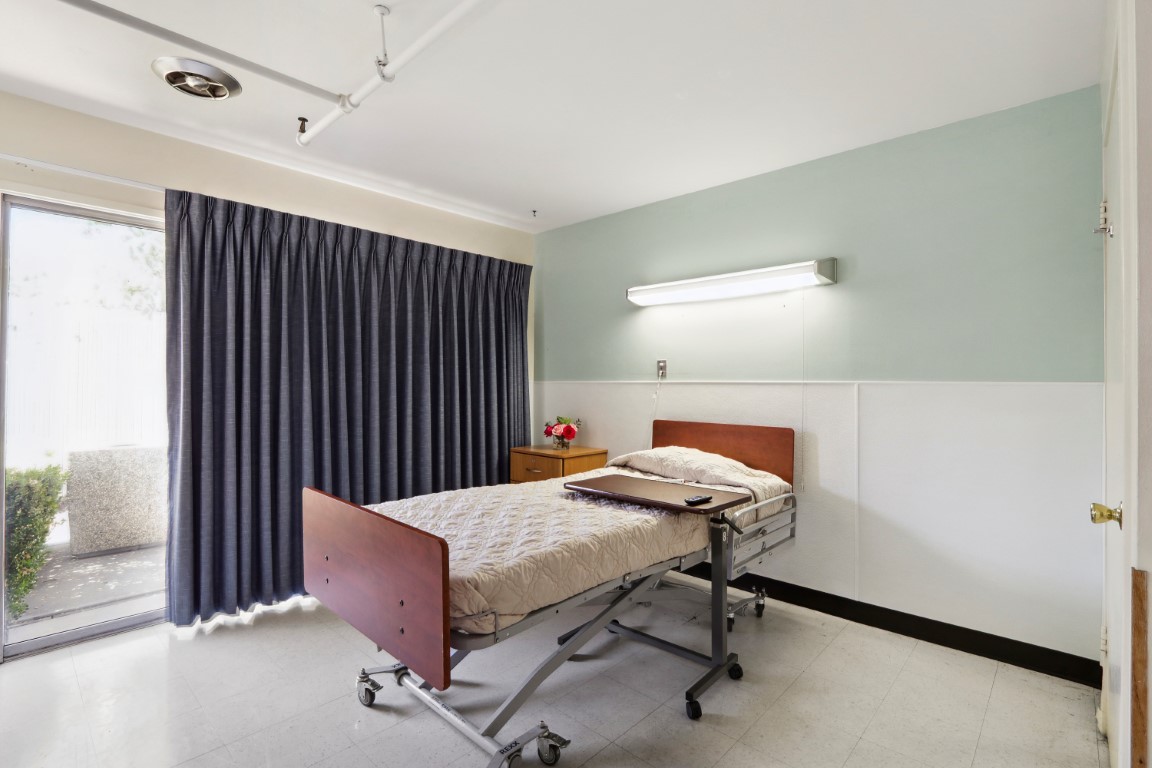
Housing Options: Private / Semi-private Rooms

Building type icon
Building type icon

Building Type: Single-story

Dining services icon

Dining Services

Recreational activities icon

Recreational Activities

Health Programs icon

Health Programs

Types of Care at Saylor Lane Health Care Center

Nursing Home
Contact Saylor Lane Health Care Center

Access & Eligibility

Ways to qualify for care at this community, including accepted programs and payment options.

Medicare Accepted

This facility is certified for eligible Medicare services.

Payment & Funding Options

Medicare

Inspection History

In California, the Department of Social Services (for assisted living facilities) and the Department of Public Health (for nursing homes) conduct inspections to ensure resident safety and regulatory compliance.

Health Inspection History

Inspections
Total health inspections 4

California average 12.5


Last Health inspection on May 2025

Total health citations 41

California average 50.2

Citations per inspection
10.25

California average 4.65


Health citations are formal notices following inspections when they fail to comply with safety and care standards.

39 of 41 citations resulted from standard inspections; and 2 of 41 resulted from complaint investigations.

Breakdown of citation severity (last 3 years)
Critical Health citations More info 0
100% better than California average

California average: 0.4


Serious Health citations More info 0
100% better than California average

California average: 1

0 critical citations More info California average: 0.4

0 serious citations More info California average: 1

40 moderate citations More info California average: 47.2

1 minor citation More info California average: 1.5
Citations history (last 3 years)
Infection Control moderate citation Info Issues related to preventing and controlling infections, including hygiene practices and safety protocols. May 08, 2025
Corrected

Infection Control moderate citation Info Issues related to preventing and controlling infections, including hygiene practices and safety protocols. May 08, 2025
Corrected

Nutrition moderate citation Info Issues related to food quality, meal service, and resident's nutritional needs. May 08, 2025
Corrected

Nutrition moderate citation Info Issues related to food quality, meal service, and resident's nutritional needs. May 08, 2025
Corrected

Compare Nursing Homes around Sacramento County The information below is reported by the California Department of Social Services and Department of Public Health.

4 facilities compared · CMS & CA Dept. of Health data · Updated Apr 2026

Filter by care type
University Post-Acute Rehab
MC

Memory Care Secured, specialized care for people living with Alzheimer's or dementia. Staff trained in cognitive impairment, with higher staff-to-resident ratios and an environment designed to reduce confusion and wandering risk.

NH

Nursing Home Licensed facility providing 24/7 skilled nursing care for residents with complex, ongoing medical needs. Staffed by RNs, LPNs, and CNAs. Inspected and star-rated annually by CMS. Accepts Medicare (short-term rehab) and Medicaid (long-term care).

Sacramento (Southeastern Sacramento)
59
87.3%
+3%
3.91
+86%
-7%
1
27
3.4
0
54
69
-
$9.8M
$4.9M
50%
555265
Private / Semi-private Rooms
Sherwood Healthcare Center
NH

Nursing Home Licensed facility providing 24/7 skilled nursing care for residents with complex, ongoing medical needs. Staffed by RNs, LPNs, and CNAs. Inspected and star-rated annually by CMS. Accepts Medicare (short-term rehab) and Medicaid (long-term care).

Sacramento (East Sacramento)
62
91.4%
+8%
4.15
-57%
-2%
2
14
4.7
0
56
49
Cypress Healthcare Group Llc
$9.7M
$4.7M
47.8%
55305
Private / Semi-private Rooms
Saylor Lane Health Care Center
NH

Nursing Home Licensed facility providing 24/7 skilled nursing care for residents with complex, ongoing medical needs. Staffed by RNs, LPNs, and CNAs. Inspected and star-rated annually by CMS. Accepts Medicare (short-term rehab) and Medicaid (long-term care).

Sacramento (East Sacramento)
42
87.2%
+3%
4.38
-26%
+4%
2
41
10.3
0
37
89
-
$6.6M
$3.1M
47%
55417
Private / Semi-private Rooms
West Sacramento Nursing and Rehabilitation Center
-
NH

Nursing Home Licensed facility providing 24/7 skilled nursing care for residents with complex, ongoing medical needs. Staffed by RNs, LPNs, and CNAs. Inspected and star-rated annually by CMS. Accepts Medicare (short-term rehab) and Medicaid (long-term care).

West Sacramento
-
-
-
-
-
-
-
-
-
0
0
0.0
0
-
46
-
-
-
-
-
Private Rooms

Places of interest near Saylor Lane Health Care Center

Address 2.3 miles from city center
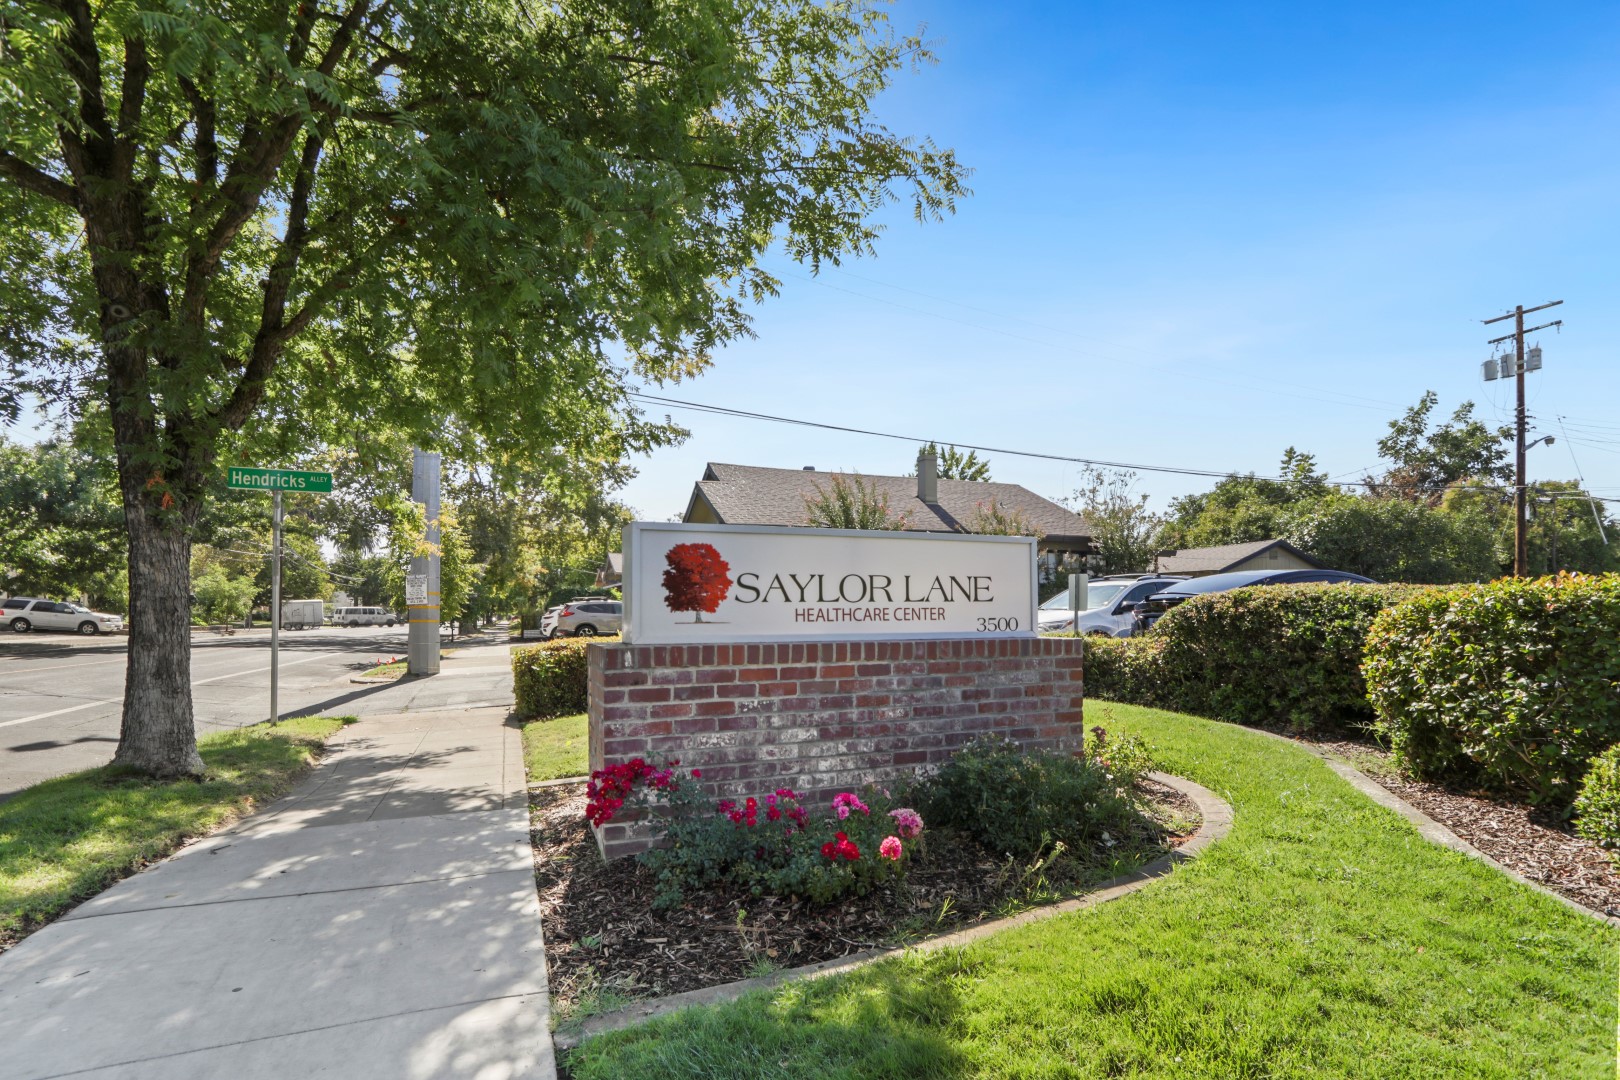
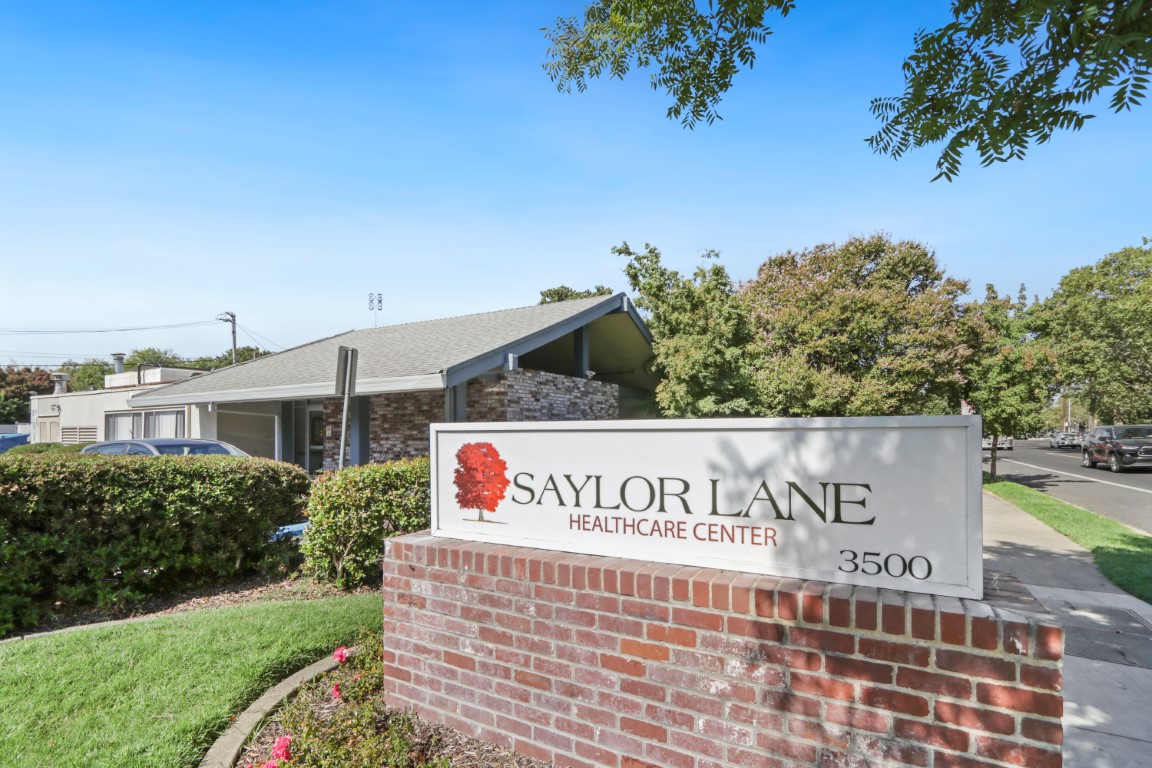
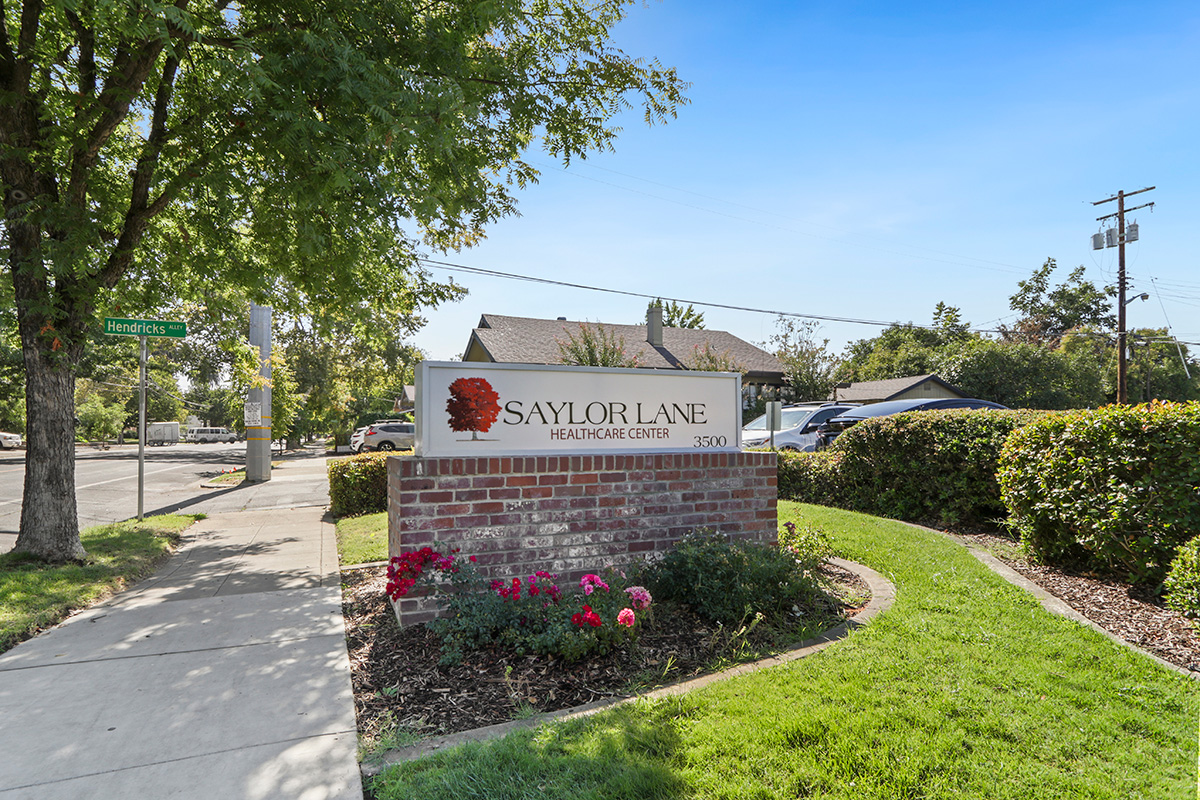
Address 3500 Folsom Blvd, Sacramento, CA 95816

Calculate Travel Distance to Saylor Lane Health Care Center

Add your location

Address

Staffing Data (Q2 2025)

This data corresponds to Q2 2025 and is based on CMS Payroll-Based Journal.

Total staff 63
Employees 58
Contractors 5
Staff to resident ratio 1.91:1
1908991% better than California average

California average ratio: 0.00:1

Avg staff/day 28
Average shift 6.9 hours
10% worse than California average

California average: 7.7 hours

Total staff hours (quarter) 17,579
Nursing staff breakdown
Registered Nurse

Manages medical care and health needs.

Total count 4
Average shift length Info Average shift length. Calculated as total hours divided by days worked and average staff per day. 6.9 hours

No contractors work on this role.

Licensed Practical Nurse

Assists with medical care and medications.

Total count 14
Average shift length Info Average shift length. Calculated as total hours divided by days worked and average staff per day. 7.4 hours

This role is partially covered by contractors.

Certified Nursing Assistant

Helps with daily care and mobility.

Total count 24
Average shift length Info Average shift length. Calculated as total hours divided by days worked and average staff per day. 7.8 hours

No contractors work on this role.

Contractor staffing

Total hours from contractors

0.4%

71 contractor hours this quarter

Licensed Practical Nurse: 4 Speech Language Pathologist: 1
Staff by category
Certified Nursing Assistant240248,60391100%7.8
Licensed Practical Nurse104143,89591100%7.4
Registered Nurse4049628998%6.9
Nurse Aide in Training2026057684%7.1
Mental Health Service Worker1015046369%8
Other Social Services Staff1014886167%8
Dietitian1014806470%7.5
Speech Language Pathologist1124636066%7
Nurse Practitioner1013524448%8
Physical Therapy Aide1013056268%4.9
Respiratory Therapy Technician3032316167%2.5
Administrator1012056470%3.2
RN Director of Nursing1011552022%7.8
Physical Therapy Assistant2021376268%2.1
Occupational Therapy Aide1011016066%1.7
Qualified Social Worker303924246%2.1
Qualified Activities Professional101211%2
24 Certified Nursing Assistant
% of Days 100%
14 Licensed Practical Nurse
% of Days 100%
4 Registered Nurse
% of Days 98%
2 Nurse Aide in Training
% of Days 84%
1 Mental Health Service Worker
% of Days 69%
1 Other Social Services Staff
% of Days 67%
1 Dietitian
% of Days 70%
2 Speech Language Pathologist
% of Days 66%
1 Nurse Practitioner
% of Days 48%
1 Physical Therapy Aide
% of Days 68%
3 Respiratory Therapy Technician
% of Days 67%
1 Administrator
% of Days 70%
1 RN Director of Nursing
% of Days 22%
2 Physical Therapy Assistant
% of Days 68%
1 Occupational Therapy Aide
% of Days 66%
3 Qualified Social Worker
% of Days 46%
1 Qualified Activities Professional
% of Days 1%

Facility Characteristics

Source: CMS Long-Term Care Facility Characteristics (Data as of Jan 2026)

Total census
33 residents
Residents by payment source
Medicare
9 residents (27.3%)
Medicaid
14 residents (42.4%)
Private pay or other
10 residents (30.3%)
Programs & Services
Residents' Group

Residents meet regularly to discuss policies, care quality, and activities

Nurse Aide Training

State-approved Nurse Aide Training and Competency Evaluation Program on-site

Active Resident Council

Organized group of residents that meets regularly to discuss facility policies, quality of life, and activities.

Quality of care over time

These measures show how residents usually do over time at this home, based on health outcomes and preventive care.

High-risk clinical events score Info A composite score based on pressure ulcers, falls with injury, weight loss, walking ability decline, and activities of daily living decline. 5.0
25% better than California average

California average: 6.6

Functional decline score Info A composite score based on activities of daily living decline, walking ability decline, and incontinence. 5.0
56% better than California average

California average: 11.3

Long-stay resident measures
Significantly above average California avg: 4.3 Info CMS star rating based on long-stay quality measure performance. 5 stars = significantly above average, 1 star = significantly below average.
Need for Help with Daily Activities Increased Info Percent of long-stay residents whose need for help with daily activities has increased 4.6%
59% better than California average

California average: 11.1%

Walking Ability Worsened Info Percent of long-stay residents whose ability to move independently worsened 6.2%
48% better than California average

California average: 12.0%

Low Risk Residents with Bowel/Bladder Incontinence Info Percent of low risk long-stay residents who lose control of their bowels or bladder 4.3%
62% better than California average

California average: 11.3%

Falls with Major Injury Info Percent of long-stay residents experiencing one or more falls with major injury 0.0%
100% better than California average

California average: 1.7%

High Risk Residents with Pressure Ulcers Info Percent of long-stay high risk residents with pressure ulcers 11.3%
127% worse than California average

California average: 5.0%

Urinary Tract Infection Info Percent of long-stay residents with a urinary tract infection 0.0%
100% better than California average

California average: 1.2%

Lost Too Much Weight Info Percent of long-stay residents who lose too much weight 2.9%
31% better than California average

California average: 4.2%

Depressive Symptoms Info Percent of long-stay residents who have depressive symptoms 0.0%
100% better than California average

California average: 6.7%

Antipsychotic Use Info Percent of long-stay residents who received an antipsychotic medication 3.5%
66% better than California average

California average: 10.1%

Pneumococcal Vaccine Info Percent of long-stay residents assessed and appropriately given the pneumococcal vaccine 100.0%
In line with California average

California average: 98.5%

Influenza Vaccine Info Percent of long-stay residents assessed and appropriately given the seasonal influenza vaccine 100.0%
In line with California average

California average: 98.2%

Short-stay resident measures
Average California avg: 3.5 Info CMS star rating based on short-stay quality measure performance. 5 stars = much above average, 1 star = much below average.
Pneumococcal Vaccine Info Percent of short-stay residents assessed and appropriately given the pneumococcal vaccine 100.0%
6% better than California average

California average: 94.0%

Antipsychotic medication increase Info Percent of short-stay residents who newly received an antipsychotic medication 0.0%
100% better than California average

California average: 1.5%

Influenza Vaccine Info Percent of short-stay residents assessed and appropriately given the seasonal influenza vaccine 99.4%
7% better than California average

California average: 93.2%

Re-hospitalized after SNF stay Info Percentage of short-stay residents who were re-hospitalized after their nursing home admission. 22.5%
In line with California average

California average: 23.2%

Emergency department visits Info Percentage of short-stay residents who had an outpatient emergency department visit. 14.0%
25% worse than California average

California average: 11.2%

Falls with major injury Info Percentage of SNF residents who experience falls with major injury during their stay. 0.0%
100% better than California average

California average: 0.8%

Ability to care for self at discharge Info Percentage of residents at or above expected ability to care for themselves at discharge. 47.5%
11% worse than California average

California average: 53.7%

Successful return to home or community Info Rate of successful return to home or community from a skilled nursing facility. 49.7%
In line with California average

California average: 50.6%

Penalties and fines

Federal penalties imposed by CMS for regulatory violations, including civil money penalties (fines) and denials of payment for new Medicare/Medicaid admissions.

Source: CMS Penalties Database (Data as of Jan 2026)

Total fines amount $5K
91% lower than California average

California average: $55K

Number of fines 2
15% fewer fines than California average

California average: 2.4

Payment Denials Info Serious action where Medicare and/or Medicaid temporarily stops payments for new residents until issues are fixed. 0
100% fewer payment denials than California average

California average: 0.5

Fines amount comparison
This facility $5K
California average $55K
Penalty History

Penalties are imposed by CMS for violations of federal nursing home regulations.

Civil Money Penalty Info Fines imposed for noncompliance, which can be assessed per day or per instance of violation. Jun 26, 2023
$2K
Civil Money Penalty Info Fines imposed for noncompliance, which can be assessed per day or per instance of violation. Jun 5, 2023
$3K

Last updated: Jan 2026

Guides for Better Senior Living

Care Cost Calculator: See Prices in Your Area

Nursing Home Data Explorer

Don’t Wait Too Long: 7 Red Flag Signs Your Parent Needs Assisted Living Now

The True Cost of Assisted Living in 2025 – And How Families Are Paying For It

Understanding Senior Living Costs: Pricing Models, Discounts & Financial Assistance

Financial Aid for California Seniors

Get financial aid guidance

Multipurpose Senior Services Program

MSSP (Medi-Cal Waiver)

Age 65+, California resident, Medi-Cal eligible, nursing home risk.

~$2,829/month (300% FBR, individual).

$2,000 (individual), $3,000 (couple).

County-managed; waitlists possible.

In-Home Supportive Services (IHSS)

California IHSS

Age 65+, California resident, Medicaid-eligible or low-income.

~$1,732/month (individual, Medi-Cal threshold).

$2,000 (individual).

Can hire family as caregivers.

Multipurpose Senior Services Program (MSSP)

CA MSSP

Age 65+, California resident, Medi-Cal-eligible, nursing home-eligible but community-capable.

~$2,829/month (300% FBR, individual).

$2,000 (individual).

Available in 38 counties; waitlists common.

Property Tax Postponement Program (PTP)

CA PTP

Age 62+, California resident, own and live in home, 40% equity.

~$51,500/year (household, adjusted annually).

Equity-based; no strict asset cap.

Deferred taxes accrue interest (5% as of 2024); repaid upon sale/death.

Assisted Living Waiver (ALW)

CA ALW

Age 65+ or disabled, California resident, Medi-Cal-eligible, nursing home-eligible.

~$2,829/month (300% FBR, individual).

$2,000 (individual).

Available in 15 counties (e.g., LA, Sacramento); waitlists common.

California CARES Program

CA CARES

Caregivers of California residents 60+ needing help with 3+ daily activities; no caregiver age limit.

No strict limit; cost-sharing above ~$2,500/month threshold.

Not applicable; need-based.

High demand in urban areas; complements IHSS respite.

Low-Income Home Energy Assistance Program (LIHEAP)

CA LIHEAP

Age 60+ priority, California resident, low-income, utility/heating need.

~$2,510/month (200% of poverty level, individual).

Not applicable; income-focused.

High demand in inland/coastal extremes; weatherization capped at $5,000/home.