Sherwood Healthcare Center
Nursing Home, Hospice Care, Memory Care & Respite Care · Sacramento, CA
CMS overall rating Info CMS (the Centers for Medicare & Medicaid Services) is the federal agency that rates nursing home quality. Its Overall Rating runs from 1 to 5 stars, combining health inspections, staffing, and quality measures, with inspections weighted most heavily.

Sherwood Healthcare Center

Nursing Home, Hospice Care, Memory Care & Respite Care · Sacramento, CA
CMS overall rating Info CMS (the Centers for Medicare & Medicaid Services) is the federal agency that rates nursing home quality. Its Overall Rating runs from 1 to 5 stars, combining health inspections, staffing, and quality measures, with inspections weighted most heavily.
Calculator: See prices in your area
Sherwood Healthcare Center accepts Medicare, Medicaid, and private pay.

Overview of Sherwood Healthcare Center

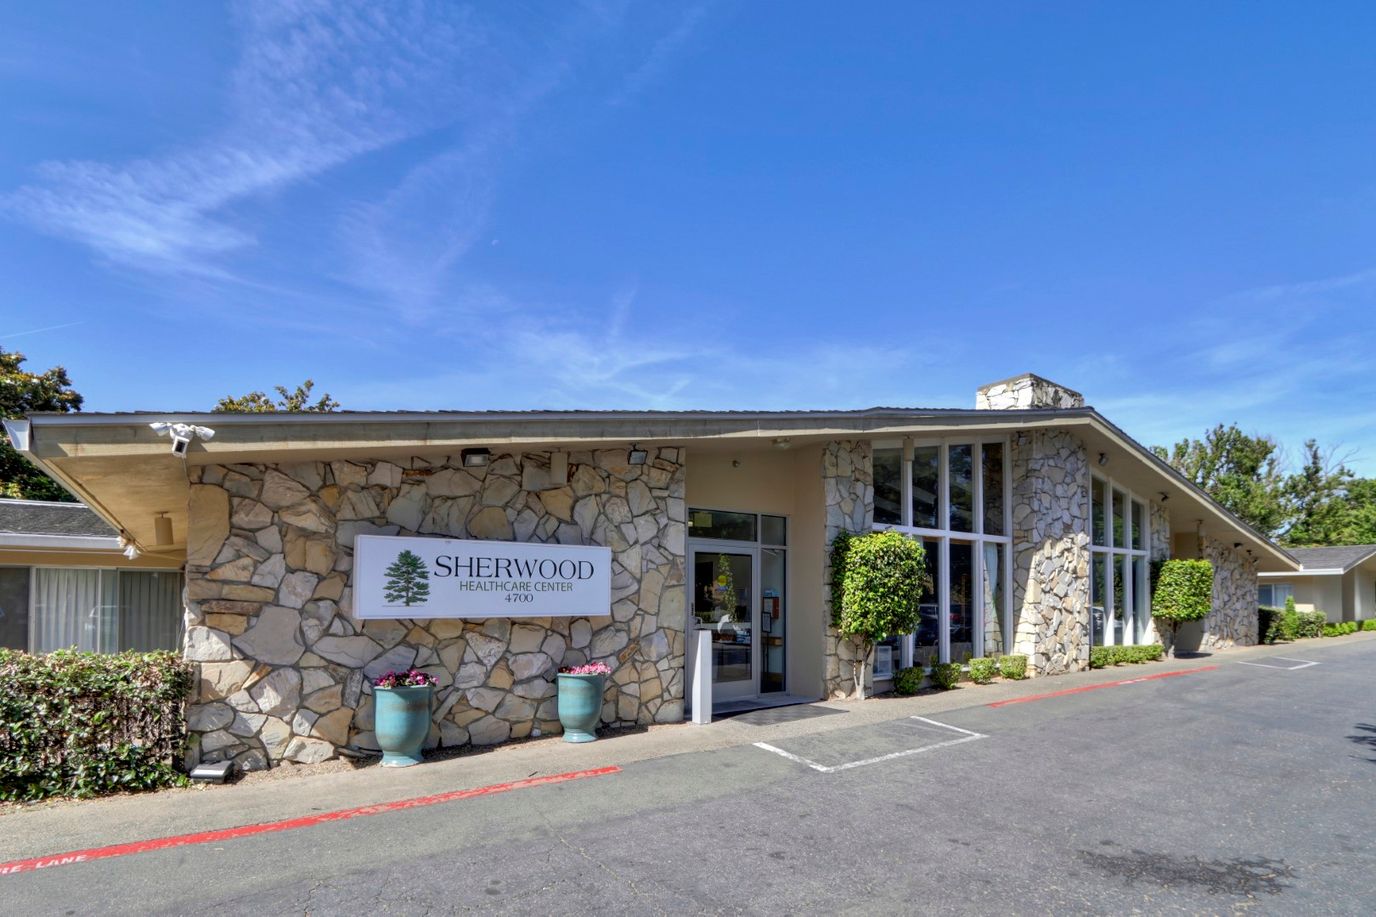
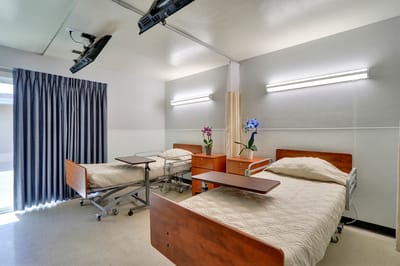
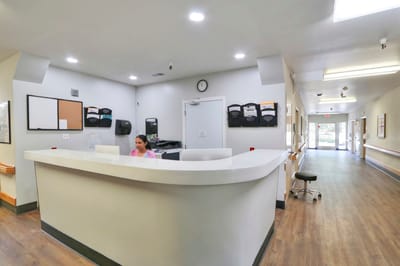
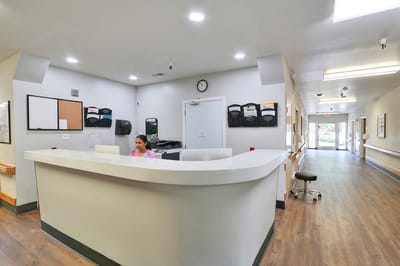
Surrounded by convenient local amenities in Sacramento, CA, Sherwood Healthcare Center is a distinguished community that offers skilled nursing and rehabilitation. Residents receive the utmost care and attention for their unique needs with a kind and well-trained team available 24/7. With a 5-star Medicare rating, the community strives to provide the highest quality of care for residents to live their lives to the fullest.

Residents will not feel lonely with a thoughtfully curated calendar of fun activities and enriching programs, highlighting their interests and strengths. Nutritious meals are important for residents’ well-being, so well-balanced dining options are served to meet dietary needs and preferences. The community strives to enhance residents’ living experiences with its genuine care and specially designed amenities.

Quality ratings

Measured by Centers for Medicare & Medicaid Services (CMS)

Overall rating Info The Overall CMS Rating combines results from health inspections, staffing levels and quality measures. Health inspections carry the most weight. Staffing and quality scores can increase or decrease the final rating based on performance compared to state and national standards.
▲ 58.8% Above CA avg. ▲ 58.8% Above CA avg.CA average: 3.1Click the badge to see the full State ranking.Click here to see the full State ranking.
Health Inspection Info Based on the results of the facility's three most recent standard inspections and any complaint investigations. CMS reviews the number, scope, and severity of deficiencies, with more recent findings weighted more heavily.
▲ 43.0% Above CA avg. ▲ 43.0% Above CA avg.CA average: 2.8Click the badge to see the full State ranking.Click here to see the full State ranking.
Staffing Info Measures average nursing staff hours per resident per day, including Registered Nurses (RNs) and total nursing staff. Ratings are adjusted based on the level of care residents require and are compared to state and national benchmarks.
▼ 4.4% Below CA avg. ▼ 4.4% Below CA avg.CA average: 3.1Click the badge to see the full State ranking.Click here to see the full State ranking.
Quality Measures Info Based on clinical and physical health indicators reported to CMS, such as hospital readmissions, falls, pressure ulcers, and improvements in mobility. These measures reflect how well residents' health needs are being managed.
▲ 22.4% Above CA avg. ▲ 22.4% Above CA avg.CA average: 4.1Click the badge to see the full State ranking.Click here to see the full State ranking.

Staffing hours breakdown

Info Daily nursing hours per resident by staff type, reported to CMS. Higher is generally better — compare this facility to state and national averages to see where staffing stands.

Hours per resident per day — compared to California state averages

Total nursing care / resident Info This home is ranked 160th out of 354 homes in California for nurse hours. Total adjusted nursing hours per resident per day, combining RN, LPN, and aide time. CMS adjusts this for case-mix so facilities can be fairly compared.
4h 9m per day
Rank #160 / 354Nurse hours — State benchmarkedThis home is ranked 160th out of 354 homes in California. Shows adjusted nurse hours per resident per day benchmarked to the California average, with a ranking across 354 California facilities. More hours mean more direct care. The national average is about 3.5 hrs; below 3.0 is a red flag.Rankings are based only on facilities in California that report data for that category. Facilities without available data are excluded from the ranking.Click the rank badge to see the full State ranking.Click here to see the full State ranking.
This facility California avg (4h 13m per day)
vs California avg
-2%

5 of 6 metrics below state avg

Staff typeHours / Day / Residentvs state avg
Registered Nurse (RN) Info RNs hold the highest nursing license and can assess residents, interpret test results, and direct care plans. More RN hours per day often signals stronger clinical oversight and faster response to health changes. 20m per day ▼ 49% State avg: 39m per day · National avg: 41m per day
LPN / LVN Info Licensed Practical Nurses (LPNs) or Licensed Vocational Nurses (LVNs) deliver routine hands-on care — medication administration, wound dressing, and monitoring vital signs. They work under RN supervision and make up a large share of daily bedside care. 1h 5m per day ▼ 11% State avg: 1h 13m per day · National avg: 52m per day
Nurse Aide Info Certified Nurse Aides (CNAs) provide the most direct day-to-day assistance: bathing, dressing, feeding, and mobility. Nurse aide hours are typically the largest staffing category and directly affect residents' quality of life. 2h 41m per day ■ Avg State avg: 2h 39m per day · National avg: 2h 21m per day
Weekend Total Nursing Info Combined nursing hours (RN + LPN + Nurse Aide) per resident per day on weekends. Staffing often drops on weekends — this figure reveals whether the facility maintains adequate coverage outside of weekday hours. 3h 40m per day ▼ 10% State avg: 4h 5m per day · National avg: 3h 26m per day
Physical Therapist Info Hours per resident per day provided by licensed Physical Therapists (PTs) or PT Assistants. PT services help residents recover mobility after injury or illness and are especially important for post-acute (short-stay) rehabilitation. 4m per day ▼ 18% State avg: 5m per day · National avg: 4m per day
Weekend RN Info Registered nurse hours specifically on weekends. Facilities sometimes reduce RN presence on Saturdays and Sundays — a low weekend RN figure compared to weekday hours can indicate reduced clinical oversight when most administrative staff are absent. 18m per day ▼ 42% State avg: 30m per day · National avg: 29m per day

Capacity and availability

This home usually has limited availability

Higher occupancy than the California average: 84.7%
Occupancy rate
91.4% Rank #284 / 1537Occupancy rate — State benchmarkedThis home is ranked 284th out of 1537 homes in California. Shows this facility's occupancy rate versus the California average, with its Statewide rank out of 1537. Higher occupancy signals strong local demand and financial stability.Rankings are based only on facilities in California that report data for that category. Facilities without available data are excluded from the ranking.Click the rank badge to see the full State ranking.Click here to see the full State ranking.
Avg. Length of Stay
67 days
Bed community size
62-bed community Rank #1065 / 1657Bed count — State benchmarkedThis home is ranked 1065th out of 1657 homes in California. Shows this facility's certified or reported bed count compared to other California facilities. Larger communities may offer more amenities, programs, and on-site services for residents and families.Rankings are based only on facilities in California that report data for that category. Facilities without available data are excluded from the ranking.Click the rank badge to see the full State ranking.Click here to see the full State ranking.
A moderately sized community that may balance personal attention with shared amenities and social activities.
Walk Score
Walk Score: 49 / 100 Rank #1370 / 2092Walk Score — State benchmarkedThis home is ranked 1370th out of 2092 homes in California. Shows how walkable this facility's neighborhood is compared to the average Walk Score across California facilities. Higher scores benefit residents, families, and staff.Rankings are based only on facilities in California that report data for that category. Facilities without available data are excluded from the ranking.Click the rank badge to see the full State ranking.Click here to see the full State ranking.
Somewhat walkable. A few nearby services may be reachable on foot, but most trips require transportation.

About this community

License Details

Accreditations5-Star Medicare Rating

Payment & Insurance

1 service
Accept Medicare

Therapy & Rehabilitation

1 service
Rehabilitation Services

Staffing & Medical

1 service
24-Hour Staffing

Amenities & Lifestyle

Specific ProgramsNursing

Contact Sherwood Healthcare Center

Staffing Data

Reporting period: October 1 – December 31, 2025 (Q4 2025). Source: CMS Payroll-Based Journal report.

Total staff 86
Employees 81
Contractors 5
Staff to resident ratio 1.59 : 1
12% fewer staff per resident than California average
California average ratio: 1.81 : 1 California average ratio: 1.81 : 1See full California ranking
Avg staff/day 37
Average shift 7.3 hours
5% worse than California average
California average: 7.7 hours California average shift: 7.7 hoursSee full California ranking
Total staff hours (quarter) 24,743

Nursing staff breakdown

Q4 2025 · Oct 1 – Dec 31 More info This data comes from the CMS Payroll-Based Journal report covering October 1 – December 31, 2025.
Registered Nurse

Manages medical care and health needs.

RN Staff Info All 5 RN Staff are full-time employees. No contractors work on this role. 5
Average shift length Info Average shift length. Calculated as total hours divided by days worked and average staff per day. 7.4 hours
Licensed Practical Nurse

Assists with medical care and medications.

LPN Staff Info 20 total: 15 full-time employees and 5 contractors. 20
Average shift length Info Average shift length. Calculated as total hours divided by days worked and average staff per day. 7.7 hours
Certified Nursing Assistant

Helps with daily care and mobility.

CNA Staff Info All 39 CNA Staff are full-time employees. No contractors work on this role. 39
Average shift length Info Average shift length. Calculated as total hours divided by days worked and average staff per day. 7.5 hours

Contractor staffing

Q4 2025 · Oct 1 – Dec 31 More info This data comes from the CMS Payroll-Based Journal report covering October 1 – December 31, 2025.

Total hours from contractors

0.2%

43 contractor hours this quarter

Licensed Practical Nurse: 5

Staff by category

Q4 2025 · Oct 1 – Dec 31 More info This data comes from the CMS Payroll-Based Journal report covering October 1 – December 31, 2025.
Certified Nursing Assistant3903913,57492100%7.5
Licensed Practical Nurse155204,55092100%7.7
Registered Nurse5051,46992100%7.4
RN Director of Nursing2021,0086571%8
Speech Language Pathologist2028366874%7.2
Physical Therapy Assistant2025107278%5.3
Dietitian1014916368%7.8
Physical Therapy Aide2024066065%6.6
Occupational Therapy Aide1013876166%6.3
Qualified Social Worker2023816267%5.5
Respiratory Therapy Technician4043506874%3.8
Administrator1013076470%4.8
Nurse Practitioner1012403033%8
Nurse Aide in Training4042341718%6.7
39 Certified Nursing Assistant
% of Days 100%
20 Licensed Practical Nurse
% of Days 100%
5 Registered Nurse
% of Days 100%
2 RN Director of Nursing
% of Days 71%
2 Speech Language Pathologist
% of Days 74%
2 Physical Therapy Assistant
% of Days 78%
1 Dietitian
% of Days 68%
2 Physical Therapy Aide
% of Days 65%
1 Occupational Therapy Aide
% of Days 66%
2 Qualified Social Worker
% of Days 67%
4 Respiratory Therapy Technician
% of Days 74%
1 Administrator
% of Days 70%
1 Nurse Practitioner
% of Days 33%
4 Nurse Aide in Training
% of Days 18%

Penalties and fines

Federal penalties imposed by CMS for regulatory violations, including civil money penalties (fines) and denials of payment for new Medicare/Medicaid admissions.

Source: CMS Penalties Database (Data as of Jan 2026)

Total fines amount $5K Rank #215 / 362Federal fines — State benchmarkedThis home is ranked 215th out of 362 homes in California. Shows this facility's cumulative CMS federal fine dollars versus the California average among facilities with fines, and where it ranks among 362 facilities in the pool. Lower total dollars mean a better rank.Rankings are based only on facilities in California that report data for that category. Facilities without available data are excluded from the ranking.Click the rank badge to see the full State ranking.Click here to see the full State ranking.
91% lower than California average

California average: $55K

Number of fines 2
15% fewer fines than California average

California average: 2.4

Payment Denials Info Serious action where Medicare and/or Medicaid temporarily stops payments for new residents until issues are fixed. 0
100% fewer payment denials than California average

California average: 0.5

Fines amount comparison
This facility $5K
California average $55K

No penalties in the past 3 years

No civil money penalties or payment denials were reported in the last 3 years.

Quality of care over time

These measures show how residents usually do over time at this home, based on health outcomes and preventive care.

High-risk clinical events score Info A composite score based on pressure ulcers, falls with injury, weight loss, walking ability decline, and activities of daily living decline. 2.6
61% better than California average

California average: 6.6

Functional decline score Info A composite score based on activities of daily living decline, walking ability decline, and incontinence. 5.1
55% better than California average

California average: 11.3

Long-stay resident measures
Significantly above average California avg: 4.2 Info CMS star rating based on long-stay quality measure performance. 5 stars = significantly above average, 1 star = significantly below average.
Need for Help with Daily Activities Increased Info Percent of long-stay residents whose need for help with daily activities has increased 4.1%
63% better than California average

California average: 11.1%

Walking Ability Worsened Info Percent of long-stay residents whose ability to move independently worsened 5.6%
54% better than California average

California average: 12.0%

Low Risk Residents with Bowel/Bladder Incontinence Info Percent of low risk long-stay residents who lose control of their bowels or bladder 5.6%
50% better than California average

California average: 11.3%

Falls with Major Injury Info Percent of long-stay residents experiencing one or more falls with major injury 0.0%
100% better than California average

California average: 1.7%

High Risk Residents with Pressure Ulcers Info Percent of long-stay high risk residents with pressure ulcers 0.7%
86% better than California average

California average: 5.0%

Urinary Tract Infection Info Percent of long-stay residents with a urinary tract infection 1.1%
13% better than California average

California average: 1.2%

Lost Too Much Weight Info Percent of long-stay residents who lose too much weight 2.7%
36% better than California average

California average: 4.2%

Depressive Symptoms Info Percent of long-stay residents who have depressive symptoms 2.3%
65% better than California average

California average: 6.7%

Antipsychotic Use Info Percent of long-stay residents who received an antipsychotic medication 0.0%
100% better than California average

California average: 10.1%

Pneumococcal Vaccine Info Percent of long-stay residents assessed and appropriately given the pneumococcal vaccine 99.0%
In line with California average

California average: 98.5%

Influenza Vaccine Info Percent of long-stay residents assessed and appropriately given the seasonal influenza vaccine 92.6%
6% worse than California average

California average: 98.2%

Hospitalizations per 1,000 days Info Number of hospitalizations per 1,000 long-stay resident days. 2.53
12% worse than California average

California average: 2.25

ED visits per 1,000 days Info Number of outpatient emergency department visits per 1,000 long-stay resident days. 3.15
98% worse than California average

California average: 1.59

Short-stay resident measures
Above average California avg: 3.5 Info CMS star rating based on short-stay quality measure performance. 5 stars = much above average, 1 star = much below average.
Pneumococcal Vaccine Info Percent of short-stay residents assessed and appropriately given the pneumococcal vaccine 97.8%
In line with California average

California average: 94.0%

Antipsychotic medication increase Info Percent of short-stay residents who newly received an antipsychotic medication 0.0%
100% better than California average

California average: 1.5%

Influenza Vaccine Info Percent of short-stay residents assessed and appropriately given the seasonal influenza vaccine 98.0%
5% better than California average

California average: 93.2%

Re-hospitalized after SNF stay Info Percentage of short-stay residents who were re-hospitalized after their nursing home admission. 33.3%
44% worse than California average

California average: 23.2%

Emergency department visits Info Percentage of short-stay residents who had an outpatient emergency department visit. 18.0%
61% worse than California average

California average: 11.2%

Falls with major injury Info Percentage of SNF residents who experience falls with major injury during their stay. 0.6%
18% better than California average

California average: 0.8%

Ability to care for self at discharge Info Percentage of residents at or above expected ability to care for themselves at discharge. 57.6%
7% better than California average

California average: 53.7%

Successful return to home or community Info Rate of successful return to home or community from a skilled nursing facility. 54.3%
7% better than California average

California average: 50.6%

Breakdown by payment type

Medicare

36% of new residents, usually for short-term rehab.

Typical stay 1 - 2 months

Private pay

62% of new residents, often for short stays.

Typical stay 30 days

Medicaid

3% of new residents, often for long-term daily care.

Typical stay 3 years

Facility Characteristics

Source: CMS Long-Term Care Facility Characteristics (Data as of Jan 2026)

Total residents 54
Medicare
12
22.2% of residents
Medicaid
25
46.3% of residents
Private pay or other
17
31.5% of residents
Programs & Services
Residents Group

Residents meet regularly to discuss policies, care quality, and activities

Nurse Aide Training

State-approved Nurse Aide Training and Competency Evaluation Program on-site

Active Resident Council

Organized group of residents that meets regularly to discuss facility policies, quality of life, and activities.

Finances and operations

Based on CMS SNF Cost Report for fiscal year ending in 12/2023.

For-profit
Operated by a single business entity.
Net patient revenue Info Net patient revenue — what the home actually collects for resident care, after contractual allowances, bad debt and discounts are subtracted from its gross charges (CMS cost report, Worksheet G-3). It covers resident care only; money the home earns from other sources is shown separately as "Other income."
$10.3M
Net patient income Info Net patient income: net patient revenue minus the home's total operating expenses. A positive figure means it earns more from resident care than it spends to deliver it; a negative figure means the opposite. It excludes non-operating "other income."
$798.3K
For-profit Operated by a single business entity.
Net patient revenue Info Net patient revenue — what the home actually collects for resident care, after contractual allowances, bad debt and discounts are subtracted from its gross charges (CMS cost report, Worksheet G-3). It covers resident care only; money the home earns from other sources is shown separately as "Other income."
$10.3M Rank #288 / 355Revenue — State benchmarkedThis home is ranked 288th out of 355 homes in California. Shows this facility's annual revenue compared to the California average. Higher revenue generally means more resources for staffing and capital — read alongside Payroll %.Rankings are based only on facilities in California that report data for that category. Facilities without available data are excluded from the ranking.Click the rank badge to see the full State ranking.Click here to see the full State ranking.
Net patient income Info Net patient income: net patient revenue minus the home's total operating expenses. A positive figure means it earns more from resident care than it spends to deliver it; a negative figure means the opposite. It excludes non-operating "other income."
$798.3K
Other income Info Money the home earns outside of resident care — such as investments, grants, rentals and other non-operating sources (CMS cost report, Worksheet G-3). It is tracked separately from net patient revenue: it is not part of that figure, and it is not included in net patient income.
$31.7K
Payroll costs Info Staff salaries plus wage-related costs — benefits such as payroll taxes, health insurance and retirement — from the home's own accounting records (CMS cost report, Worksheet A). Contract or agency labor is counted separately, under other operating costs. Rank #268 / 355Payroll — State benchmarkedThis home is ranked 268th out of 355 homes in California. Shows total annual staff payroll benchmarked to the California average. Higher payroll investment relative to peers often signals better staffing and less reliance on cheaper contract labor.Rankings are based only on facilities in California that report data for that category. Facilities without available data are excluded from the ranking.Click the rank badge to see the full State ranking.Click here to see the full State ranking.
$5.4M 52.2% of net patient revenue Info Payroll as a share of revenue: staff salaries and wage-related benefits divided by net patient revenue. A higher figure means more of each revenue dollar goes to staff pay. Rank #79 / 355Payroll % — State benchmarkedThis home is ranked 79th out of 355 homes in California. Shows payroll as a percentage of revenue versus the California average. Well-run California facilities typically land around 55–67% — the top third Statewide. Below 25% may signal understaffing or heavy agency use — read with Staffing ratings.Rankings are based only on facilities in California that report data for that category. Facilities without available data are excluded from the ranking.Click the rank badge to see the full State ranking.Click here to see the full State ranking.
Other operating costs Info Everything it costs to run the home apart from payroll — food, utilities, supplies, maintenance, contract labor and administration. Calculated as total operating expense minus payroll (staff salaries and wage-related benefits).
$4.1M
Total costs Info The home's total operating expense for the year — all the costs of running it, salaries included (CMS cost report, Worksheet G-3).
$9.5M

What does this home offer?

Housing options icon

Housing Options: Private / Semi-private Rooms

Building type icon
Building type icon

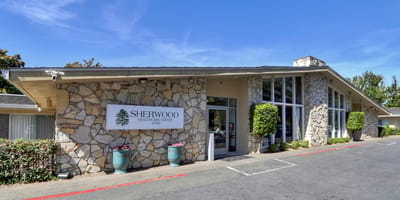
Building Type: Single-story

Recreational activities icon

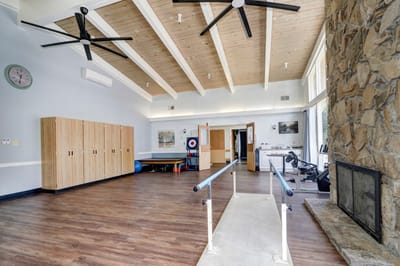
Recreational Activities

Health Programs icon

Health Programs

Who this home usually serves

TYPE OF STAY

Primarily short stays

Residents typically stay for brief periods, with frequent admissions and discharges throughout the year.

Most new residents arrive under private pay (62% of admissions), and a typical private pay stay runs around 30 days.

Admissions
307 total

Coverage residents most often arrive under.

Medicare 36%
Private pay 62%
Medicaid 3%
Discharges
309 total

Coverage residents most often leave under.

Medicare 32%
Private pay 66%
Medicaid 2%

Managed by Dustin Murray

Administrator

Places of interest near Sherwood Healthcare Center

Address 3.7 miles from city center Info Estimated distance in miles from Sacramento's city center to Sherwood Healthcare Center's address, calculated via Google Maps.

Calculate Travel Distance to Sherwood Healthcare Center

Add your location

Address

Compare Nursing Homes around Sacramento County

The information below is reported by the California Department of Social Services and Department of Public Health.

4 facilities compared · CMS & CA Dept. of Health data

University Post-Acute Rehab
NH
MC
Sacramento (Southeastern Sacramento)
59
Facility 59
CA AVG 103
Rank #1092 / 1657
87.3%
Facility 87.3%
CA AVG 84.7%
Rank #401 / 1537
+3%
3.91
Facility 3.91
CA AVG 4.22
Rank #206 / 354
+106%-7%
$0
Facility $0
CA AVG $56.5k
Rank #1 / 362
-
27
Facility 27
CA AVG 50.2
Rank #97 / 361
3.4
Facility 3.4
CA AVG 4.6
Rank #107 / 361
-56-
69
Facility 69
CA AVG 57
Rank #768 / 2092
-
$10.9M
Facility $10.9M
CA AVG $17.0M
Rank #236 / 355
$5.7M
Facility $5.7M
CA AVG $7.0M
Rank #259 / 355
51.8%
Facility 51.8%
CA AVG 45.2%
Rank #229 / 355
555265
Sherwood Healthcare Center
NH
HC
MC
RC
Sacramento (East Sacramento)
62
Facility 62
CA AVG 103
Rank #1065 / 1657
91.4%
Facility 91.4%
CA AVG 84.7%
Rank #284 / 1537
+8%
4.15
Facility 4.15
CA AVG 4.22
Rank #160 / 354
-35%-2%
$4.9k
Facility $4.9k
CA AVG $56.5k
Rank #215 / 362
-
14
Facility 14
CA AVG 50.2
Rank #20 / 361
4.7
Facility 4.7
CA AVG 4.6
Rank #224 / 361
-56-
49
Facility 49
CA AVG 57
Rank #1370 / 2092
Cypress Healthcare Group LLC
$10.3M
Facility $10.3M
CA AVG $17.0M
Rank #288 / 355
$5.4M
Facility $5.4M
CA AVG $7.0M
Rank #268 / 355
52.2%
Facility 52.2%
CA AVG 45.2%
Rank #79 / 355
55305
Gramercy Court Assisted Living and Memory Care
NH
AL
MC
Sacramento (Arden-Arcade)
120
Facility 120
CA AVG 103
Rank #561 / 1657
82.8%
Facility 82.8%
CA AVG 84.7%
Rank #618 / 1537
-2%
5.52
Facility 5.52
CA AVG 4.22
Rank #21 / 354
+109%+31%
$0
Facility $0
CA AVG $56.5k
Rank #1 / 362
-
56
Facility 56
CA AVG 50.2
Rank #255 / 361
3.0
Facility 3.0
CA AVG 4.6
Rank #65 / 361
-99-
62
Facility 62
CA AVG 57
Rank #982 / 2092
-
$19.7M
Facility $19.7M
CA AVG $17.0M
Rank #130 / 355
$10.8M
Facility $10.8M
CA AVG $7.0M
Rank #60 / 355
54.9%
Facility 54.9%
CA AVG 45.2%
Rank #63 / 355
555459
Saylor Lane Health Care Center
NH
Sacramento (East Sacramento)
42
Facility 42
CA AVG 103
Rank #1196 / 1657
90.5%
Facility 90.5%
CA AVG 84.7%
Rank #308 / 1537
+7%
4.38
Facility 4.38
CA AVG 4.22
Rank #105 / 354
-25%+4%
$4.9k
Facility $4.9k
CA AVG $56.5k
Rank #215 / 362
-
41
Facility 41
CA AVG 50.2
Rank #176 / 361
10.3
Facility 10.3
CA AVG 4.6
Rank #354 / 361
-38-
89
Facility 89
CA AVG 57
Rank #195 / 2092
-
$7.1M
Facility $7.1M
CA AVG $17.0M
Rank #327 / 355
$3.6M
Facility $3.6M
CA AVG $7.0M
Rank #317 / 355
50.7%
Facility 50.7%
CA AVG 45.2%
Rank #57 / 355
55417

Financial Assistance for
Nursing Home in California

Sherwood Healthcare Center is located in Sacramento, California.
Here are the financial assistance programs available to residents in California.

Get Financial aid guidance

Multipurpose Senior Services Program

MSSP (Medi-Cal Waiver)

Age 65+
General California resident, Medi-Cal eligible, nursing home risk.
Income Limits (2025) ~$2,829/month 300% FBR, individual
Asset Limits $2,000 (individual), $3,000 (couple).
CA

County-managed; waitlists possible.

Benefits
In-home support (4-6 hours/day) Respite care (14 days/year) Meals (~$6/meal) Transportation (8 trips/month) Care management

In-Home Supportive Services (IHSS)

California IHSS

Age 65+
General California resident, Medicaid-eligible or low-income.
Income Limits ~$1,732/month individual, Medi-Cal threshold
Asset Limits $2,000 individual
CA

Can hire family as caregivers.

Benefits
Personal care (up to 283 hours/month) Homemaker services Respite (varies)

Multipurpose Senior Services Program (MSSP)

CA MSSP

Age 65+
General California resident, Medi-Cal-eligible, nursing home-eligible but community-capable.
Income Limits ~$2,829/month 300% FBR, individual
Asset Limits $2,000 individual
CA

Available in 38 counties; waitlists common.

Benefits
Case management Respite care (up to 10 days/year) Minor home mods (avg. $500) Adult day care (~$50/day)

Property Tax Postponement Program (PTP)

CA PTP

Age 62+
General California resident, own and live in home, 40% equity.
Income Limits (2025) ~$51,500/year household, adjusted annually
Asset Limits Equity-based; no strict asset cap.
CA

Deferred taxes accrue interest (5% as of 2024); repaid upon sale/death.

Benefits
Property tax deferral (avg. $1,000-$3,000/year, varies by county)

Assisted Living Waiver (ALW)

CA ALW

Age 65+ or disabled
General California resident, Medi-Cal-eligible, nursing home-eligible.
Income Limits ~$2,829/month 300% FBR, individual
Asset Limits $2,000 individual
CA

Available in 15 counties (e.g., LA, Sacramento); waitlists common.

Benefits
Personal care in ALFs (5-7 hours/day) Medication management Social services

California CARES Program

CA CARES

Age
General Caregivers of California residents 60+ needing help with 3+ daily activities; no caregiver age limit.
Income Limits No strict limit; cost-sharing above ~$2,500/month threshold.
Asset Limits Not applicable; need-based.
CA

High demand in urban areas; complements IHSS respite.

Benefits
Respite care (up to 10 days/year) Counseling (4-6 sessions/year) Training (2-3 workshops/year) Supplies (~$200/year)

Frequently Asked Questions about Sherwood Healthcare Center

What neighborhood is Sherwood Healthcare Center in?

Sherwood Healthcare Center is in the East Sacramento neighborhood.

Is Sherwood Healthcare Center in a walkable area?

Sherwood Healthcare Center has a walk score of 49. Somewhat walkable. A few nearby services may be reachable on foot, but most trips require transportation.

What is the occupancy rate at Sherwood Healthcare Center?

Sherwood Healthcare Center's occupancy is 91.4%.

Does Sherwood Healthcare Center operate as a for-profit or non-profit?

Sherwood Healthcare Center is registered as a for-profit.

Are there photos of Sherwood Healthcare Center?

Yes — there are 9 photos of Sherwood Healthcare Center in the photo gallery on this page.

What is the address of Sherwood Healthcare Center?

Sherwood Healthcare Center is located at 4700 Elvas Ave, Sacramento, CA 95819.

What is the phone number of Sherwood Healthcare Center?

(916) 454-4700 will put you in contact with the team at Sherwood Healthcare Center.

Guides for Better Senior Living

Care Cost Calculator: See Prices in Your Area

Nursing Home Data Explorer

Don’t Wait Too Long: 7 Red Flag Signs Your Parent Needs Assisted Living Now

The True Cost of Assisted Living in 2025 – And How Families Are Paying For It

Understanding Senior Living Costs: Pricing Models, Discounts & Financial Assistance