Signature HealthCARE at Tower Road
Nursing Home & Assisted Living · Marietta, GA
CMS overall rating Info CMS (the Centers for Medicare & Medicaid Services) is the federal agency that rates nursing home quality. Its Overall Rating runs from 1 to 5 stars, combining health inspections, staffing, and quality measures, with inspections weighted most heavily.

Signature HealthCARE at Tower Road

Nursing Home & Assisted Living · Marietta, GA
CMS overall rating Info CMS (the Centers for Medicare & Medicaid Services) is the federal agency that rates nursing home quality. Its Overall Rating runs from 1 to 5 stars, combining health inspections, staffing, and quality measures, with inspections weighted most heavily.
Calculator: See prices in your area
Signature HealthCARE at Tower Road accepts Medicare, Medicaid, and private pay.

Overview of Signature Healthcare at Tower Road

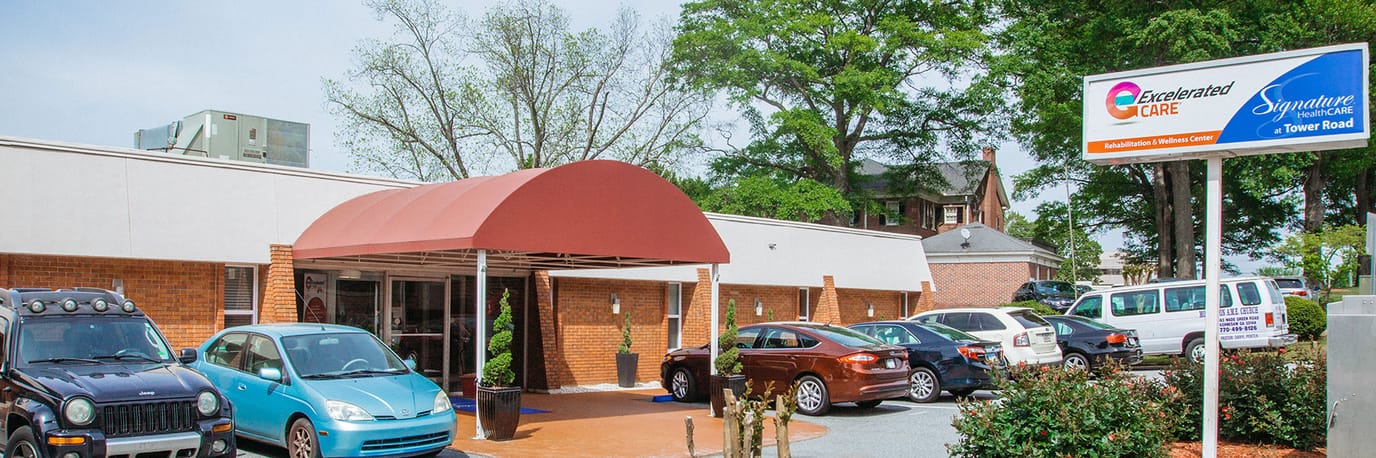
Owned by Elevation Holdings Georgia LLC, Signature Healthcare at Tower Road is a nursing home in Marietta, Georgia. The facility accepts Medicare, Medicaid, and private pay, providing multiple options for residents and families to access care.

The home mainly provides short-term rehabilitation and recovery. Most residents stay for an average of 40 days, reflecting its focus on post-acute rehabilitation after surgery, hospitalization, or other medical events. Daily nurse staffing averages 3 hours and 15 minutes per resident, combining staffing from registered nurses, nursing aides, and LPN/LVNs.

The surrounding area has a Walkability Score of 36. Some nearby services are accessible on foot, though most errands and appointments will require a short drive. This setting may suit families who value proximity to local resources and are comfortable using transportation in a typical suburban Georgia neighborhood.

(770) 422-8913

Quality ratings

Measured by Centers for Medicare & Medicaid Services (CMS)

Overall rating Info The Overall CMS Rating combines results from health inspections, staffing levels and quality measures. Health inspections carry the most weight. Staffing and quality scores can increase or decrease the final rating based on performance compared to state and national standards.
▼ 61.5% Below GA avg. ▼ 61.5% Below GA avg.GA average: 2.6Click the badge to see the full State ranking.Click here to see the full State ranking.
Health Inspection Info Based on the results of the facility's three most recent standard inspections and any complaint investigations. CMS reviews the number, scope, and severity of deficiencies, with more recent findings weighted more heavily.
▼ 28.4% Below GA avg. ▼ 28.4% Below GA avg.GA average: 2.8Click the badge to see the full State ranking.Click here to see the full State ranking.
Staffing Info Measures average nursing staff hours per resident per day, including Registered Nurses (RNs) and total nursing staff. Ratings are adjusted based on the level of care residents require and are compared to state and national benchmarks.
▼ 55.7% Below GA avg. ▼ 55.7% Below GA avg.GA average: 2.3Click the badge to see the full State ranking.Click here to see the full State ranking.
Quality Measures Info Based on clinical and physical health indicators reported to CMS, such as hospital readmissions, falls, pressure ulcers, and improvements in mobility. These measures reflect how well residents' health needs are being managed.
▲ 40.9% Above GA avg. ▲ 40.9% Above GA avg.GA average: 2.8Click the badge to see the full State ranking.Click here to see the full State ranking.

Staffing hours breakdown

Info Daily nursing hours per resident by staff type, reported to CMS. Higher is generally better — compare this facility to state and national averages to see where staffing stands.

Hours per resident per day — compared to Georgia state averages

Total nursing care / resident Info This home is ranked 103rd out of 202 homes in Georgia for nurse hours. Total adjusted nursing hours per resident per day, combining RN, LPN, and aide time. CMS adjusts this for case-mix so facilities can be fairly compared.
3h 15m per day
Rank #103 / 202Nurse hours — State benchmarkedThis home is ranked 103rd out of 202 homes in Georgia. Shows adjusted nurse hours per resident per day benchmarked to the Georgia average, with a ranking across 202 Georgia facilities. More hours mean more direct care. The national average is about 3.5 hrs; below 3.0 is a red flag.Ranking totals vary by category as each rank only includes facilities that report data for that metric. Homes missing that data point aren't included in the ranking.Click the rank badge to see the full State ranking.Click here to see the full State ranking.
This facility Georgia avg (3h 33m per day)
vs Georgia avg
-8%

3 of 6 metrics below state avg

Standout metric Physical Therapist is +65% above state avg
Staff typeHours / Day / Residentvs state avg
Registered Nurse (RN) Info RNs hold the highest nursing license and can assess residents, interpret test results, and direct care plans. More RN hours per day often signals stronger clinical oversight and faster response to health changes. 17m per day ▼ 44% State avg: 30m per day · National avg: 41m per day
LPN / LVN Info Licensed Practical Nurses (LPNs) or Licensed Vocational Nurses (LVNs) deliver routine hands-on care — medication administration, wound dressing, and monitoring vital signs. They work under RN supervision and make up a large share of daily bedside care. 1h 25m per day ▲ 51% State avg: 56m per day · National avg: 52m per day
Nurse Aide Info Certified Nurse Aides (CNAs) provide the most direct day-to-day assistance: bathing, dressing, feeding, and mobility. Nurse aide hours are typically the largest staffing category and directly affect residents' quality of life. 1h 51m per day ▼ 14% State avg: 2h 9m per day · National avg: 2h 21m per day
Weekend Total Nursing Info Combined nursing hours (RN + LPN + Nurse Aide) per resident per day on weekends. Staffing often drops on weekends — this figure reveals whether the facility maintains adequate coverage outside of weekday hours. 3h 4m per day ■ Avg State avg: 3h 6m per day · National avg: 3h 26m per day
Physical Therapist Info Hours per resident per day provided by licensed Physical Therapists (PTs) or PT Assistants. PT services help residents recover mobility after injury or illness and are especially important for post-acute (short-stay) rehabilitation. 5m per day ▲ 65% State avg: 3m per day · National avg: 4m per day
Weekend RN Info Registered nurse hours specifically on weekends. Facilities sometimes reduce RN presence on Saturdays and Sundays — a low weekend RN figure compared to weekday hours can indicate reduced clinical oversight when most administrative staff are absent. 13m per day ▼ 36% State avg: 20m per day · National avg: 29m per day

Capacity and availability

This home usually has availability

Higher occupancy than the Georgia average: 78.1%
Occupancy rate
79.8% Rank #134 / 325Occupancy rate — State benchmarkedThis home is ranked 134th out of 325 homes in Georgia. Shows this facility's occupancy rate versus the Georgia average, with its Statewide rank out of 325. Higher occupancy signals strong local demand and financial stability.Ranking totals vary by category as each rank only includes facilities that report data for that metric. Homes missing that data point aren't included in the ranking.Click the rank badge to see the full State ranking.Click here to see the full State ranking.
Avg. Length of Stay
40 days
Bed community size
138-bed community Rank #85 / 672Bed count — State benchmarkedThis home is ranked 85th out of 672 homes in Georgia. Shows this facility's certified or reported bed count compared to other Georgia facilities. Larger communities may offer more amenities, programs, and on-site services for residents and families.Ranking totals vary by category as each rank only includes facilities that report data for that metric. Homes missing that data point aren't included in the ranking.Click the rank badge to see the full State ranking.Click here to see the full State ranking.
A larger shared setting that may offer more common spaces and organized community services.
Walk Score
Walk Score: 36 / 100 Rank #481 / 873Walk Score — State benchmarkedThis home is ranked 481st out of 873 homes in Georgia. Shows how walkable this facility's neighborhood is compared to the average Walk Score across Georgia facilities. Higher scores benefit residents, families, and staff.Ranking totals vary by category as each rank only includes facilities that report data for that metric. Homes missing that data point aren't included in the ranking.Click the rank badge to see the full State ranking.Click here to see the full State ranking.
Somewhat walkable. A few nearby services may be reachable on foot, but most trips require transportation.

About this community

Contact Signature HealthCARE at Tower Road

Staffing Data

Reporting period: October 1 – December 31, 2025 (Q4 2025). Source: CMS Payroll-Based Journal report.

Total staff 142
Employees 135
Contractors 7
Staff to resident ratio 1.15 : 1
19% fewer staff per resident than Georgia average
Georgia average ratio: 1.42 : 1 Georgia average ratio: 1.42 : 1See full Georgia ranking
Avg staff/day 59
Average shift 8.2 hours
0% compared with Georgia average
Georgia average: 8.3 hours Georgia average shift: 8.3 hoursSee full Georgia ranking
Total staff hours (quarter) 44,322

Nursing staff breakdown

Q4 2025 · Oct 1 – Dec 31 More info This data comes from the CMS Payroll-Based Journal report covering October 1 – December 31, 2025.
Registered Nurse

Manages medical care and health needs.

RN Staff Info All 7 RN Staff are full-time employees. No contractors work on this role. 7
Average shift length Info Average shift length. Calculated as total hours divided by days worked and average staff per day. 9 hours
Licensed Practical Nurse

Assists with medical care and medications.

LPN Staff Info All 29 LPN Staff are full-time employees. No contractors work on this role. 29
Average shift length Info Average shift length. Calculated as total hours divided by days worked and average staff per day. 10.1 hours
Certified Nursing Assistant

Helps with daily care and mobility.

CNA Staff Info All 56 CNA Staff are full-time employees. No contractors work on this role. 56
Average shift length Info Average shift length. Calculated as total hours divided by days worked and average staff per day. 7.6 hours

Contractor staffing

Q4 2025 · Oct 1 – Dec 31 More info This data comes from the CMS Payroll-Based Journal report covering October 1 – December 31, 2025.

Total hours from contractors

0.7%

308 contractor hours this quarter

Medical Director: 4 Feeding Assistant: 2 Occupational Therapy Aide: 1

Staff by category

Q4 2025 · Oct 1 – Dec 31 More info This data comes from the CMS Payroll-Based Journal report covering October 1 – December 31, 2025.
Certified Nursing Assistant5605618,94492100%7.6
Licensed Practical Nurse2902912,41992100%10.1
RN Director of Nursing6062,0717076%8.9
Registered Nurse7071,7018693%9
Physical Therapy Assistant5051,0446975%6.8
Dental Services Staff2028986267%7.8
Qualified Activities Professional5058958087%10.2
Respiratory Therapy Technician5058478188%5.4
Qualified Social Worker4047567986%7.1
Clinical Nurse Specialist4046416470%7.7
Physical Therapy Aide3036197177%6.4
Speech Language Pathologist4046177480%6.7
Other Dietary Services Staff1015646571%8.7
Administrator1015206571%8
Nurse Practitioner1015206571%8
Dietitian1014906166%8
Mental Health Service Worker1014676166%7.7
Occupational Therapy Aide0112324145%5.7
Medical Director044391617%2.2
Feeding Assistant022371617%2.2
56 Certified Nursing Assistant
% of Days 100%
29 Licensed Practical Nurse
% of Days 100%
6 RN Director of Nursing
% of Days 76%
7 Registered Nurse
% of Days 93%
5 Physical Therapy Assistant
% of Days 75%
2 Dental Services Staff
% of Days 67%
5 Qualified Activities Professional
% of Days 87%
5 Respiratory Therapy Technician
% of Days 88%
4 Qualified Social Worker
% of Days 86%
4 Clinical Nurse Specialist
% of Days 70%
3 Physical Therapy Aide
% of Days 77%
4 Speech Language Pathologist
% of Days 80%
1 Other Dietary Services Staff
% of Days 71%
1 Administrator
% of Days 71%
1 Nurse Practitioner
% of Days 71%
1 Dietitian
% of Days 66%
1 Mental Health Service Worker
% of Days 66%
1 Occupational Therapy Aide
% of Days 45%
4 Medical Director
% of Days 17%
2 Feeding Assistant
% of Days 17%

Penalties and fines

Federal penalties imposed by CMS for regulatory violations, including civil money penalties (fines) and denials of payment for new Medicare/Medicaid admissions.

Source: CMS Penalties Database (Data as of Jan 2026)

Total fines amount $16K Rank #1 / 204Federal fines — State benchmarkedThis home is ranked 1st out of 204 homes in Georgia. Shows this facility's cumulative CMS federal fine dollars versus the Georgia average among facilities with fines, and where it ranks among 204 facilities in the pool. Lower total dollars mean a better rank.Ranking totals vary by category as each rank only includes facilities that report data for that metric. Homes missing that data point aren't included in the ranking.Click the rank badge to see the full State ranking.Click here to see the full State ranking.
61% lower than Georgia average

Georgia average: $40K

Number of fines 1
51% fewer fines than Georgia average

Georgia average: 2.1

Payment Denials Info Serious action where Medicare and/or Medicaid temporarily stops payments for new residents until issues are fixed. 0
100% fewer payment denials than Georgia average

Georgia average: 0.3

Fines amount comparison
This facility $16K
Georgia average $40K

No penalties in the past 3 years

No civil money penalties or payment denials were reported in the last 3 years.

Quality of care over time

These measures show how residents usually do over time at this home, based on health outcomes and preventive care.

High-risk clinical events score Info A composite score based on pressure ulcers, falls with injury, weight loss, walking ability decline, and activities of daily living decline. 14.9
45% worse than Georgia average

Georgia average: 10.3

Functional decline score Info A composite score based on activities of daily living decline, walking ability decline, and incontinence. 27.9
61% worse than Georgia average

Georgia average: 17.4

Long-stay resident measures
Above average Info CMS star rating based on long-stay quality measure performance. 5 stars = significantly above average, 1 star = significantly below average.
Need for Help with Daily Activities Increased Info Percent of long-stay residents whose need for help with daily activities has increased 26.0%
54% worse than Georgia average

Georgia average: 16.8%

Walking Ability Worsened Info Percent of long-stay residents whose ability to move independently worsened 35.2%
81% worse than Georgia average

Georgia average: 19.4%

Low Risk Residents with Bowel/Bladder Incontinence Info Percent of low risk long-stay residents who lose control of their bowels or bladder 22.6%
41% worse than Georgia average

Georgia average: 16.1%

Falls with Major Injury Info Percent of long-stay residents experiencing one or more falls with major injury 2.6%
17% better than Georgia average

Georgia average: 3.2%

High Risk Residents with Pressure Ulcers Info Percent of long-stay high risk residents with pressure ulcers 5.6%
11% better than Georgia average

Georgia average: 6.3%

Urinary Tract Infection Info Percent of long-stay residents with a urinary tract infection 1.9%
26% better than Georgia average

Georgia average: 2.5%

Lost Too Much Weight Info Percent of long-stay residents who lose too much weight 4.9%
19% better than Georgia average

Georgia average: 6.0%

Depressive Symptoms Info Percent of long-stay residents who have depressive symptoms 3.2%
63% better than Georgia average

Georgia average: 8.7%

Antipsychotic Use Info Percent of long-stay residents who received an antipsychotic medication 4.0%
79% better than Georgia average

Georgia average: 19.1%

Pneumococcal Vaccine Info Percent of long-stay residents assessed and appropriately given the pneumococcal vaccine 88.3%
In line with Georgia average

Georgia average: 91.5%

Influenza Vaccine Info Percent of long-stay residents assessed and appropriately given the seasonal influenza vaccine 62.8%
34% worse than Georgia average

Georgia average: 95.0%

Hospitalizations per 1,000 days Info Number of hospitalizations per 1,000 long-stay resident days. 1.53
30% better than Georgia average

Georgia average: 2.18

ED visits per 1,000 days Info Number of outpatient emergency department visits per 1,000 long-stay resident days. 0.61
69% better than Georgia average

Georgia average: 1.97

Short-stay resident measures
Above average Info CMS star rating based on short-stay quality measure performance. 5 stars = much above average, 1 star = much below average.
Pneumococcal Vaccine Info Percent of short-stay residents assessed and appropriately given the pneumococcal vaccine 83.1%
In line with Georgia average

Georgia average: 80.6%

Antipsychotic medication increase Info Percent of short-stay residents who newly received an antipsychotic medication 1.7%
25% better than Georgia average

Georgia average: 2.2%

Influenza Vaccine Info Percent of short-stay residents assessed and appropriately given the seasonal influenza vaccine 61.9%
21% worse than Georgia average

Georgia average: 78.2%

Re-hospitalized after SNF stay Info Percentage of short-stay residents who were re-hospitalized after their nursing home admission. 23.2%
In line with Georgia average

Georgia average: 24.2%

Emergency department visits Info Percentage of short-stay residents who had an outpatient emergency department visit. 5.4%
56% better than Georgia average

Georgia average: 12.2%

Falls with major injury Info Percentage of SNF residents who experience falls with major injury during their stay. 0.8%
5% worse than Georgia average

Georgia average: 0.8%

Ability to care for self at discharge Info Percentage of residents at or above expected ability to care for themselves at discharge. 47.2%
12% worse than Georgia average

Georgia average: 53.7%

Successful return to home or community Info Rate of successful return to home or community from a skilled nursing facility. 61.2%
21% better than Georgia average

Georgia average: 50.6%

Breakdown by payment type

Medicare

33% of new residents, usually for short-term rehab.

Typical stay 21 days

Private pay

58% of new residents, often for short stays.

Typical stay 22 days

Medicaid

9% of new residents, often for long-term daily care.

Typical stay 7 - 8 months

Facility Characteristics

Source: CMS Long-Term Care Facility Characteristics (Data as of Jan 2026)

Total residents 123
Medicare
25
20.3% of residents
Medicaid
70
56.9% of residents
Private pay or other
28
22.8% of residents
Programs & Services
Residents Group

Residents meet regularly to discuss policies, care quality, and activities

Active Resident Council

Organized group of residents that meets regularly to discuss facility policies, quality of life, and activities.

Finances and operations

Based on CMS SNF Cost Report for fiscal year ending in 01/2024.

Privately-owned community
Operated by a single business entity.
Net patient revenue Info Net patient revenue — what the home actually collects for resident care, after contractual allowances, bad debt and discounts are subtracted from its gross charges (CMS cost report, Worksheet G-3). It covers resident care only; money the home earns from other sources is shown separately as "Other income."
$15.7M
Net patient income Info Net patient income: net patient revenue minus the home's total operating expenses. A positive figure means it earns more from resident care than it spends to deliver it; a negative figure means the opposite. It excludes non-operating "other income."
-$3.4M
Privately-owned community Operated by a single business entity.
Net patient revenue Info Net patient revenue — what the home actually collects for resident care, after contractual allowances, bad debt and discounts are subtracted from its gross charges (CMS cost report, Worksheet G-3). It covers resident care only; money the home earns from other sources is shown separately as "Other income."
$15.7M Rank #15 / 197Revenue — State benchmarkedThis home is ranked 15th out of 197 homes in Georgia. Shows this facility's annual revenue compared to the Georgia average. Higher revenue generally means more resources for staffing and capital — read alongside Payroll %.Ranking totals vary by category as each rank only includes facilities that report data for that metric. Homes missing that data point aren't included in the ranking.Click the rank badge to see the full State ranking.Click here to see the full State ranking.
Net patient income Info Net patient income: net patient revenue minus the home's total operating expenses. A positive figure means it earns more from resident care than it spends to deliver it; a negative figure means the opposite. It excludes non-operating "other income."
-$3.4M
Other income Info Money the home earns outside of resident care — such as investments, grants, rentals and other non-operating sources (CMS cost report, Worksheet G-3). It is tracked separately from net patient revenue: it is not part of that figure, and it is not included in net patient income.
$132.3K
Payroll costs Info Staff salaries plus wage-related costs — benefits such as payroll taxes, health insurance and retirement — from the home's own accounting records (CMS cost report, Worksheet A). Contract or agency labor is counted separately, under other operating costs. Rank #32 / 197Payroll — State benchmarkedThis home is ranked 32nd out of 197 homes in Georgia. Shows total annual staff payroll benchmarked to the Georgia average. Higher payroll investment relative to peers often signals better staffing and less reliance on cheaper contract labor.Ranking totals vary by category as each rank only includes facilities that report data for that metric. Homes missing that data point aren't included in the ranking.Click the rank badge to see the full State ranking.Click here to see the full State ranking.
$7.6M 48.7% of net patient revenue Info Payroll as a share of revenue: staff salaries and wage-related benefits divided by net patient revenue. A higher figure means more of each revenue dollar goes to staff pay. Rank #174 / 197Payroll % — State benchmarkedThis home is ranked 174th out of 197 homes in Georgia. Shows payroll as a percentage of revenue versus the Georgia average. Well-run Georgia facilities typically land around 51–61% — the top third Statewide. Below 25% may signal understaffing or heavy agency use — read with Staffing ratings.Ranking totals vary by category as each rank only includes facilities that report data for that metric. Homes missing that data point aren't included in the ranking.Click the rank badge to see the full State ranking.Click here to see the full State ranking.
Other operating costs Info Everything it costs to run the home apart from payroll — food, utilities, supplies, maintenance, contract labor and administration. Calculated as total operating expense minus payroll (staff salaries and wage-related benefits).
$11.4M
Total costs Info The home's total operating expense for the year — all the costs of running it, salaries included (CMS cost report, Worksheet G-3).
$19.0M

Who this home usually serves

TYPE OF STAY

Mix of rehab and long-term care

This home supports both short-term rehab and long-term care, with residents staying for a wide range of durations.

Most new residents arrive under private pay (58% of admissions), and a typical private pay stay runs around 22 days.

Admissions
1,055 total

Coverage residents most often arrive under.

Medicare 33%
Private pay 58%
Medicaid 9%
Discharges
1,080 total

Coverage residents most often leave under.

Medicare 27%
Private pay 58%
Medicaid 15%

Compare Nursing Home around Marietta

The information below is reported by the Georgia Department of Community Health, Healthcare Facility Regulation Division.

5 facilities compared · CMS & GA Dept. of Health data

Autumn Breeze Healthcare Center
NH
AL
IL
MC
Marietta
109
Facility 109
GA AVG 88
Rank #167 / 672
43.1%
Facility 43.1%
GA AVG 78.1%
Rank #260 / 325
-45%
2.82
Facility 2.82
GA AVG 3.56
Rank #173 / 202
-63%-21%
$0
Facility $0
GA AVG $38.9k
Rank #1 / 204
11
Facility 11
GA AVG 16.6
Rank #62 / 203
3.7
Facility 3.7
GA AVG 4.7
Rank #69 / 203
547-
29
Facility 29
GA AVG 39
Rank #548 / 873
Ronald Gooden
$7.3M
Facility $7.3M
GA AVG $15.7M
Rank #147 / 197
$5.0M
Facility $5.0M
GA AVG $4.3M
Rank #112 / 197
68.3%
Facility 68.3%
GA AVG 42.6%
Rank #26 / 197
115580
East Cobb Center for Nursing and Healing
NH
HC
PC
Marietta
117
Facility 117
GA AVG 88
Rank #138 / 672
93.2%
Facility 93.2%
GA AVG 78.1%
Rank #43 / 325
+19%
3.36
Facility 3.36
GA AVG 3.56
Rank #91 / 202
+12%-6%
$0
Facility $0
GA AVG $38.9k
Rank #1 / 204
11
Facility 11
GA AVG 16.6
Rank #62 / 203
3.7
Facility 3.7
GA AVG 4.7
Rank #69 / 203
-108-
63
Facility 63
GA AVG 39
Rank #168 / 873
Linda Karling Lott
$16.5M
Facility $16.5M
GA AVG $15.7M
Rank #45 / 197
$8.0M
Facility $8.0M
GA AVG $4.3M
Rank #37 / 197
48.6%
Facility 48.6%
GA AVG 42.6%
Rank #113 / 197
115283
Signature HealthCARE at Tower Road
NH
AL
Marietta
138
Facility 138
GA AVG 88
Rank #85 / 672
79.8%
Facility 79.8%
GA AVG 78.1%
Rank #134 / 325
+2%
3.26
Facility 3.26
GA AVG 3.56
Rank #103 / 202
-44%-8%
$0
Facility $0
GA AVG $38.9k
Rank #1 / 204
33
Facility 33
GA AVG 16.6
Rank #185 / 203
6.6
Facility 6.6
GA AVG 4.7
Rank #162 / 203
3112-
36
Facility 36
GA AVG 39
Rank #481 / 873
Elevation Holdings Georgia LLC
$15.7M
Facility $15.7M
GA AVG $15.7M
Rank #15 / 197
$7.6M
Facility $7.6M
GA AVG $4.3M
Rank #32 / 197
48.7%
Facility 48.7%
GA AVG 42.6%
Rank #174 / 197
115115
Marietta Center for Nursing and Healing
NH
HC
NC
PC
RC
Marietta (Northwest Marietta Historic District)
154
Facility 154
GA AVG 88
Rank #65 / 672
80.5%
Facility 80.5%
GA AVG 78.1%
Rank #131 / 325
+3%
2.96
Facility 2.96
GA AVG 3.56
Rank #151 / 202
-5%-17%
$7.9k
Facility $7.9k
GA AVG $38.9k
Rank #139 / 204
32
Facility 32
GA AVG 16.6
Rank #179 / 203
6.4
Facility 6.4
GA AVG 4.7
Rank #155 / 203
3131-
11
Facility 11
GA AVG 39
Rank #722 / 873
Kristine Aibangbee
$15.9M
Facility $15.9M
GA AVG $15.7M
Rank #51 / 197
$6.7M
Facility $6.7M
GA AVG $4.3M
Rank #62 / 197
42.3%
Facility 42.3%
GA AVG 42.6%
Rank #151 / 197
115206
Roselane Health Center by Harborview
NH
MC
Marietta
137
Facility 137
GA AVG 88
Rank #87 / 672
89.8%
Facility 89.8%
GA AVG 78.1%
Rank #64 / 325
+15%
2.85
Facility 2.85
GA AVG 3.56
Rank #173 / 202
+18%-20%
$86.2k
Facility $86.2k
GA AVG $38.9k
Rank #191 / 204
20
Facility 20
GA AVG 16.6
Rank #132 / 203
5.0
Facility 5.0
GA AVG 4.7
Rank #113 / 203
4123A+
65
Facility 65
GA AVG 39
Rank #148 / 873
Juliet D'alessandro
$14.0M
Facility $14.0M
GA AVG $15.7M
Rank #59 / 197
$7.2M
Facility $7.2M
GA AVG $4.3M
Rank #53 / 197
51.4%
Facility 51.4%
GA AVG 42.6%
Rank #106 / 197
115660

Financial Assistance for
Nursing Home in Georgia

Signature HealthCARE at Tower Road is located in Marietta, Georgia.
Here are the financial assistance programs available to residents in Georgia.

Get Financial aid guidance

Community Care Services Program

Georgia Medicaid CCSP

Age 65+ or disabled
General Georgia resident, Medicaid-eligible, nursing home-level care need.
Income Limits (2025) ~$2,829/month 300% FBR, individual
Asset Limits $2,000 (individual), $3,000 (couple).
GA

High rural demand; waitlists possible.

Benefits
Personal care (5-7 hours/day) Adult day care (~$75/day) Respite (240 hours/year) Meals

Respite Care Program

Georgia NFCSP Respite

Age Caregiver of someone 60+ (or with dementia)
General Georgia resident.
Income Limits No strict limit; prioritizes low-income.
Asset Limits Not applicable.
GA

Focus on metro and rural balance.

Benefits
In-home aide (4-6 hours/day) Adult day care (~$75/day) Facility stay (up to 5 days)

Home and Community Services (HCS)

Georgia Home and Community Services (Non-Medicaid)

Age 60+
General Georgia resident, functionally impaired, at risk of nursing home placement.
Income Limits (2025) No strict limit; prioritizes ~$41,000/year; cost-sharing for higher incomes.
Asset Limits Not specified; need-based.
GA

Non-Medicaid; AAA-managed.

Benefits
Personal care (4-6 hours/day) Homemaker Adult day care ($80/day) Respite (~5 days/year)

Medicare Savings Program (MSP)

Georgia Medicare Savings Program

Age 65+ or disabled
General Georgia resident, Medicare Part A/B.
Income Limits (2025) ~$2,510/month (QMB), ~$3,380/month (SLMB), ~$3,598/month (QI).
Asset Limits $9,430 (individual), $14,130 (couple).
GA

Three tiers; entitlement benefit.

Benefits
Covers Part B premiums ($174.70/month) Deductibles ($240/year) Copays (~20%)

Program of All-Inclusive Care for the Elderly (PACE)

Georgia Medicaid PACE

Age 55+
General Georgia resident, nursing home-level care need, safe with PACE support.
Income Limits (2025) ~$2,829/month 300% FBR
Asset Limits $2,000 (individual), $3,000 (couple).
GA

Limited areas (e.g., Macon, Augusta).

Benefits
Personal care (5-7 hours/day) Medical care Meals Transportation Therapy

SOURCE (Service Options Using Resources in a Community Environment)

Georgia Medicaid SOURCE Program

Age 65+ or disabled
General Georgia resident, Medicaid-eligible, frail but not necessarily nursing home-level.
Income Limits (2025) ~$914/month (SSI level); QIT allowed.
Asset Limits $2,000 (individual), $3,000 (couple).
GA

Enhanced primary care model; statewide via 12 sites.

Benefits
Personal care (4-6 hours/day) Case management Adult day health ($80/day) Respite (limited)

Optional State Supplementation (OSS)

Georgia Optional State Supplementation

Age 65+ or disabled
General Georgia resident, in approved facility, low-income/SSI recipient.
Income Limits (2025) ~$1,004/month including SSI
Asset Limits $2,000 (individual), $3,000 (couple).
GA

~$20-$489/month based on facility type.

Benefits
Cash (~$20-$489/month) for room/board in personal care homes

Frequently Asked Questions about Signature HealthCARE at Tower Road

Is Signature HealthCARE at Tower Road in a walkable area?

Signature HealthCARE at Tower Road has a walk score of 36. Somewhat walkable. A few nearby services may be reachable on foot, but most trips require transportation.

What is the occupancy rate at Signature HealthCARE at Tower Road?

Signature HealthCARE at Tower Road's occupancy is 79.8%.

Are there photos of Signature HealthCARE at Tower Road?

Yes — there is 1 photo of Signature HealthCARE at Tower Road in the photo gallery on this page.

What is the phone number of Signature HealthCARE at Tower Road?

(770) 422-8913 will put you in contact with the team at Signature HealthCARE at Tower Road.

Is Signature HealthCARE at Tower Road Medicare or Medicaid certified?

Yes — Signature HealthCARE at Tower Road is a CMS-certified provider of Medicare and Medicaid.

Guides for Better Senior Living

Care Cost Calculator: See Prices in Your Area

Nursing Home Data Explorer

Don’t Wait Too Long: 7 Red Flag Signs Your Parent Needs Assisted Living Now

The True Cost of Assisted Living in 2025 – And How Families Are Paying For It

Understanding Senior Living Costs: Pricing Models, Discounts & Financial Assistance