


Total staff
191
Employees
191
Contractors
0
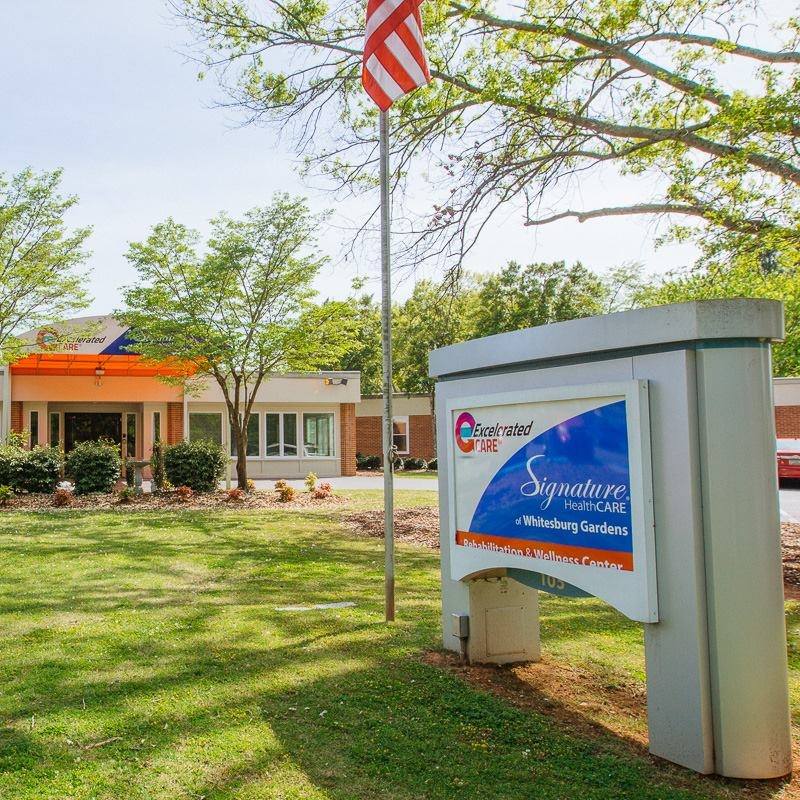
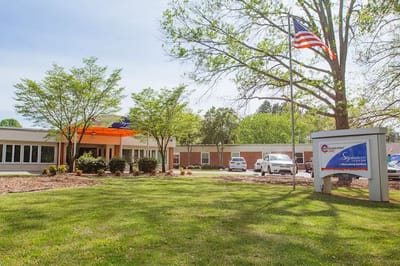

Signature HealthCARE of Whitesburg Gardens is a haven in Huntsville, Alabama, dedicated to elevating the lives of seniors with a comprehensive range of services and high-quality living. This family-based organization offers top-notch rehab services, clinical care, and life-enriching opportunities. With a transparent and open commitment to meeting nursing home requirements, Signature HealthCARE of Whitesburg Gardens ensures that residents and their loved ones can have peace of mind, knowing they are choosing a place that not only exceeds expectations but surpasses industry standards.
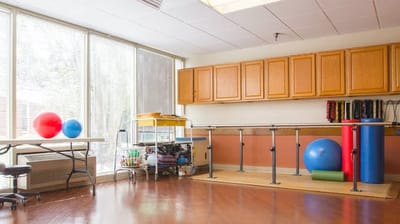
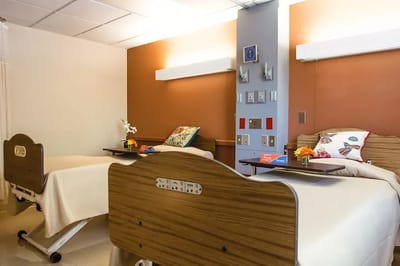
Residents enjoy access to an array of amenities, including a beauty salon, full-time respiratory therapist, 24-hour pharmacy, and Center-wide Wi-Fi. To enhance their experience, bedside phones, and laptops are also available. At Signature HealthCARE of Whitesburg Gardens, seniors find not just a place to reside but a place to call home, where their well-being and quality of life are at the heart of everything they do.
Staffing hours
![]() Daily nursing hours per resident by staff type, reported to CMS. Higher is generally better — compare this facility to state and national averages to see where staffing stands.
Daily nursing hours per resident by staff type, reported to CMS. Higher is generally better — compare this facility to state and national averages to see where staffing stands.
Hours per resident per day vs Alabama averages
Total nursing care
![]() This home is ranked 47th out of 124 homes in Alabama for nurse hours. Total adjusted nursing hours per resident per day, combining RN, LPN, and aide time. CMS adjusts this for case-mix so facilities can be fairly compared.
This home is ranked 47th out of 124 homes in Alabama for nurse hours. Total adjusted nursing hours per resident per day, combining RN, LPN, and aide time. CMS adjusts this for case-mix so facilities can be fairly compared.
4h 34m
4% above state avg2 of 6 metrics below state avg
Reporting period: October 1 – December 31, 2025 (Q4 2025). Source: CMS Payroll-Based Journal report.
Manages medical care and health needs.
Assists with medical care and medications.
Helps with daily care and mobility.
| Certified Nursing Assistant | 85 | 0 | 85 | 25,080 | 92 | 100% | 7.3 |
| Registered Nurse | 27 | 0 | 27 | 9,126 | 92 | 100% | 9.6 |
| Clinical Nurse Specialist | 13 | 0 | 13 | 5,088 | 92 | 100% | 8.3 |
| Licensed Practical Nurse | 14 | 0 | 14 | 3,838 | 92 | 100% | 8.7 |
| RN Director of Nursing | 5 | 0 | 5 | 2,020 | 78 | 85% | 8.5 |
| Therapeutic Recreation Specialist | 7 | 0 | 7 | 1,169 | 72 | 78% | 6.5 |
| Respiratory Therapist | 5 | 0 | 5 | 1,105 | 72 | 78% | 7.2 |
| Qualified Social Worker | 8 | 0 | 8 | 953 | 81 | 88% | 5.6 |
| Medication Aide/Technician | 4 | 0 | 4 | 925 | 80 | 87% | 7.6 |
| Respiratory Therapy Technician | 8 | 0 | 8 | 819 | 76 | 83% | 5.7 |
| Physical Therapy Assistant | 7 | 0 | 7 | 737 | 76 | 83% | 5.5 |
| Nurse Practitioner | 3 | 0 | 3 | 524 | 61 | 66% | 8 |
| Dietitian | 1 | 0 | 1 | 483 | 63 | 68% | 7.7 |
| Administrator | 1 | 0 | 1 | 480 | 60 | 65% | 8 |
| Mental Health Service Worker | 1 | 0 | 1 | 472 | 59 | 64% | 8 |
| Dental Services Staff | 1 | 0 | 1 | 430 | 56 | 61% | 7.7 |
| Other Dietary Services Staff | 1 | 0 | 1 | 370 | 60 | 65% | 6.2 |
Federal penalties imposed by CMS for regulatory violations, including civil money penalties (fines) and denials of payment for new Medicare/Medicaid admissions.
Source: CMS Penalties Database (Data as of Jan 2026)
Alabama average: $65K
Alabama average: 2.4
Alabama average: 0.3
No penalties in the past 3 years
No civil money penalties or payment denials were reported in the last 3 years.
These measures show how residents usually do over time at this home, based on health outcomes and preventive care.
Alabama average: 8.9
Alabama average: 14.5
Alabama average: 13.9%
Alabama average: 16.1%
Alabama average: 13.6%
Alabama average: 3.4%
Alabama average: 5.9%
Alabama average: 2.7%
Alabama average: 5.4%
Alabama average: 1.2%
Alabama average: 20.7%
Alabama average: 91.5%
Alabama average: 94.8%
Alabama average: 2.00
Alabama average: 1.79
Alabama average: 83.7%
Alabama average: 2.1%
Alabama average: 80.3%
Alabama average: 24.5%
Alabama average: 11.5%
Alabama average: 0.8%
Alabama average: 53.7%
Alabama average: 50.6%
Quality measures are calculated from Minimum Data Set (MDS) assessments. For most measures, lower percentages indicate better care quality.
33% of new residents, usually for short-term rehab.
59% of new residents, often for short stays.
8% of new residents, often for long-term daily care.
Source: CMS Long-Term Care Facility Characteristics (Data as of Jan 2026)
Residents meet regularly to discuss policies, care quality, and activities
Organized group of residents that meets regularly to discuss facility policies, quality of life, and activities.
Data sourced from CMS Long-Term Care Facility Characteristics quarterly report. Payer mix reflects the current resident census by primary payment source.
Historical financial and operational data for Signature HealthCARE of Whitesburg Gardens from 2012–2023, based on CMS SNF Cost Reports.
Key figures below are for fiscal year ending in 12/2023.
Based on CMS SNF Cost Report for fiscal year ending in 12/2023.
This home supports both short-term rehab and long-term care, with residents staying for a wide range of durations.
Most new residents arrive under private pay (59% of admissions), and a typical private pay stay runs around 1 - 2 months.
Coverage residents most often arrive under.
Coverage residents most often leave under.
![]() 2.4 miles from city center
2.4 miles from city center
![]() Estimated distance in miles from Huntsville's city center to Signature HealthCARE of Whitesburg Gardens's address, calculated via Google Maps.
Estimated distance in miles from Huntsville's city center to Signature HealthCARE of Whitesburg Gardens's address, calculated via Google Maps.
Add your location
Info below is compiled from CMS reports & the AL Dept. of Public Health (ADPH), senior community websites & trusted data sources such as Walk Score & BBB.
Communities are listed from highest to lowest based on our ranking methodology.
| Redstone Village | NH AL IL MC SNF | Huntsville (Redstone Village) | 56
Facility
56
AL AVG
90
Rank
#165 / 241 |
41.1%
Facility
41.1%
AL AVG
78.5
Rank
#99 / 107 | -48% | 5.19
Facility
5.19
AL AVG
4.37
Rank
#10 / 124 | -34% | +19% | $0
Facility
$0
AL AVG
$59.8k
Rank
#1 / 125 | 3
Facility
3
AL AVG
10.4
Rank
#5 / 124 | 1.5
Facility
1.5
AL AVG
3.5
Rank
#12 / 124 | - | 23 | - |
17
Facility
17
AL AVG
39
Rank
#312 / 382 | Redstone Military Retirement Residence Association Inc | $22.8MFiscal year ending 12/2023
Facility
$22.8MFiscal year ending 12/2023
AL AVG
$11.3M
Rank
#3 / 108 | $10.0MFiscal year ending 12/2023
Facility
$10.0MFiscal year ending 12/2023
AL AVG
$5.8M
Rank
#6 / 108 | 43.9%Fiscal year ending 12/2023
Facility
43.9%Fiscal year ending 12/2023
AL AVG
53.2%
Rank
#87 / 107 | 15454 | ||||
| Diversicare of Big Springs | NH HOS MC SNF | Sw Huntsville (Twickenham Square) | 135
Facility
135
AL AVG
90
Rank
#45 / 241 | - | - | 3.68
Facility
3.68
AL AVG
4.37
Rank
#104 / 124 | +23% | -16% | $0
Facility
$0
AL AVG
$59.8k
Rank
#1 / 125 | 12
Facility
12
AL AVG
10.4
Rank
#85 / 124 | 3.0
Facility
3.0
AL AVG
3.5
Rank
#46 / 124 | - | 127 | - |
69
Facility
69
AL AVG
39
Rank
#24 / 382 | Diversicare Leasing Company II LLC | $13.0MFiscal year ending 12/2023
Facility
$13.0MFiscal year ending 12/2023
AL AVG
$11.3M
Rank
#35 / 108 | $5.2MFiscal year ending 12/2023
Facility
$5.2MFiscal year ending 12/2023
AL AVG
$5.8M
Rank
#53 / 108 | 40.3%Fiscal year ending 12/2023
Facility
40.3%Fiscal year ending 12/2023
AL AVG
53.2%
Rank
#100 / 107 | 15111 | ||||
| Huntsville Health and Rehabilitation, LLC | NH PC SNF | Sw Huntsville (Chris Drive Southwest) | 105
Facility
105
AL AVG
90
Rank
#76 / 241 |
98.1%
Facility
98.1%
AL AVG
78.5
Rank
#3 / 107 | +25% | 4.67
Facility
4.67
AL AVG
4.37
Rank
#37 / 124 | -10% | +7% | $0
Facility
$0
AL AVG
$59.8k
Rank
#1 / 125 | 6
Facility
6
AL AVG
10.4
Rank
#29 / 124 | 2.0
Facility
2.0
AL AVG
3.5
Rank
#15 / 124 | - | 103 | - |
31
Facility
31
AL AVG
39
Rank
#236 / 382 | Huntsville Health Realty, LLC | $10.3MFiscal year ending 06/2024
Facility
$10.3MFiscal year ending 06/2024
AL AVG
$11.3M
Rank
#55 / 108 | $5.9MFiscal year ending 06/2024
Facility
$5.9MFiscal year ending 06/2024
AL AVG
$5.8M
Rank
#42 / 108 | 57.7%Fiscal year ending 06/2024
Facility
57.7%Fiscal year ending 06/2024
AL AVG
53.2%
Rank
#27 / 107 | 15440 | ||||
| Brookshire Healthcare Center | NH MC RC SNF | Huntsville | 129
Facility
129
AL AVG
90
Rank
#52 / 241 |
90.9%
Facility
90.9%
AL AVG
78.5
Rank
#32 / 107 | +16% | 4.78
Facility
4.78
AL AVG
4.37
Rank
#27 / 124 | -27% | +9% | $0
Facility
$0
AL AVG
$59.8k
Rank
#1 / 125 | 8
Facility
8
AL AVG
10.4
Rank
#45 / 124 | 2.7
Facility
2.7
AL AVG
3.5
Rank
#37 / 124 | - | 117 | - |
36
Facility
36
AL AVG
39
Rank
#210 / 382 | Aop Snf Operations Holdings LLC | $11.1M*Fiscal year ending 12/2022These figures are from this home's most recent complete cost report — an older period than most facilities report. Compare with that in mind. | $2.4M*Fiscal year ending 12/2022These figures are from this home's most recent complete cost report — an older period than most facilities report. Compare with that in mind. | 21.7%*Fiscal year ending 12/2022These figures are from this home's most recent complete cost report — an older period than most facilities report. Compare with that in mind. | 15127 | ||||
| Signature HealthCARE of Whitesburg Gardens | NH RC SNF | Huntsville (Teakwood Drive Southwest) | 159
Facility
159
AL AVG
90
Rank
#23 / 241 |
76.2%
Facility
76.2%
AL AVG
78.5
Rank
#76 / 107 | -3% | 4.56
Facility
4.56
AL AVG
4.37
Rank
#47 / 124 | +38% | +4% | $0
Facility
$0
AL AVG
$59.8k
Rank
#1 / 125 | 20
Facility
20
AL AVG
10.4
Rank
#114 / 124 | 6.7
Facility
6.7
AL AVG
3.5
Rank
#118 / 124 | 3 | 121 | - |
51
Facility
51
AL AVG
39
Rank
#108 / 382 | Shc LP Holdings LLC | $12.3MFiscal year ending 12/2023
Facility
$12.3MFiscal year ending 12/2023
AL AVG
$11.3M
Rank
#41 / 108 | $4.7MFiscal year ending 12/2023
Facility
$4.7MFiscal year ending 12/2023
AL AVG
$5.8M
Rank
#65 / 108 | 38.2%Fiscal year ending 12/2023
Facility
38.2%Fiscal year ending 12/2023
AL AVG
53.2%
Rank
#104 / 107 | 15116 |
Signature HealthCARE of Whitesburg Gardens is located in Huntsville, Alabama.
Here are the financial assistance programs available to residents in Alabama.
Signature HealthCARE of Whitesburg Gardens is in the Teakwood Drive Southwest neighborhood.
Signature HealthCARE of Whitesburg Gardens has a walk score of 51. Moderately walkable. Some errands can be accomplished on foot, with a mix of nearby amenities.
Signature HealthCARE of Whitesburg Gardens's occupancy is 64.9%.
No, Signature HealthCARE of Whitesburg Gardens has a no-pet policy.
Signature HealthCARE of Whitesburg Gardens is registered as a for-profit.
Yes — there are 6 photos of Signature HealthCARE of Whitesburg Gardens in the photo gallery on this page.
Signature HealthCARE of Whitesburg Gardens is located at 105 Teakwood Dr Sw, Huntsville, AL 35801.
Care Cost Calculator: See Prices in Your Area
Nursing Home Data Explorer
Don’t Wait Too Long: 7 Red Flag Signs Your Parent Needs Assisted Living Now
The True Cost of Assisted Living in 2025 – And How Families Are Paying For It
Understanding Senior Living Costs: Pricing Models, Discounts & Financial Assistance


