


Total health inspections
3
Delaware average 4.4
Last Health inspection on Jan 2025

We arrange tours, appointments, and even moving support so you don’t have to
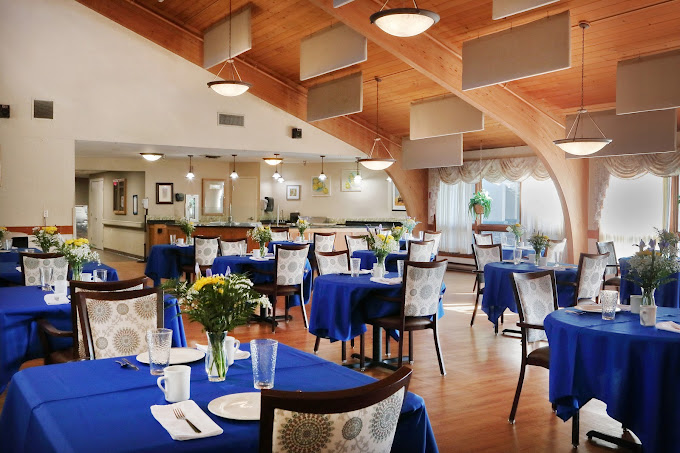
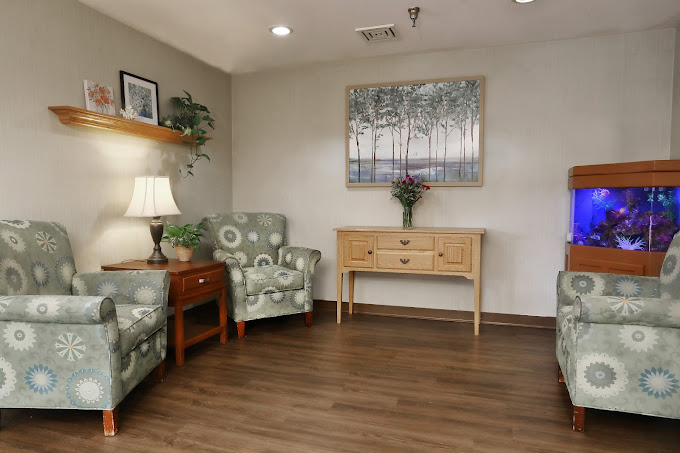
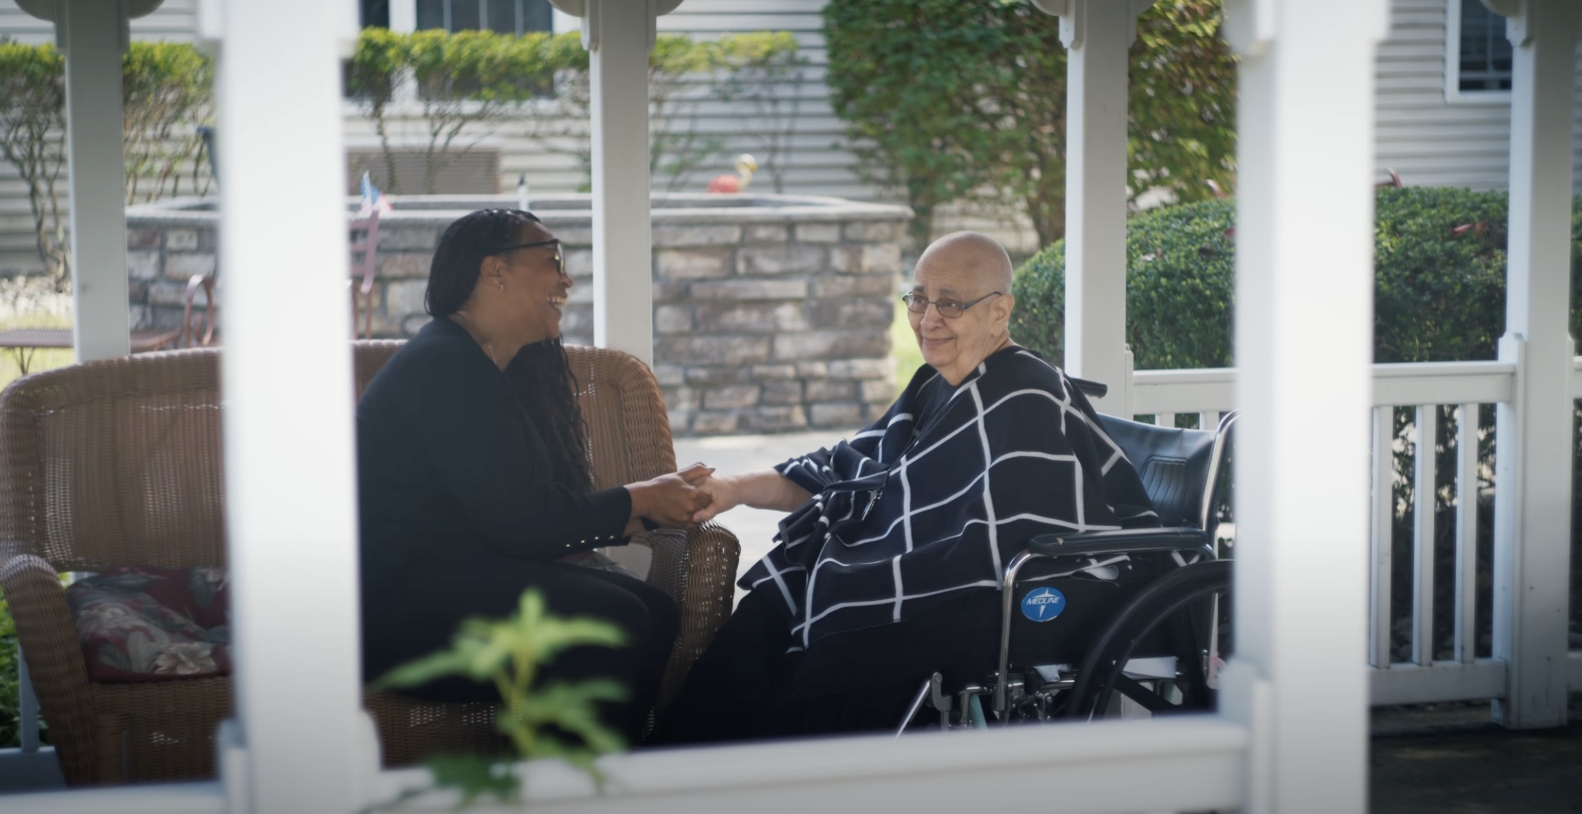

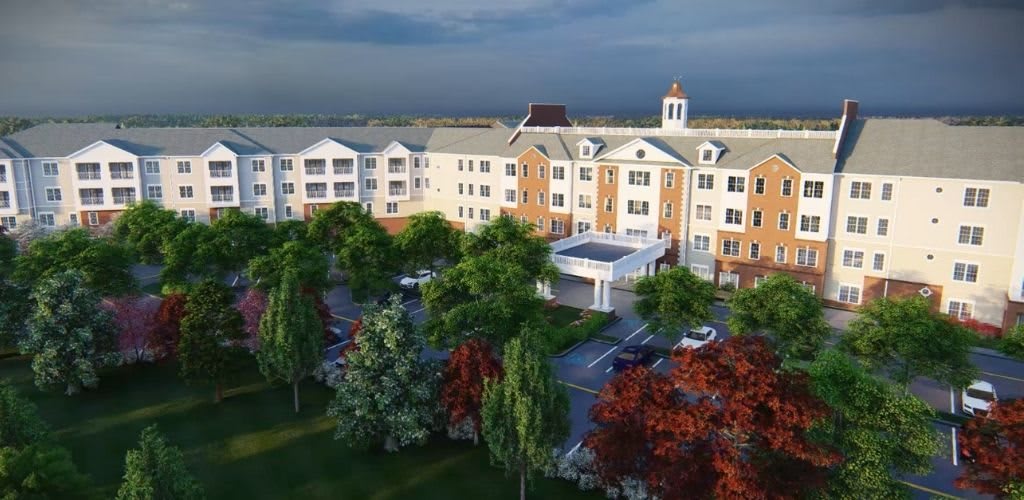
Located in Dover, Delaware, prioritize a hands-on approach with frequent leadership visits, creating a supportive and familiar environment where everyone feels like family. Complete Care can help to the whole person, addressing mental, physical, social, and spiritual needs. Activities are designed with resident preferences in mind, ensuring a fulfilling and engaging experience. Only the most caring individuals qualify to join the Complete Care team. Their dedication to resident well-being shines through in every interaction, fostering a sense of belonging and connection.
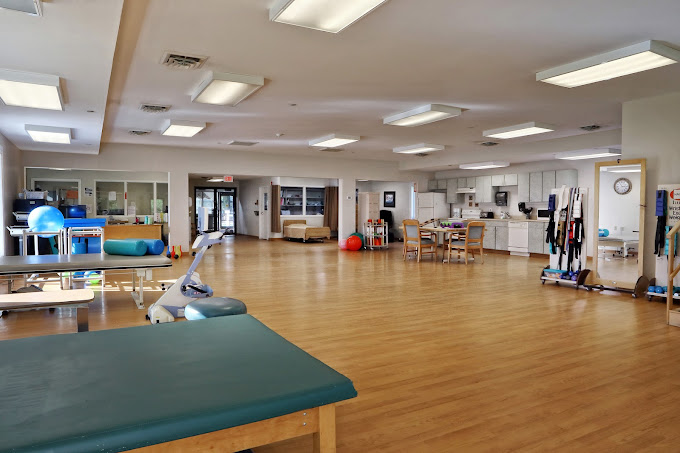
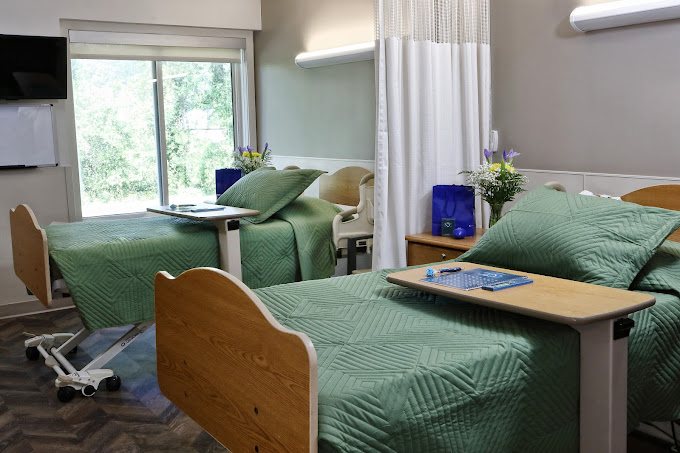
Complete Care offers a wide range of services to meet diverse needs. This includes short-term rehabilitation, long-term care, orthopedic rehab, subacute care, and specialized memory care services. Their expert staff provides outstanding medical and clinical care, focusing on resident well-being at every stage. Complete Care offers private and semi-private rooms with a variety of amenities to enhance comfort and well-being. Residents enjoy free Wi-Fi, cable TV, and convenient on-site beauty salon services.
Steve Smith serves as the Nursing Home Administrator at Complete Care at Silver Lake. He leads the community with a commitment to building strong relationships with residents and maintaining a dedicated, long-tenured staff. His leadership reflects the community’s focus on exemplary, compassionate care that goes beyond traditional standards.
 Official CMS rating based on health inspections, staffing and quality measures.
Official CMS rating based on deficiencies found during state health inspections.
Official CMS rating based on nurse staffing hours per resident per day.
Official CMS rating based on clinical outcomes for residents.
Average daily nursing hours per resident (adjusted for acuity). Higher values indicate more nursing time per resident.
Hours of care per resident per day, broken down by staff type. Data from CMS Medicare.
Registered nurse hours per resident per day.
Licensed Practical Nurse / Licensed Vocational Nurse hours per resident per day.
Nurse aide hours per resident per day.
Total number of nurse staff hours per resident per day on weekends.
Physical therapist staff hours per resident per day.
Registered nurse hours per resident per day on weekends.
Official CMS rating based on health inspections, staffing and quality measures.
Official CMS rating based on deficiencies found during state health inspections.
Official CMS rating based on nurse staffing hours per resident per day.
Official CMS rating based on clinical outcomes for residents.
Average daily nursing hours per resident (adjusted for acuity). Higher values indicate more nursing time per resident.
Hours of care per resident per day, broken down by staff type. Data from CMS Medicare.
Registered nurse hours per resident per day.
Licensed Practical Nurse / Licensed Vocational Nurse hours per resident per day.
Nurse aide hours per resident per day.
Total number of nurse staff hours per resident per day on weekends.
Physical therapist staff hours per resident per day.
Registered nurse hours per resident per day on weekends.
Offers a balance of services and community atmosphere.
Occupancy is moderate, suggesting balanced demand.
This home supports both short-term rehab and long-term care, with residents staying for a wide range of durations.
37% of new residents, usually for short-term rehab.
51% of new residents, often for short stays.
13% of new residents, often for long-term daily care.
The portion of the home's budget spent on staff, including nurses, caregivers, and other employees who support care and operations.
All remaining costs needed to run the home, such as food, utilities, building maintenance, supplies and administrative expenses.
Complete Care at Silver Lake is administrated by Steven Smith.
Key information about the people who lead and staff this community.
Housing Options: Private Rooms / Semi-Private Rooms
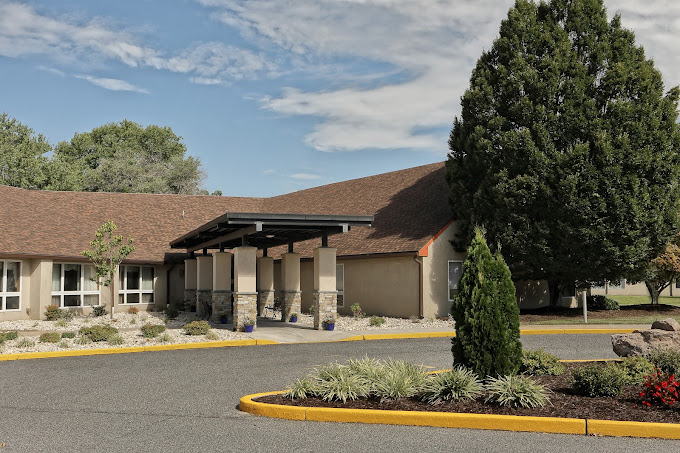
Building Type: Single-story
Transportation Services
Fitness and Recreation
In Delaware, the Department of Health and Social Services, Division of Health Care Quality is responsible for the oversight, unannounced inspection, and licensing of all long-term care settings.
6 visits/inspections triggered by complaints
2 other visits
7 with issues
4 without issues
Deficiencies indicate regulatory issues. A higher number implies the facility had several areas requiring improvement.
Assisted Living For seniors needing help with daily tasks but not full-time nursing.
Memory Care Specialized care for those with Memory Loss, Alzheimer's, or dementia, ensuring safety and support.
Nursing Homes 24/7 care needed
Assisted Living For seniors needing help with daily tasks but not full-time nursing.
Independent Living For self-sufficient seniors seeking community and minimal assistance.
Memory Care Specialized care for those with Memory Loss, Alzheimer's, or dementia, ensuring safety and support.
Assisted Living For seniors needing help with daily tasks but not full-time nursing.
Memory Care Specialized care for those with Memory Loss, Alzheimer's, or dementia, ensuring safety and support.
Nursing Homes 24/7 care needed
Assisted Living For seniors needing help with daily tasks but not full-time nursing.
Memory Care Specialized care for those with Memory Loss, Alzheimer's, or dementia, ensuring safety and support.
Hospice Care
Memory Care Specialized care for those with Memory Loss, Alzheimer's, or dementia, ensuring safety and support.
Complete Care at Silver Lake 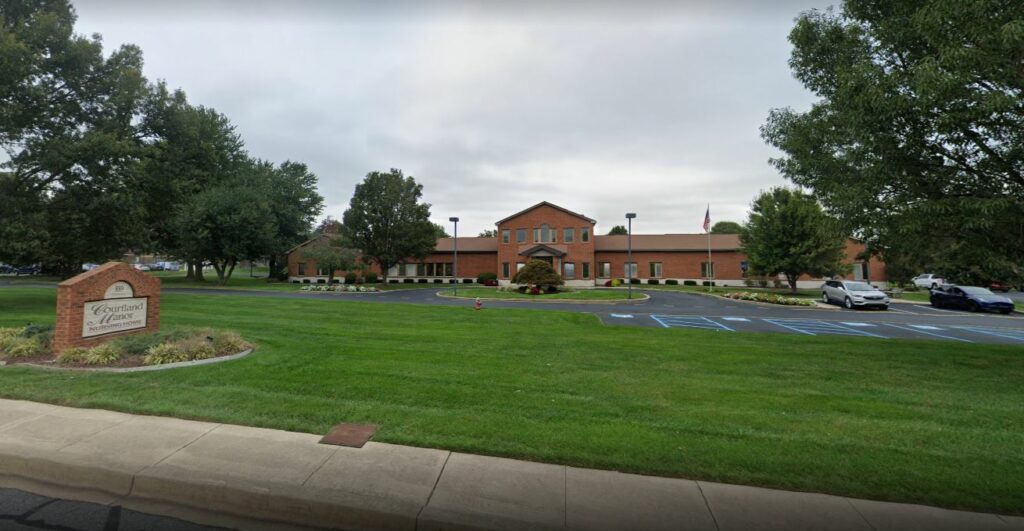 Courtland Manor
![]() 2 miles from city center — 0.92 miles to nearest hospital (PAM Health Rehabilitation Hospital of Dover)
2 miles from city center — 0.92 miles to nearest hospital (PAM Health Rehabilitation Hospital of Dover)
![]() 1080 Silver Lake Blvd, Dover, DE 19904
1080 Silver Lake Blvd, Dover, DE 19904
Add your location
Source: CMS Payroll-Based Journal (Q2 2025)
| Role ⓘ | Count ⓘ | Avg Shift (hrs) ⓘ | Uses Contractors? ⓘ |
|---|---|---|---|
| Registered Nurse | 19 | 8.7 | Yes |
| Licensed Practical Nurse | 28 | 8.4 | Yes |
| Certified Nursing Assistant | 60 | 8.1 | No |
| Role ⓘ | Employees ⓘ | Contractors ⓘ | Total Staff ⓘ | Total Hours ⓘ | Days Worked ⓘ | % of Days ⓘ | Avg Shift (hrs) ⓘ |
|---|---|---|---|---|---|---|---|
| Certified Nursing Assistant | 60 | 0 | 60 | 22,882 | 91 | 100% | 8.1 |
| Licensed Practical Nurse | 21 | 7 | 28 | 7,111 | 91 | 100% | 8.4 |
| Registered Nurse | 13 | 6 | 19 | 6,641 | 91 | 100% | 8.7 |
| Nurse Aide in Training | 9 | 0 | 9 | 3,577 | 91 | 100% | 7.6 |
| Clinical Nurse Specialist | 9 | 0 | 9 | 2,530 | 69 | 76% | 7.8 |
| Other Dietary Services Staff | 2 | 0 | 2 | 968 | 79 | 87% | 8.1 |
| Nurse Practitioner | 4 | 0 | 4 | 787 | 63 | 69% | 8.1 |
| Speech Language Pathologist | 0 | 4 | 4 | 697 | 79 | 87% | 8 |
| Physical Therapy Aide | 0 | 2 | 2 | 588 | 62 | 68% | 7.5 |
| Mental Health Service Worker | 1 | 0 | 1 | 512 | 64 | 70% | 8 |
| Dietitian | 1 | 0 | 1 | 463 | 57 | 63% | 8.1 |
| Physical Therapy Assistant | 0 | 3 | 3 | 433 | 59 | 65% | 7.3 |
| Respiratory Therapy Technician | 0 | 3 | 3 | 425 | 56 | 62% | 6.8 |
| Qualified Social Worker | 0 | 2 | 2 | 411 | 53 | 58% | 7.7 |
| Administrator | 1 | 0 | 1 | 408 | 51 | 56% | 8 |
| Dental Services Staff | 1 | 0 | 1 | 171 | 33 | 36% | 5.2 |
Delaware average 4.4
Last Health inspection on Jan 2025
Health citations are formal notices following inspections when they fail to comply with safety and care standards.
26 of 30 citations resulted from standard inspections; 1 of 30 resulted from complaint investigations; and 3 of 30 came from combined inspections (standard and complaint).
Delaware average: 0.9
Delaware average: 1.2
Data sourced from CMS Health Deficiencies reports. Citation severity codes range from A (least serious) to L (most serious). Immediate Jeopardy (J-L) citations indicate situations where the facility's noncompliance has placed residents at risk of death or serious harm.
Source: CMS Long-Term Care Facility Characteristics (Data as of Jan 2026)
Active councils help families stay involved in care decisions and facility operations.
These measures show how residents usually do over time at this home, based on health outcomes and preventive care.
Delaware average: 9.6
Delaware average: 19.0
Delaware average: 15.4%
Delaware average: 19.8%
Delaware average: 22.1%
Delaware average: 3.0%
Delaware average: 4.4%
Delaware average: 2.1%
Delaware average: 5.8%
Delaware average: 6.0%
Delaware average: 11.0%
Delaware average: 95.3%
Delaware average: 97.4%
Delaware average: 1.83
Delaware average: 1.37
Delaware average: 82.1%
Delaware average: 0.9%
Delaware average: 83.1%
Delaware average: 21.5%
Delaware average: 11.2%
Delaware average: 0.8%
Delaware average: 53.7%
Delaware average: 50.6%
Quality measures are calculated from Minimum Data Set (MDS) assessments. For most measures, lower percentages indicate better care quality.
Federal penalties imposed by CMS for regulatory violations, including civil money penalties (fines) and denials of payment for new Medicare/Medicaid admissions.
Source: CMS Penalties Database (Data as of Jan 2026)
Delaware average: $98K
Delaware average: 1.9
Delaware average: 0.2
Penalties are imposed by CMS for violations of federal nursing home regulations.
Last updated: Jan 2026
Historical financial and operational data for Complete Care at Silver Lake based on CMS SNF Cost Reports.
Loading trend charts...
Care Cost Calculator: See Prices in Your Area
Nursing Home Data Explorer
Don’t Wait Too Long: 7 Red Flag Signs Your Parent Needs Assisted Living Now
The True Cost of Assisted Living in 2025 – And How Families Are Paying For It
Understanding Senior Living Costs: Pricing Models, Discounts & Financial Assistance

We help families find affordable senior communities and unlock same day discounts, Medicaid, and Medicare options tailored to your needs.
Contact us Today
Touring a community? Use this expert-backed checklist to stay organized, ask the right questions, and find the perfect fit.
We'll send you a PDF version of the touring checklist.


