Explore Open Rooms

1 Contact details
2 What type of senior care service are you looking for?
3 What budget do you have in mind for senior care?
4 How soon do you need to find care?
5 Additional details

Thank you for your interest!

Our team will be in touch shortly to help with next steps.

Nursing Home in Perth Amboy

CMS overall rating Info The Overall CMS Rating combines results from health inspections, staffing levels and quality measures. Health inspections carry the most weight. Staffing and quality scores can increase or decrease the final rating based on performance compared to state and national standards.

Spring Creek Healthcare Center

1 Lindbergh Ave, Perth Amboy, NJ 08861 View map
Overview of Spring Creek Healthcare Center

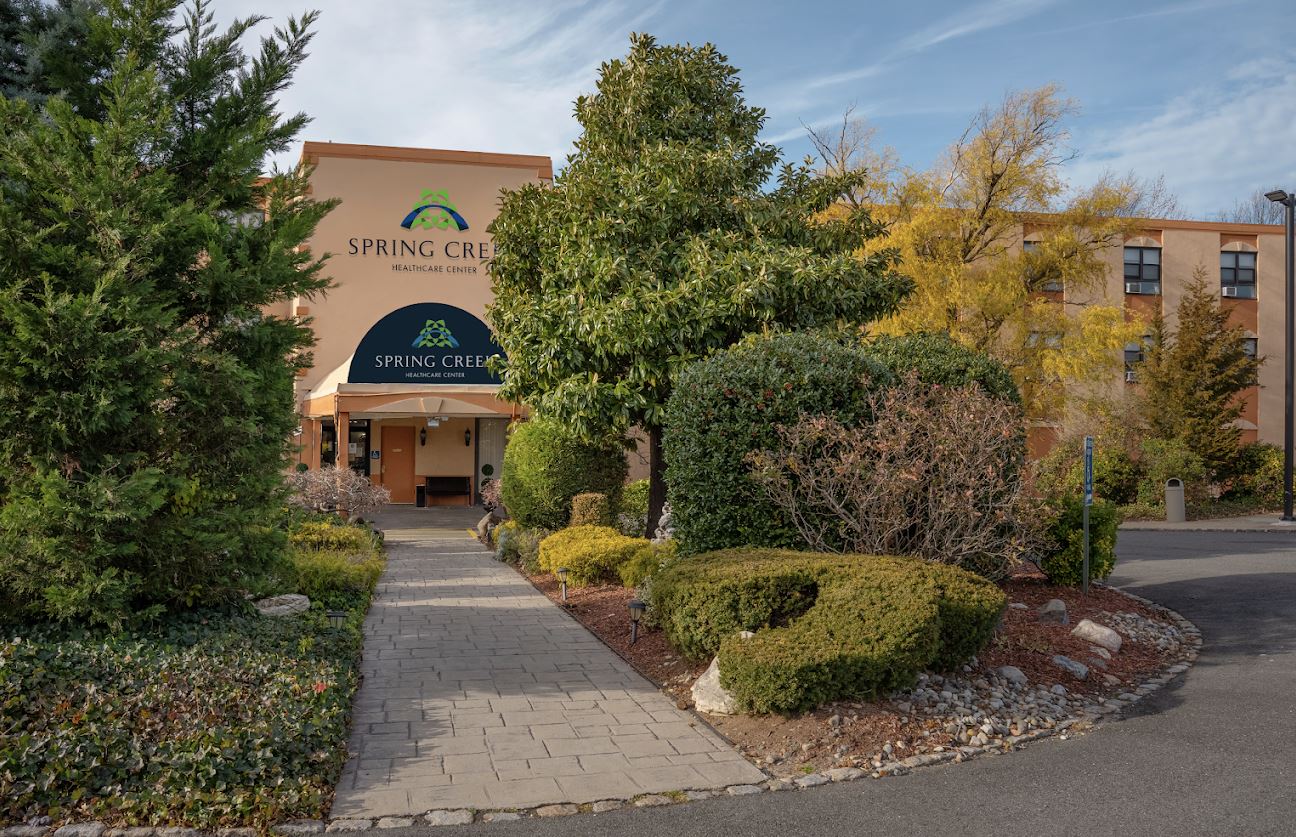
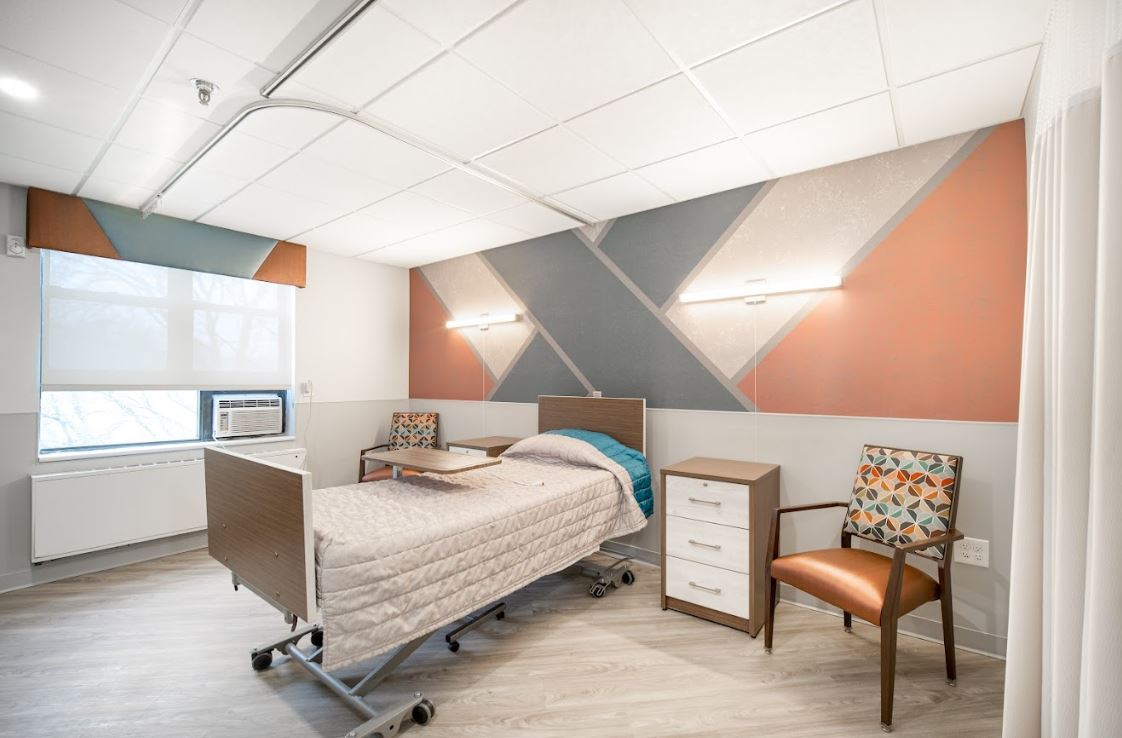
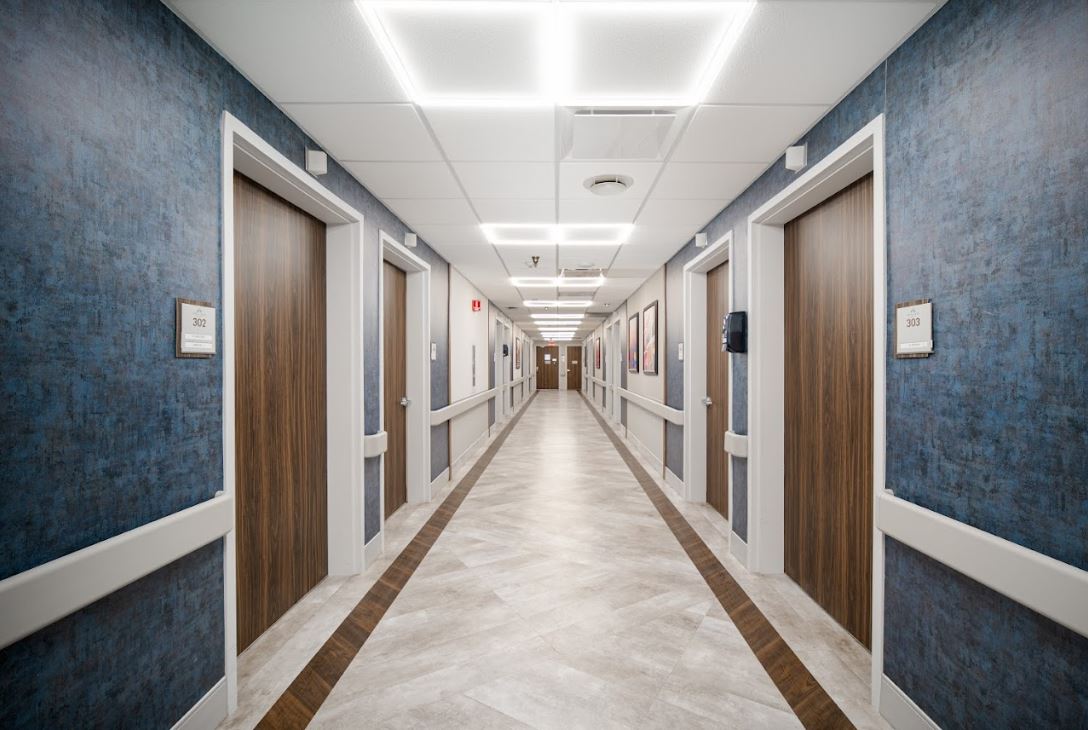
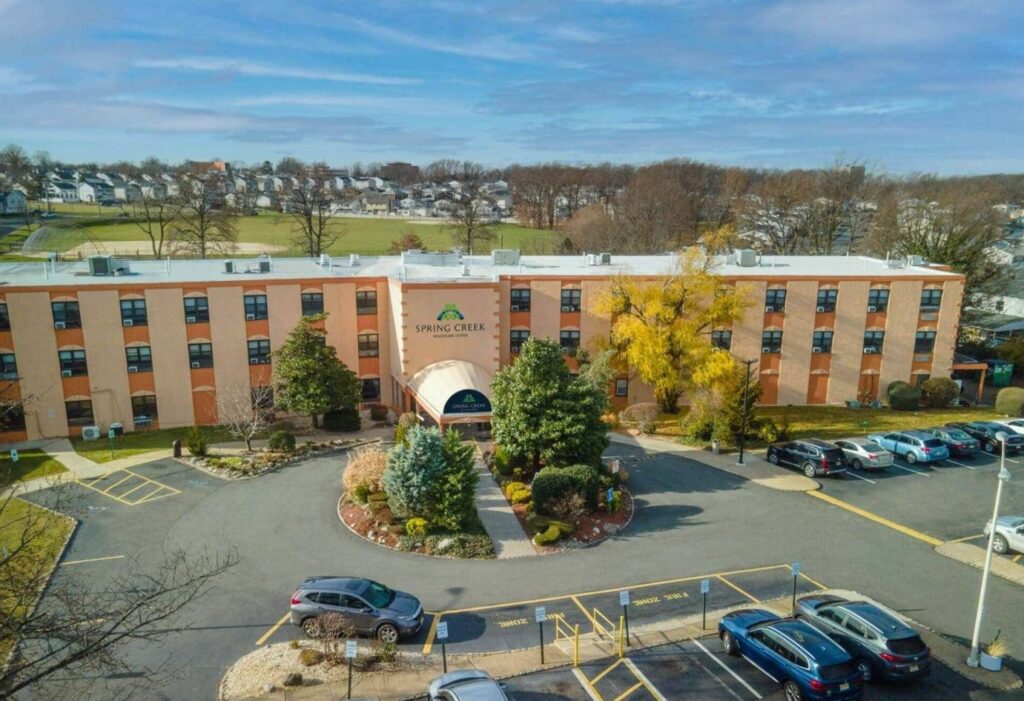
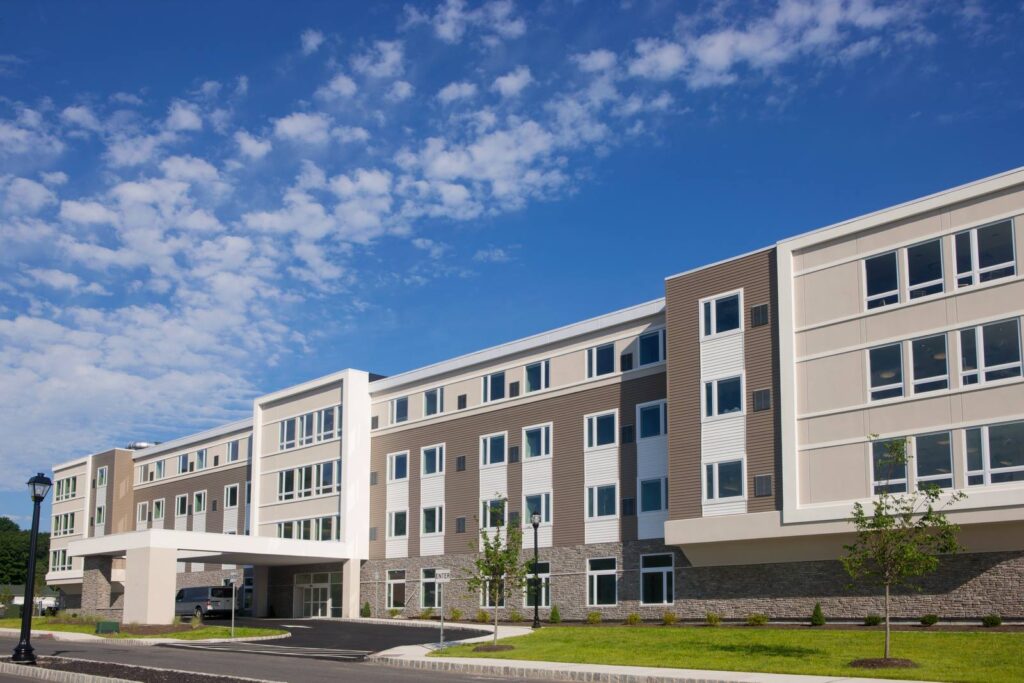
Settled in the welcoming town of Perth Amboy, NJ, the Spring Creek Healthcare Center is an exceptional community that offers subacute rehab, dementia care, and Hispanic program. With a 179-bed nursing home, residents receive customized care plans that are patient-centered as it is dedicated to serving as a bridge between hospital and home.

The community is administered by Allaire Health Services which is known for delivering outstanding professional healthcare services in the region. Here, residents can enjoy large flat-screen televisions, complimentary cable and wifi, spacious lounges and family areas, restaurant-style dining, a dedicated patient concierge, a lovely outdoor patio, beauty and barber salon, onsite laundry, religious services, full calendar activities, and Spanish speaking staff for its Hispanic program. Equipped with the right tools and people, the Spring Creek Healthcare Center assures excellent care and support for its residents.

(732) 826-0500

Quality ratings

Measured by Centers for Medicare & Medicaid Services (CMS)

Overall rating Info The Overall CMS Rating combines results from health inspections, staffing levels and quality measures. Health inspections carry the most weight. Staffing and quality scores can increase or decrease the final rating based on performance compared to state and national standards.
3/5
New Jersey average: 3.4/5
Health Inspection Info Based on the results of the facility's three most recent standard inspections and any complaint investigations. CMS reviews the number, scope, and severity of deficiencies, with more recent findings weighted more heavily.
3/5
New Jersey average: 2.9/5
Staffing Info Measures average nursing staff hours per resident per day, including Registered Nurses (RNs) and total nursing staff. Ratings are adjusted based on the level of care residents require and are compared to state and national benchmarks.
2/5
New Jersey average: 3.1/5
Quality Measures Info Based on clinical and physical health indicators reported to CMS, such as hospital readmissions, falls, pressure ulcers, and improvements in mobility. These measures reflect how well residents' health needs are being managed.
3/5
New Jersey average: 4.4/5

Nursing care per resident

Info This shows how many total hours of nursing staff time are available per resident each day. Higher numbers usually mean more staff support.
3h 33m per day

This home provides 9% less nursing time per resident than the New Jersey average.

New Jersey average: 3h 55m per day

Staffing hours breakdown

Info Hours of care per resident per day, broken down by staff type. Data from CMS Medicare.
Staff type Facility State avg National avg
Registered Nurse (RN) Info Registered nurse hours per resident per day. 21m per day 41m per day 41m per day
Nurse Aide Info Nurse aide hours per resident per day. 1h 48m per day 2h 14m per day 2h 21m per day
Total Nursing (Weekend) Info Total number of nurse staff hours per resident per day on weekends. 2h 21m per day 3h 27m per day 3h 26m per day
Physical Therapist Info Physical therapist staff hours per resident per day. 1m per day 6m per day 4m per day
RN (Weekend) Info Registered nurse hours per resident per day on weekends. 9m per day 29m per day 29m per day

Capacity and availability

Medium-capacity home

Offers a balance of services and community atmosphere.

Total beds 179

This home usually has availability

Lower occupancy suggests more openings may be available.

Lower demand than the New Jersey average
Occupancy rate 67%
Residents per day (avg) 129
Occupancy rate
67%
Residents per day (avg)
129

Who this home usually serves

TYPE OF STAY

Mostly long-term care residents

Most residents stay for extended periods and receive ongoing daily care.

Might be optimal for
Long-term daily care Ongoing support needs

Breakdown by payment type

Medicare

28% of new residents, usually for short-term rehab.

Typical stay 4 - 5 months

Private pay

44% of new residents, often for short stays.

Typical stay 2 - 3 months

Medicaid

28% of new residents, often for long-term daily care.

Typical stay 3 - 4 years

Finances and operations

Privately-owned community
Operated by a business corporation.
Home revenue
$13.7M
Profit
$391.4K
Privately-owned community Operated by a business corporation.
Home revenue
$13,745,474.00
Profit
$391,430.00
Payroll costs Info The portion of the home's budget spent on staff, including nurses, caregivers, and other employees who support care and operations.
$5.7M
41.6% of revenue
Other operating costs Info All remaining costs needed to run the home, such as food, utilities, building maintenance, supplies and administrative expenses.
$7.6M
Total costs $13.4M
Bed community size
179-bed community
A large-scale community that may provide a wide range of amenities, services, and structured programs.
Walk Score
Walk Score: 56 / 100
Moderately walkable. Some errands can be accomplished on foot, with a mix of nearby amenities.

About this community

Occupancy

Occupancy rate
67%
In line with New Jersey average
Occupied beds
120 / 179
Average residents 119 per day

License Details

Facility TypeLong Term Care Facility
StatusActive
ExpirationNovember 30, 2026

Additional Licensing Details

License Number61201

Ownership & Operating Entity

Spring Creek Healthcare Center is legally operated by Spring Creek Rehabilitation And Nursing Center Llc, and administrated by Charles Teitelbaum.

Officers

Info Officers are individuals or entities with formal legal or financial responsibility for the organization that owns this facility

Benjamin Kurland, Naomi Kurland

Type Of Units

Long Term Care
179 units
Total beds
179 units

What does this home offer?

Housing options icon

Housing Options: Private Rooms

Building type icon
Building type icon

Building Type: Mid-rise

Types of Care at Spring Creek Healthcare Center

Nursing Home Memory Care

Inspection History

In New Jersey, the Department of Health, Health Facilities Evaluation and Licensing conducts mandatory unannounced surveys to ensure facilities provide safe and effective resident care.

15 visits/inspections

6 complaint inspections

9 routine inspections

New Jersey average: 8 visits/inspections

New Jersey average: 6 inspections

Routine Scope And Severity G – Moderate-High Concern

On a scale from A (least severe) to L (most severe).

Latest inspection

Date November 20, 2025

51 deficiencies

Deficiencies indicate regulatory issues. A higher number implies the facility had several areas requiring improvement.

New Jersey average: 18 deficiencies

24 deficiencies identified during routine visits

Deficiencies indicate regulatory issues. A higher number implies the facility had several areas requiring improvement.

New Jersey average: 18 deficiencies

Health Inspection History

Inspections
Total health inspections 5

New Jersey average 4


Last Health inspection on Apr 2025

Total health citations 17

New Jersey average 20.9

Citations per inspection
3.4

New Jersey average 5.35


Health citations are formal notices following inspections when they fail to comply with safety and care standards.

14 of 17 citations resulted from standard inspections; and 1 of 17 resulted from complaint investigations.

Breakdown of citation severity (last 3 years)
Critical Health citations More info 2
186% worse than New Jersey average

New Jersey average: 0.7


Serious Health citations More info 1
150% worse than New Jersey average

New Jersey average: 0.4

2 critical citations More info New Jersey average: 0.7

1 serious citation More info New Jersey average: 0.4

14 moderate citations More info New Jersey average: 19.3

0 minor citations More info New Jersey average: 0.5
Citations history (last 3 years)
Nutrition moderate citation Info Issues related to food quality, meal service, and resident's nutritional needs. Apr 15, 2025
Corrected

Quality of Care moderate citation Info Issues related to how well residents receive appropriate treatment and support for their medical and daily care needs. Apr 15, 2025
Corrected

Care Planning moderate citation Info Issues related to creating and updating personalized care plans for residents based on their needs and conditions. Apr 15, 2025
Corrected

Resident Rights moderate citation Info Issues related to resident's rights, including dignity, privacy, and the ability to make decisions about their care. Apr 15, 2025
Corrected

Compare Nursing Homes around Perth Amboy The information below is reported by the New Jersey Department of Health, Health Facilities Evaluation and Licensing.

3 facilities compared · CMS & NJ Dept. of Health data · Updated Apr 2026

Filter by care type
Spring Creek Healthcare Center
MC

Memory Care Secured, specialized care for people living with Alzheimer's or dementia. Staff trained in cognitive impairment, with higher staff-to-resident ratios and an environment designed to reduce confusion and wandering risk.

NH

Nursing Home Licensed facility providing 24/7 skilled nursing care for residents with complex, ongoing medical needs. Staffed by RNs, LPNs, and CNAs. Inspected and star-rated annually by CMS. Accepts Medicare (short-term rehab) and Medicaid (long-term care).

Perth Amboy
179
63.7%
-17%
3.55
-5%
-8%
2
17
3.4
3
129
56
Atlas, Sam
$13.7M
$5.7M
41.6%
315305
Private Rooms
Alameda Center for Rehabilitation and Healthcare
-
NH

Nursing Home Licensed facility providing 24/7 skilled nursing care for residents with complex, ongoing medical needs. Staffed by RNs, LPNs, and CNAs. Inspected and star-rated annually by CMS. Accepts Medicare (short-term rehab) and Medicaid (long-term care).

Covina
49
-
-
-
-
-
-
-
-
0
0
0.0
0
-
-
-
-
-
-
-
Private / Semi-Private Rooms
Venetian Care & Rehabilitation Center
-
MC

Memory Care Secured, specialized care for people living with Alzheimer's or dementia. Staff trained in cognitive impairment, with higher staff-to-resident ratios and an environment designed to reduce confusion and wandering risk.

NH

Nursing Home Licensed facility providing 24/7 skilled nursing care for residents with complex, ongoing medical needs. Staffed by RNs, LPNs, and CNAs. Inspected and star-rated annually by CMS. Accepts Medicare (short-term rehab) and Medicaid (long-term care).

RC

Respite Care Short-term temporary care — days to weeks — to give family caregivers a break. Full care provided during the stay. Often used after hospitalization or to trial a facility before a permanent placement decision.

West Covina
-
-
-
-
-
-
-
-
-
0
0
0.0
0
-
-
-
-
-
-
-
Private Rooms

Places of interest near Spring Creek Healthcare Center

Address 3 miles from city center

Address 1 Lindbergh Ave, Perth Amboy, NJ 08861

Calculate Travel Distance to Spring Creek Healthcare Center

Add your location

Address

Staffing Data (Q2 2025)

This data corresponds to Q2 2025 and is based on CMS Payroll-Based Journal.

Total staff 167
Employees 112
Contractors 55
Staff to resident ratio 1.39:1
22% worse than New Jersey average

New Jersey average ratio: 1.77:1

Avg staff/day 60
Average shift 8.1 hours
0% compared with New Jersey average

New Jersey average: 8 hours

Total staff hours (quarter) 44,494
Nursing staff breakdown
Registered Nurse

Manages medical care and health needs.

Total count 15
Average shift length Info Average shift length. Calculated as total hours divided by days worked and average staff per day. 8.2 hours

This role is partially covered by contractors.

Licensed Practical Nurse

Assists with medical care and medications.

Total count 45
Average shift length Info Average shift length. Calculated as total hours divided by days worked and average staff per day. 8.5 hours

This role is partially covered by contractors.

Certified Nursing Assistant

Helps with daily care and mobility.

Total count 76
Average shift length Info Average shift length. Calculated as total hours divided by days worked and average staff per day. 8.2 hours

This role is partially covered by contractors.

Contractor staffing

Total hours from contractors

14.8%

6,596 contractor hours this quarter

Certified Nursing Assistant: 25 Licensed Practical Nurse: 25 Registered Nurse: 5
Staff by category
Certified Nursing Assistant51257623,52191100%8.2
Licensed Practical Nurse2025459,53891100%8.5
Registered Nurse105153,48291100%8.2
Other Dietary Services Staff5052,10491100%8.3
Physical Therapy Assistant4041,1816571%7.7
Clinical Nurse Specialist3038836976%7.8
Speech Language Pathologist3038346673%8
Qualified Social Worker3035647077%7.5
Mental Health Service Worker1015206571%8
Administrator2024966268%8
Nurse Practitioner1014816066%8
Occupational Therapy Aide1013346673%5.1
Physical Therapy Aide3032494853%5
Respiratory Therapy Technician4042033033%6.6
Dietitian1011041314%8
76 Certified Nursing Assistant
% of Days 100%
45 Licensed Practical Nurse
% of Days 100%
15 Registered Nurse
% of Days 100%
5 Other Dietary Services Staff
% of Days 100%
4 Physical Therapy Assistant
% of Days 71%
3 Clinical Nurse Specialist
% of Days 76%
3 Speech Language Pathologist
% of Days 73%
3 Qualified Social Worker
% of Days 77%
1 Mental Health Service Worker
% of Days 71%
2 Administrator
% of Days 68%
1 Nurse Practitioner
% of Days 66%
1 Occupational Therapy Aide
% of Days 73%
3 Physical Therapy Aide
% of Days 53%
4 Respiratory Therapy Technician
% of Days 33%
1 Dietitian
% of Days 14%

Facility Characteristics

Source: CMS Long-Term Care Facility Characteristics (Data as of Jan 2026)

Total census
120 residents
Residents by payment source
Medicare
14 residents (11.7%)
Medicaid
88 residents (73.3%)
Private pay or other
18 residents (15%)
Programs & Services
Residents' Group

Residents meet regularly to discuss policies, care quality, and activities

Active Resident Council

Organized group of residents that meets regularly to discuss facility policies, quality of life, and activities.

Quality of care over time

These measures show how residents usually do over time at this home, based on health outcomes and preventive care.

High-risk clinical events score Info A composite score based on pressure ulcers, falls with injury, weight loss, walking ability decline, and activities of daily living decline. 2.9
57% better than New Jersey average

New Jersey average: 6.8

Functional decline score Info A composite score based on activities of daily living decline, walking ability decline, and incontinence. 2.5
80% better than New Jersey average

New Jersey average: 12.4

Long-stay resident measures
Significantly above average New Jersey avg: 4.5 Info CMS star rating based on long-stay quality measure performance. 5 stars = significantly above average, 1 star = significantly below average.
Need for Help with Daily Activities Increased Info Percent of long-stay residents whose need for help with daily activities has increased 2.1%
79% better than New Jersey average

New Jersey average: 10.1%

Walking Ability Worsened Info Percent of long-stay residents whose ability to move independently worsened 1.9%
82% better than New Jersey average

New Jersey average: 11.0%

Low Risk Residents with Bowel/Bladder Incontinence Info Percent of low risk long-stay residents who lose control of their bowels or bladder 3.4%
79% better than New Jersey average

New Jersey average: 16.0%

Falls with Major Injury Info Percent of long-stay residents experiencing one or more falls with major injury 1.4%
43% better than New Jersey average

New Jersey average: 2.4%

High Risk Residents with Pressure Ulcers Info Percent of long-stay high risk residents with pressure ulcers 5.9%
In line with New Jersey average

New Jersey average: 6.1%

Urinary Tract Infection Info Percent of long-stay residents with a urinary tract infection 0.0%
100% better than New Jersey average

New Jersey average: 1.0%

Lost Too Much Weight Info Percent of long-stay residents who lose too much weight 3.2%
31% better than New Jersey average

New Jersey average: 4.6%

Depressive Symptoms Info Percent of long-stay residents who have depressive symptoms 35.0%
210% worse than New Jersey average

New Jersey average: 11.3%

Antipsychotic Use Info Percent of long-stay residents who received an antipsychotic medication 12.8%
16% worse than New Jersey average

New Jersey average: 11.1%

Pneumococcal Vaccine Info Percent of long-stay residents assessed and appropriately given the pneumococcal vaccine 97.2%
5% better than New Jersey average

New Jersey average: 93.0%

Influenza Vaccine Info Percent of long-stay residents assessed and appropriately given the seasonal influenza vaccine 97.3%
In line with New Jersey average

New Jersey average: 97.2%

Hospitalizations per 1,000 days Info Number of hospitalizations per 1,000 long-stay resident days. 2.63
26% worse than New Jersey average

New Jersey average: 2.08

ED visits per 1,000 days Info Number of outpatient emergency department visits per 1,000 long-stay resident days. 1.42
27% worse than New Jersey average

New Jersey average: 1.12

Short-stay resident measures
Below average New Jersey avg: 3.5 Info CMS star rating based on short-stay quality measure performance. 5 stars = much above average, 1 star = much below average.
Pneumococcal Vaccine Info Percent of short-stay residents assessed and appropriately given the pneumococcal vaccine 84.2%
7% better than New Jersey average

New Jersey average: 78.9%

Antipsychotic medication increase Info Percent of short-stay residents who newly received an antipsychotic medication 1.3%
14% worse than New Jersey average

New Jersey average: 1.2%

Influenza Vaccine Info Percent of short-stay residents assessed and appropriately given the seasonal influenza vaccine 75.3%
6% worse than New Jersey average

New Jersey average: 80.1%

Re-hospitalized after SNF stay Info Percentage of short-stay residents who were re-hospitalized after their nursing home admission. 24.2%
5% better than New Jersey average

New Jersey average: 25.4%

Emergency department visits Info Percentage of short-stay residents who had an outpatient emergency department visit. 10.8%
32% worse than New Jersey average

New Jersey average: 8.2%

Falls with major injury Info Percentage of SNF residents who experience falls with major injury during their stay. 1.0%
34% worse than New Jersey average

New Jersey average: 0.8%

Ability to care for self at discharge Info Percentage of residents at or above expected ability to care for themselves at discharge. 41.8%
22% worse than New Jersey average

New Jersey average: 53.7%

Successful return to home or community Info Rate of successful return to home or community from a skilled nursing facility. 15.8%
69% worse than New Jersey average

New Jersey average: 50.6%

Guides for Better Senior Living

Care Cost Calculator: See Prices in Your Area

Nursing Home Data Explorer

Don’t Wait Too Long: 7 Red Flag Signs Your Parent Needs Assisted Living Now

The True Cost of Assisted Living in 2025 – And How Families Are Paying For It

Understanding Senior Living Costs: Pricing Models, Discounts & Financial Assistance

Financial Aid for New Jersey Seniors

Get financial aid guidance

Managed Long Term Services and Supports

NJ Medicaid MLTSS

Age 65+ or disabled, New Jersey resident, Medicaid- eligible, nursing home-level care need.

~$2,829/month (300% FBR, individual).

$2,000 (individual), $3,000 (couple).

High urban demand; managed care model.

JACC (Jersey Assistance for Community Caregiving)

NJ JACC

Age 60+, New Jersey resident, at risk of nursing home.

~$2,500/month (individual, varies).

$40,000 (individual).

Higher asset limit; limited funding.

Pharmaceutical Assistance to the Aged and Disabled (PAAD)

New Jersey PAAD

Age 65+, NJ resident, enrolled in Medicare Part D or eligible.

~$42,142/year (individual), ~$49,209/year (couple).

Not assessed.

Copays $5 (generic), $7 (brand); covers Part D premiums up to benchmark.

Senior Gold Prescription Discount Program

New Jersey Senior Gold

Age 65+, NJ resident, enrolled in Medicare Part D or eligible.

~$42,142-$52,142/year (individual), ~$49,209-$59,209/year (couple).

Not assessed.

Copays $15 + 50% of remaining cost; no premium assistance.

Medicare Savings Program (MSP)

New Jersey Medicare Savings Program

Age 65+ or disabled, NJ resident, Medicare Part A/B.

~$2,510/month (QMB), ~$3,380/month (SLMB), ~$3,598/month (QI)—individual.

$9,430 (individual), $14,130 (couple).

Three tiers; no waitlist; includes Extra Help for Part D.

Senior Freeze (Property Tax Reimbursement)

New Jersey Senior Freeze

Age 65+ by Dec 31 prior year, NJ resident, homeowner, paid property taxes.

~$150,000/year (combined household, projected).

Not assessed; home ownership required.

Combines with ANCHOR/Stay NJ via PAS-1; annual application.

ANCHOR (Affordable NJ Communities for Homeowners and Renters)

New Jersey ANCHOR

Age 65+ prioritized, NJ resident, homeowner/renter, paid property taxes/rent.

~$150,000/year (homeowners), ~$75,000/year (renters).

Not assessed.

Combines with Senior Freeze/Stay NJ; broader than prior Homestead program.

Stay NJ

New Jersey Stay NJ

Age 65+ by Dec 31 prior year, NJ resident, homeowner, lived in home 10+ years.

~$500,000/year (projected, subject to final regs).

Not assessed; home ownership required.

Up to 50% tax credit (max $6,500); phased implementation.

Universal Service Fund (USF)

New Jersey Universal Service Fund

Age 65+ prioritized, NJ resident, utility customer, low-income.

~$3,970/month (individual, 185% FPL).

Not assessed; income-focused.

Must owe >$25 on bill; combines with LIHEAP if eligible.

Home Energy Assistance Program (LIHEAP)

New Jersey LIHEAP

Age 60+ prioritized, NJ resident, low-income household.

~$3,970/month (individual, 185% FPL).

Not assessed; income-focused.

Covers oil, gas, electric; emergency aid available.

NJ Family Caregiver Support Program (via NFCSP)

New Jersey Family Caregiver Support Program

Caregivers of 60+ needing care or 55+ caregivers of others; NJ resident; functional needs (2+ ADLs).

Prioritizes ~$24,980/year (individual); no strict cap.

Not assessed; need-based.

21 AAAs; rural/low-income priority.

VA Aid and Attendance (A&A) and Housebound Benefits

New Jersey VA Aid and Attendance/Housebound

Age 65+ or disabled veteran/spouse, NJ resident, wartime service, need for ADL help (A&A) or homebound.

Net income < ~$1,984/month (veteran with dependent, A&A); pension offsets income.

~$155,356 (net worth limit).

High veteran demand in urban/rural areas.