Venetian Care & Rehabilitation Center
Nursing Home, Hospice Care, Memory Care, Nursing Care, Palliative Care & Respite Care · South Amboy, NJ
CMS overall rating Info CMS (the Centers for Medicare & Medicaid Services) is the federal agency that rates nursing home quality. Its Overall Rating runs from 1 to 5 stars, combining health inspections, staffing, and quality measures, with inspections weighted most heavily.

Venetian Care & Rehabilitation Center

Nursing Home, Hospice Care, Memory Care, Nursing Care, Palliative Care & Respite Care · South Amboy, NJ
CMS overall rating Info CMS (the Centers for Medicare & Medicaid Services) is the federal agency that rates nursing home quality. Its Overall Rating runs from 1 to 5 stars, combining health inspections, staffing, and quality measures, with inspections weighted most heavily.
Calculator: See prices in your area
Venetian Care & Rehabilitation Center accepts Medicare, Medicaid, and private pay.

Overview of Venetian Care & Rehabilitation Center

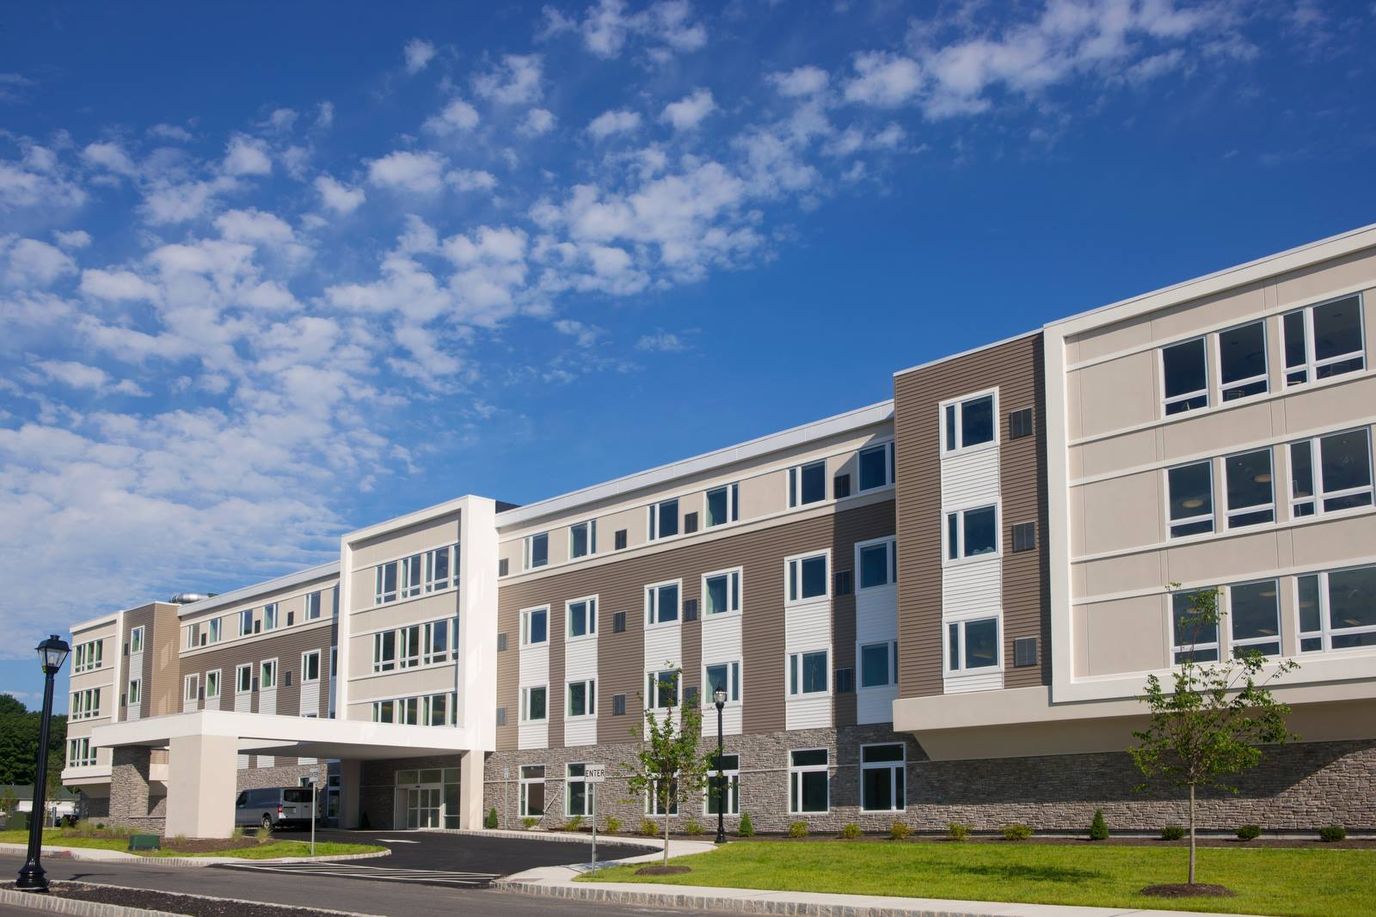
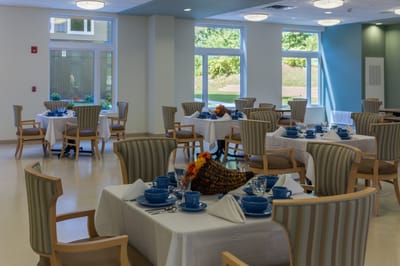
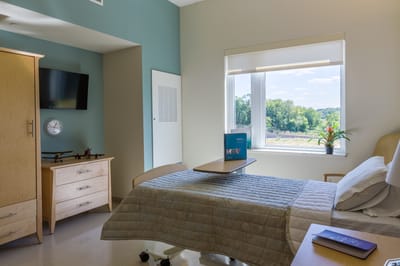
Venetian Care & Rehabilitation Center in South Amboy, NJ, is a nursing home that offers rehabilitation and skilled nursing. The community also ensures older adults are treated well in a nurturing and welcoming environment. With 24/7 care, housekeeping, laundry, and gourmet dining, residents experience a worry-free lifestyle. Dedicated to residents’ holistic well-being, the community also provides individualized care plans.

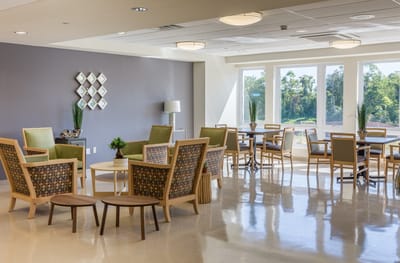
Games, light physical activities, and social events provide residents with more opportunities to explore interests and make friends. A coffee shop/ bistro, spacious lounges, and accessible amenities are also available for residents’ relaxation and wellness. With bus stops nearby, the community guarantees accessibility and convenience. This nursing home has high-quality services and a clean setting, making it one of the best options for senior living in New Jersey.

Quality ratings

Measured by Centers for Medicare & Medicaid Services (CMS)

Overall rating Info The Overall CMS Rating combines results from health inspections, staffing levels and quality measures. Health inspections carry the most weight. Staffing and quality scores can increase or decrease the final rating based on performance compared to state and national standards.
▼ 38.6% Below NJ avg. ▼ 38.6% Below NJ avg.NJ average: 3.3Click the badge to see the full State ranking.Click here to see the full State ranking.
Health Inspection Info Based on the results of the facility's three most recent standard inspections and any complaint investigations. CMS reviews the number, scope, and severity of deficiencies, with more recent findings weighted more heavily.
▼ 28.0% Below NJ avg. ▼ 28.0% Below NJ avg.NJ average: 2.8Click the badge to see the full State ranking.Click here to see the full State ranking.
Staffing Info Measures average nursing staff hours per resident per day, including Registered Nurses (RNs) and total nursing staff. Ratings are adjusted based on the level of care residents require and are compared to state and national benchmarks.
▼ 67.2% Below NJ avg. ▼ 67.2% Below NJ avg.NJ average: 3.0Click the badge to see the full State ranking.Click here to see the full State ranking.
Quality Measures Info Based on clinical and physical health indicators reported to CMS, such as hospital readmissions, falls, pressure ulcers, and improvements in mobility. These measures reflect how well residents' health needs are being managed.
▲ 16.1% Above NJ avg. ▲ 16.1% Above NJ avg.NJ average: 4.3Click the badge to see the full State ranking.Click here to see the full State ranking.

Staffing hours breakdown

Info Daily nursing hours per resident by staff type, reported to CMS. Higher is generally better — compare this facility to state and national averages to see where staffing stands.

Hours per resident per day — compared to New Jersey state averages

Total nursing care / resident Info This home is ranked 244th out of 294 homes in New Jersey for nurse hours. Total adjusted nursing hours per resident per day, combining RN, LPN, and aide time. CMS adjusts this for case-mix so facilities can be fairly compared.
3h 12m per day
Rank #244 / 294Nurse hours — State benchmarkedThis home is ranked 244th out of 294 homes in New Jersey. Shows adjusted nurse hours per resident per day benchmarked to the New Jersey average, with a ranking across 294 New Jersey facilities. More hours mean more direct care. The national average is about 3.5 hrs; below 3.0 is a red flag.Rankings are based only on facilities in New Jersey that report data for that category. Facilities without available data are excluded from the ranking.Click the rank badge to see the full State ranking.Click here to see the full State ranking.
This facility New Jersey avg (3h 53m per day)
vs New Jersey avg
-18%

4 of 6 metrics below state avg

Standout metric Weekend RN is +12% above state avg
Staff typeHours / Day / Residentvs state avg
Registered Nurse (RN) Info RNs hold the highest nursing license and can assess residents, interpret test results, and direct care plans. More RN hours per day often signals stronger clinical oversight and faster response to health changes. 46m per day ▲ 9% State avg: 42m per day · National avg: 41m per day
LPN / LVN Info Licensed Practical Nurses (LPNs) or Licensed Vocational Nurses (LVNs) deliver routine hands-on care — medication administration, wound dressing, and monitoring vital signs. They work under RN supervision and make up a large share of daily bedside care. 44m per day ▼ 23% State avg: 57m per day · National avg: 52m per day
Nurse Aide Info Certified Nurse Aides (CNAs) provide the most direct day-to-day assistance: bathing, dressing, feeding, and mobility. Nurse aide hours are typically the largest staffing category and directly affect residents' quality of life. 1h 54m per day ▼ 15% State avg: 2h 15m per day · National avg: 2h 20m per day
Weekend Total Nursing Info Combined nursing hours (RN + LPN + Nurse Aide) per resident per day on weekends. Staffing often drops on weekends — this figure reveals whether the facility maintains adequate coverage outside of weekday hours. 2h 57m per day ▼ 16% State avg: 3h 30m per day · National avg: 3h 27m per day
Physical Therapist Info Hours per resident per day provided by licensed Physical Therapists (PTs) or PT Assistants. PT services help residents recover mobility after injury or illness and are especially important for post-acute (short-stay) rehabilitation. 2m per day ▼ 68% State avg: 7m per day · National avg: 4m per day
Weekend RN Info Registered nurse hours specifically on weekends. Facilities sometimes reduce RN presence on Saturdays and Sundays — a low weekend RN figure compared to weekday hours can indicate reduced clinical oversight when most administrative staff are absent. 34m per day ▲ 12% State avg: 30m per day · National avg: 29m per day

Capacity and availability

This home usually has availability

Lower occupancy than the New Jersey average: 77%
Occupancy rate
65.6% Rank #371 / 496Occupancy rate — State benchmarkedThis home is ranked 371st out of 496 homes in New Jersey. Shows this facility's occupancy rate versus the New Jersey average, with its Statewide rank out of 496. Higher occupancy signals strong local demand and financial stability.Rankings are based only on facilities in New Jersey that report data for that category. Facilities without available data are excluded from the ranking.Click the rank badge to see the full State ranking.Click here to see the full State ranking.
Avg. Length of Stay
66 days
Bed community size
180-bed community Rank #78 / 561Bed count — State benchmarkedThis home is ranked 78th out of 561 homes in New Jersey. Shows this facility's certified or reported bed count compared to other New Jersey facilities. Larger communities may offer more amenities, programs, and on-site services for residents and families.Rankings are based only on facilities in New Jersey that report data for that category. Facilities without available data are excluded from the ranking.Click the rank badge to see the full State ranking.Click here to see the full State ranking.
A large-scale community that may provide a wide range of amenities, services, and structured programs.
Walk Score
Walk Score: 49 / 100 Rank #296 / 640Walk Score — State benchmarkedThis home is ranked 296th out of 640 homes in New Jersey. Shows how walkable this facility's neighborhood is compared to the average Walk Score across New Jersey facilities. Higher scores benefit residents, families, and staff.Rankings are based only on facilities in New Jersey that report data for that category. Facilities without available data are excluded from the ranking.Click the rank badge to see the full State ranking.Click here to see the full State ranking.
Somewhat walkable. A few nearby services may be reachable on foot, but most trips require transportation.

Contact Venetian Care & Rehabilitation Center

Staffing Data

Reporting period: October 1 – December 31, 2025 (Q4 2025). Source: CMS Payroll-Based Journal report.

Total staff 171
Employees 147
Contractors 24
Staff to resident ratio 1.25 : 1
30% fewer staff per resident than New Jersey average
New Jersey average ratio: 1.79 : 1 New Jersey average ratio: 1.79 : 1See full New Jersey ranking
Avg staff/day 71
Average shift 8.4 hours
5% better than New Jersey average
New Jersey average: 8 hours New Jersey average shift: 8 hoursSee full New Jersey ranking
Total staff hours (quarter) 54,721

Nursing staff breakdown

Q4 2025 · Oct 1 – Dec 31 More info This data comes from the CMS Payroll-Based Journal report covering October 1 – December 31, 2025.
Registered Nurse

Manages medical care and health needs.

RN Staff Info 39 total: 32 full-time employees and 7 contractors. 39
Average shift length Info Average shift length. Calculated as total hours divided by days worked and average staff per day. 9.2 hours
Licensed Practical Nurse

Assists with medical care and medications.

LPN Staff Info All 30 LPN Staff are full-time employees. No contractors work on this role. 30
Average shift length Info Average shift length. Calculated as total hours divided by days worked and average staff per day. 9 hours
Certified Nursing Assistant

Helps with daily care and mobility.

CNA Staff Info All 62 CNA Staff are full-time employees. No contractors work on this role. 62
Average shift length Info Average shift length. Calculated as total hours divided by days worked and average staff per day. 8.4 hours

Contractor staffing

Q4 2025 · Oct 1 – Dec 31 More info This data comes from the CMS Payroll-Based Journal report covering October 1 – December 31, 2025.

Total hours from contractors

6.4%

3,481 contractor hours this quarter

Registered Nurse: 7 Physical Therapy Aide: 5 Physical Therapy Assistant: 4 Respiratory Therapy Technician: 3 Speech Language Pathologist: 3 Qualified Social Worker: 2

Staff by category

Q4 2025 · Oct 1 – Dec 31 More info This data comes from the CMS Payroll-Based Journal report covering October 1 – December 31, 2025.
Certified Nursing Assistant6206226,06292100%8.4
Licensed Practical Nurse300308,92192100%9
Registered Nurse327398,08492100%9.2
Other Dietary Services Staff8083,21892100%7.3
Clinical Nurse Specialist7071,8657784%7.9
Physical Therapy Aide0551,1677076%7.4
RN Director of Nursing3031,1036874%8
Speech Language Pathologist0339677278%8
Mental Health Service Worker2028886672%8
Nurse Practitioner1015046368%8
Respiratory Therapy Technician0334846571%7.4
Administrator1014725964%8
Qualified Social Worker0224696470%7.3
Physical Therapy Assistant0442625762%3.7
Dietitian1012563235%8
62 Certified Nursing Assistant
% of Days 100%
30 Licensed Practical Nurse
% of Days 100%
39 Registered Nurse
% of Days 100%
8 Other Dietary Services Staff
% of Days 100%
7 Clinical Nurse Specialist
% of Days 84%
5 Physical Therapy Aide
% of Days 76%
3 RN Director of Nursing
% of Days 74%
3 Speech Language Pathologist
% of Days 78%
2 Mental Health Service Worker
% of Days 72%
1 Nurse Practitioner
% of Days 68%
3 Respiratory Therapy Technician
% of Days 71%
1 Administrator
% of Days 64%
2 Qualified Social Worker
% of Days 70%
4 Physical Therapy Assistant
% of Days 62%
1 Dietitian
% of Days 35%

Penalties and fines

Includes penalties issued in 2024

Federal penalties imposed by CMS for regulatory violations, including civil money penalties (fines) and denials of payment for new Medicare/Medicaid admissions.

Source: CMS Penalties Database (Data as of Jan 2026)

Total fines amount $56K Rank #243 / 297Federal fines — State benchmarkedThis home is ranked 243rd out of 297 homes in New Jersey. Shows this facility's cumulative CMS federal fine dollars versus the New Jersey average among facilities with fines, and where it ranks among 297 facilities in the pool. Lower total dollars mean a better rank.Rankings are based only on facilities in New Jersey that report data for that category. Facilities without available data are excluded from the ranking.Click the rank badge to see the full State ranking.Click here to see the full State ranking.
27% lower than New Jersey average

New Jersey average: $77K

Number of fines 1
50% fewer fines than New Jersey average

New Jersey average: 2.0

Payment Denials Info Serious action where Medicare and/or Medicaid temporarily stops payments for new residents until issues are fixed. 0
100% fewer payment denials than New Jersey average

New Jersey average: 0.1

Fines amount comparison
This facility $56K
New Jersey average $77K
Penalty History

Penalties are imposed by CMS for violations of federal nursing home regulations.

1 penalty in the past 3 years

Apr 10, 2024 · $56K

Civil Money Penalty Info Fines imposed for noncompliance, which can be assessed per day or per instance of violation. Apr 10, 2024
$56K

Last updated: Jan 2026

Quality of care over time

These measures show how residents usually do over time at this home, based on health outcomes and preventive care.

High-risk clinical events score Info A composite score based on pressure ulcers, falls with injury, weight loss, walking ability decline, and activities of daily living decline. 7.2
6% worse than New Jersey average

New Jersey average: 6.8

Functional decline score Info A composite score based on activities of daily living decline, walking ability decline, and incontinence. 11.5
7% better than New Jersey average

New Jersey average: 12.4

Long-stay resident measures
Need for Help with Daily Activities Increased Info Percent of long-stay residents whose need for help with daily activities has increased 12.8%
27% worse than New Jersey average

New Jersey average: 10.1%

Walking Ability Worsened Info Percent of long-stay residents whose ability to move independently worsened 12.7%
15% worse than New Jersey average

New Jersey average: 11.0%

Low Risk Residents with Bowel/Bladder Incontinence Info Percent of low risk long-stay residents who lose control of their bowels or bladder 9.2%
42% better than New Jersey average

New Jersey average: 16.0%

Falls with Major Injury Info Percent of long-stay residents experiencing one or more falls with major injury 0.9%
61% better than New Jersey average

New Jersey average: 2.4%

High Risk Residents with Pressure Ulcers Info Percent of long-stay high risk residents with pressure ulcers 7.1%
16% worse than New Jersey average

New Jersey average: 6.1%

Urinary Tract Infection Info Percent of long-stay residents with a urinary tract infection 0.7%
25% better than New Jersey average

New Jersey average: 1.0%

Lost Too Much Weight Info Percent of long-stay residents who lose too much weight 2.7%
41% better than New Jersey average

New Jersey average: 4.6%

Depressive Symptoms Info Percent of long-stay residents who have depressive symptoms 0.8%
93% better than New Jersey average

New Jersey average: 11.3%

Antipsychotic Use Info Percent of long-stay residents who received an antipsychotic medication 22.0%
99% worse than New Jersey average

New Jersey average: 11.1%

Pneumococcal Vaccine Info Percent of long-stay residents assessed and appropriately given the pneumococcal vaccine 85.9%
8% worse than New Jersey average

New Jersey average: 93.0%

Influenza Vaccine Info Percent of long-stay residents assessed and appropriately given the seasonal influenza vaccine 98.2%
In line with New Jersey average

New Jersey average: 97.2%

Short-stay resident measures
Pneumococcal Vaccine Info Percent of short-stay residents assessed and appropriately given the pneumococcal vaccine 72.0%
9% worse than New Jersey average

New Jersey average: 78.9%

Antipsychotic medication increase Info Percent of short-stay residents who newly received an antipsychotic medication 1.6%
41% worse than New Jersey average

New Jersey average: 1.2%

Influenza Vaccine Info Percent of short-stay residents assessed and appropriately given the seasonal influenza vaccine 93.8%
17% better than New Jersey average

New Jersey average: 80.1%

Breakdown by payment type

Medicare

34% of new residents, usually for short-term rehab.

Typical stay 1 - 2 months

Private pay

52% of new residents, often for short stays.

Typical stay 1 months

Medicaid

14% of new residents, often for long-term daily care.

Typical stay 9 - 10 months

Facility Characteristics

Source: CMS Long-Term Care Facility Characteristics (Data as of Jan 2026)

Total residents 137
Medicare
17
12.4% of residents
Medicaid
71
51.8% of residents
Private pay or other
49
35.8% of residents
Programs & Services
Residents Group

Residents meet regularly to discuss policies, care quality, and activities

Active Resident Council

Organized group of residents that meets regularly to discuss facility policies, quality of life, and activities.

Finances and operations

Based on CMS SNF Cost Report for fiscal year ending in 12/2023.

For-profit
Corporation
Net patient revenue Info Net patient revenue — what the home actually collects for resident care, after contractual allowances, bad debt and discounts are subtracted from its gross charges (CMS cost report, Worksheet G-3). It covers resident care only; money the home earns from other sources is shown separately as "Other income."
$17.4M
Net patient income Info Net patient income: net patient revenue minus the home's total operating expenses. A positive figure means it earns more from resident care than it spends to deliver it; a negative figure means the opposite. It excludes non-operating "other income."
-$2.6M
For-profit Corporation
Net patient revenue Info Net patient revenue — what the home actually collects for resident care, after contractual allowances, bad debt and discounts are subtracted from its gross charges (CMS cost report, Worksheet G-3). It covers resident care only; money the home earns from other sources is shown separately as "Other income."
$17.4M Rank #97 / 292Revenue — State benchmarkedThis home is ranked 97th out of 292 homes in New Jersey. Shows this facility's annual revenue compared to the New Jersey average. Higher revenue generally means more resources for staffing and capital — read alongside Payroll %.Rankings are based only on facilities in New Jersey that report data for that category. Facilities without available data are excluded from the ranking.Click the rank badge to see the full State ranking.Click here to see the full State ranking.
Net patient income Info Net patient income: net patient revenue minus the home's total operating expenses. A positive figure means it earns more from resident care than it spends to deliver it; a negative figure means the opposite. It excludes non-operating "other income."
-$2.6M
Other income Info Money the home earns outside of resident care — such as investments, grants, rentals and other non-operating sources (CMS cost report, Worksheet G-3). It is tracked separately from net patient revenue: it is not part of that figure, and it is not included in net patient income.
$14.0K
Payroll costs Info Staff salaries plus wage-related costs — benefits such as payroll taxes, health insurance and retirement — from the home's own accounting records (CMS cost report, Worksheet A). Contract or agency labor is counted separately, under other operating costs. Rank #117 / 292Payroll — State benchmarkedThis home is ranked 117th out of 292 homes in New Jersey. Shows total annual staff payroll benchmarked to the New Jersey average. Higher payroll investment relative to peers often signals better staffing and less reliance on cheaper contract labor.Rankings are based only on facilities in New Jersey that report data for that category. Facilities without available data are excluded from the ranking.Click the rank badge to see the full State ranking.Click here to see the full State ranking.
$9.3M 53.4% of net patient revenue Info Payroll as a share of revenue: staff salaries and wage-related benefits divided by net patient revenue. A higher figure means more of each revenue dollar goes to staff pay. Rank #195 / 292Payroll % — State benchmarkedThis home is ranked 195th out of 292 homes in New Jersey. Shows payroll as a percentage of revenue versus the New Jersey average. Well-run New Jersey facilities typically land around 55–65% — the top third Statewide. Below 25% may signal understaffing or heavy agency use — read with Staffing ratings.Rankings are based only on facilities in New Jersey that report data for that category. Facilities without available data are excluded from the ranking.Click the rank badge to see the full State ranking.Click here to see the full State ranking.
Other operating costs Info Everything it costs to run the home apart from payroll — food, utilities, supplies, maintenance, contract labor and administration. Calculated as total operating expense minus payroll (staff salaries and wage-related benefits).
$10.7M
Total costs Info The home's total operating expense for the year — all the costs of running it, salaries included (CMS cost report, Worksheet G-3).
$20.0M

What does this home offer?

Building type icon
Building type icon

Building Type: Mid-rise

Beauty services icon

Beauty Services

Housekeeping icon
Housekeeping icon

Housekeeping Services

Social and recreational activities icon

Social and Recreational Activities

Rehabilitative support icon

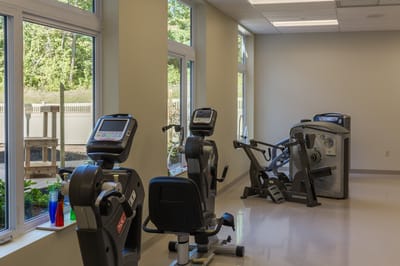
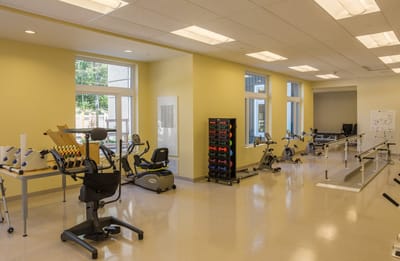
Rehabilitative Support

On-site medical care and health services icon

On-site Medical Care and Health Services

Who this home usually serves

TYPE OF STAY

Mix of rehab and long-term care

This home supports both short-term rehab and long-term care, with residents staying for a wide range of durations.

Most new residents arrive under private pay (52% of admissions), and a typical private pay stay runs around 1 months.

Admissions
640 total

Coverage residents most often arrive under.

Medicare 34%
Private pay 52%
Medicaid 14%
Discharges
651 total

Coverage residents most often leave under.

Medicare 27%
Private pay 52%
Medicaid 21%

Places of interest near Venetian Care & Rehabilitation Center

Address 275 John T O'leary Blvd, South Amboy, NJ 08879

Calculate Travel Distance to Venetian Care & Rehabilitation Center

Add your location

Address

Compare Nursing Homes around Perth Amboy

The information below is reported by the New Jersey Department of Health, Health Facilities Evaluation and Licensing.

3 facilities compared · CMS & NJ Dept. of Health data

Spring Creek Healthcare Center
NH
MC
PC
RC
Perth Amboy (William Dunlap Homes)
179
Facility 179
NJ AVG 125
Rank #99 / 561
67.0%
Facility 67.0%
NJ AVG 77%
Rank #356 / 496
-13%
3.55
Facility 3.55
NJ AVG 3.88
Rank #178 / 294
-6%-8%
$0
Facility $0
NJ AVG $76.4k
Rank #1 / 297
17
Facility 17
NJ AVG 20.9
Rank #113 / 296
3.4
Facility 3.4
NJ AVG 5.3
Rank #69 / 296
3145-
56
Facility 56
NJ AVG 47
Rank #232 / 640
Sam Atlas
$12.9M
Facility $12.9M
NJ AVG $19.6M
Rank #222 / 292
$6.5M
Facility $6.5M
NJ AVG $7.1M
Rank #231 / 292
50.5%
Facility 50.5%
NJ AVG 39.3%
Rank #168 / 292
315305
Alameda Center for Rehabilitation and Healthcare
NH
NC
Perth Amboy
250
Facility 250
NJ AVG 125
Rank #24 / 561
94.6%
Facility 94.6%
NJ AVG 77%
Rank #37 / 496
+23%
4.05
Facility 4.05
NJ AVG 3.88
Rank #69 / 294
-78%+5%
$0
Facility $0
NJ AVG $76.4k
Rank #1 / 297
27
Facility 27
NJ AVG 20.9
Rank #222 / 296
6.8
Facility 6.8
NJ AVG 5.3
Rank #226 / 296
-220-
43
Facility 43
NJ AVG 47
Rank #336 / 640
Alameda Holdings LLC
$25.7M
Facility $25.7M
NJ AVG $19.6M
Rank #54 / 292
$13.6M
Facility $13.6M
NJ AVG $7.1M
Rank #29 / 292
53%
Facility 53%
NJ AVG 39.3%
Rank #63 / 292
315180
Venetian Care & Rehabilitation Center
NH
HC
MC
NC
PC
RC
South Amboy (West Covina)
180
Facility 180
NJ AVG 125
Rank #78 / 561
65.6%
Facility 65.6%
NJ AVG 77%
Rank #371 / 496
-15%
3.20
Facility 3.20
NJ AVG 3.88
Rank #244 / 294
+146%-18%
$56.4k
Facility $56.4k
NJ AVG $76.4k
Rank #243 / 297
29
Facility 29
NJ AVG 20.9
Rank #236 / 296
7.3
Facility 7.3
NJ AVG 5.3
Rank #242 / 296
1150-
49
Facility 49
NJ AVG 47
Rank #296 / 640
Daniel Jacobs
$17.4M
Facility $17.4M
NJ AVG $19.6M
Rank #97 / 292
$9.3M
Facility $9.3M
NJ AVG $7.1M
Rank #117 / 292
53.4%
Facility 53.4%
NJ AVG 39.3%
Rank #195 / 292
315518

Financial Assistance for
Nursing Home in New Jersey

Venetian Care & Rehabilitation Center is located in South Amboy, New Jersey.
Here are the financial assistance programs available to residents in New Jersey.

Get Financial aid guidance

Managed Long Term Services and Supports

NJ Medicaid MLTSS

Age 65+ or disabled
General New Jersey resident, Medicaid- eligible, nursing home-level care need.
Income Limits (2025) ~$2,829/month 300% FBR, individual
Asset Limits $2,000 (individual), $3,000 (couple).
NJ

High urban demand; managed care model.

Benefits
In-home care (5-7 hours/day) Assisted living Respite (240 hours/year) Medical services

JACC (Jersey Assistance for Community Caregiving)

NJ JACC

Age 60+
General New Jersey resident, at risk of nursing home.
Income Limits ~$2,500/month individual, varies
Asset Limits $40,000 individual
NJ

Higher asset limit; limited funding.

Benefits
In-home care (3-5 hours/week) Respite (up to 10 days/year) Home modifications (~$1,000 avg.)

Pharmaceutical Assistance to the Aged and Disabled (PAAD)

New Jersey PAAD

Age 65+
General NJ resident, enrolled in Medicare Part D or eligible.
Income Limits (2025) ~$42,142/year (individual), ~$49,209/year (couple).
Asset Limits Not assessed.
NJ

Copays $5 (generic), $7 (brand); covers Part D premiums up to benchmark.

Benefits
Prescription cost reduction ($500-$1,000/year savings) Premium assistance ($20/month above benchmark)

Senior Gold Prescription Discount Program

New Jersey Senior Gold

Age 65+
General NJ resident, enrolled in Medicare Part D or eligible.
Income Limits (2025) ~$42,142-$52,142/year (individual), ~$49,209-$59,209/year (couple).
Asset Limits Not assessed.
NJ

Copays $15 + 50% of remaining cost; no premium assistance.

Benefits
Prescription cost reduction (~$300-$800/year savings)

Medicare Savings Program (MSP)

New Jersey Medicare Savings Program

Age 65+ or disabled
General NJ resident, Medicare Part A/B.
Income Limits (2025) ~$2,510/month (QMB), ~$3,380/month (SLMB), ~$3,598/month (QI)—individual.
Asset Limits $9,430 (individual), $14,130 (couple).
NJ

Three tiers; no waitlist; includes Extra Help for Part D.

Benefits
Covers Part B premiums ($174.70/month) Deductibles ($240/year) Copays (~20%)

Senior Freeze (Property Tax Reimbursement)

New Jersey Senior Freeze

Age 65+ by Dec 31 prior year
General NJ resident, homeowner, paid property taxes.
Income Limits (2025) ~$150,000/year combined household, projected
Asset Limits Not assessed; home ownership required.
NJ

Combines with ANCHOR/Stay NJ via PAS-1; annual application.

Benefits
Tax reimbursement (~$500-$2,000/year) for increases since base year

ANCHOR (Affordable NJ Communities for Homeowners and Renters)

New Jersey ANCHOR

Age 65+ prioritized
General NJ resident, homeowner/renter, paid property taxes/rent.
Income Limits (2025) ~$150,000/year (homeowners), ~$75,000/year (renters).
Asset Limits Not assessed.
NJ

Combines with Senior Freeze/Stay NJ; broader than prior Homestead program.

Benefits
Tax relief (~$700-$1,500/year homeowners, ~$250-$450 renters)

Stay NJ

New Jersey Stay NJ

Age 65+ by Dec 31 prior year
General NJ resident, homeowner, lived in home 10+ years.
Income Limits (2025) ~$500,000/year projected, subject to final regs
Asset Limits Not assessed; home ownership required.
NJ

Up to 50% tax credit (max $6,500); phased implementation.

Benefits
Tax credit (~$3,000-$6,500/year, projected) starting 2026

Universal Service Fund (USF)

New Jersey Universal Service Fund

Age 65+ prioritized
General NJ resident, utility customer, low-income.
Income Limits (2025) ~$3,970/month individual, 185% FPL
Asset Limits Not assessed; income-focused.
NJ

Must owe >$25 on bill; combines with LIHEAP if eligible.

Benefits
Bill credits (~$300-$1,500/year) to cap energy costs at 6% of income

NJ Family Caregiver Support Program (via NFCSP)

New Jersey Family Caregiver Support Program

Age
General Caregivers of 60+ needing care or 55+ caregivers of others; NJ resident; functional needs (2+ ADLs).
Income Limits (2025) Prioritizes ~$24,980/year (individual); no strict cap.
Asset Limits Not assessed; need-based.
NJ

21 AAAs; rural/low-income priority.

Benefits
Respite (4-6 hours/week or 5 days/year) Adult day care ($60/day) Training Supplies (~$500/year)

VA Aid and Attendance (A&A) and Housebound Benefits

New Jersey VA Aid and Attendance/Housebound

Age 65+ or disabled veteran/spouse
General NJ resident, wartime service, need for ADL help (A&A) or homebound.
Income Limits (2025) Net income < ~$1,984/month (veteran with dependent, A&A); pension offsets income.
Asset Limits ~$155,356 net worth limit
NJ

High veteran demand in urban/rural areas.

Benefits
Cash (~$1,433-$2,642/month veteran, ~$951-$1,318 spouse) for care costs (e.g., in-home, assisted living)

Frequently Asked Questions about Venetian Care & Rehabilitation Center

What neighborhood is Venetian Care & Rehabilitation Center in?

Venetian Care & Rehabilitation Center is in the West Covina neighborhood.

Is Venetian Care & Rehabilitation Center in a walkable area?

Venetian Care & Rehabilitation Center has a walk score of 49. Somewhat walkable. A few nearby services may be reachable on foot, but most trips require transportation.

What is the occupancy rate at Venetian Care & Rehabilitation Center?

Venetian Care & Rehabilitation Center's occupancy is 65.6%.

What is the best email address for Venetian Care & Rehabilitation Center?

The team at Venetian Care & Rehabilitation Center can be reached at admissions@raritanrehab.com.

Does Venetian Care & Rehabilitation Center operate as a for-profit or non-profit?

Venetian Care & Rehabilitation Center is registered as a for-profit.

Are there photos of Venetian Care & Rehabilitation Center?

Yes — there are 7 photos of Venetian Care & Rehabilitation Center in the photo gallery on this page.

What is the address of Venetian Care & Rehabilitation Center?

Venetian Care & Rehabilitation Center is located at 275 John T O'leary Blvd, South Amboy, NJ 08879.

Guides for Better Senior Living

Care Cost Calculator: See Prices in Your Area

Nursing Home Data Explorer

Don’t Wait Too Long: 7 Red Flag Signs Your Parent Needs Assisted Living Now

The True Cost of Assisted Living in 2025 – And How Families Are Paying For It

Understanding Senior Living Costs: Pricing Models, Discounts & Financial Assistance