


Spring Hills Livingston
Assisted Living, Independent Living & Memory Care · Livingston, NJ


Spring Hills Livingston
Assisted Living, Independent Living & Memory Care · Livingston, NJ
Spring Hills Livingston accepts Medicaid and Medicare.
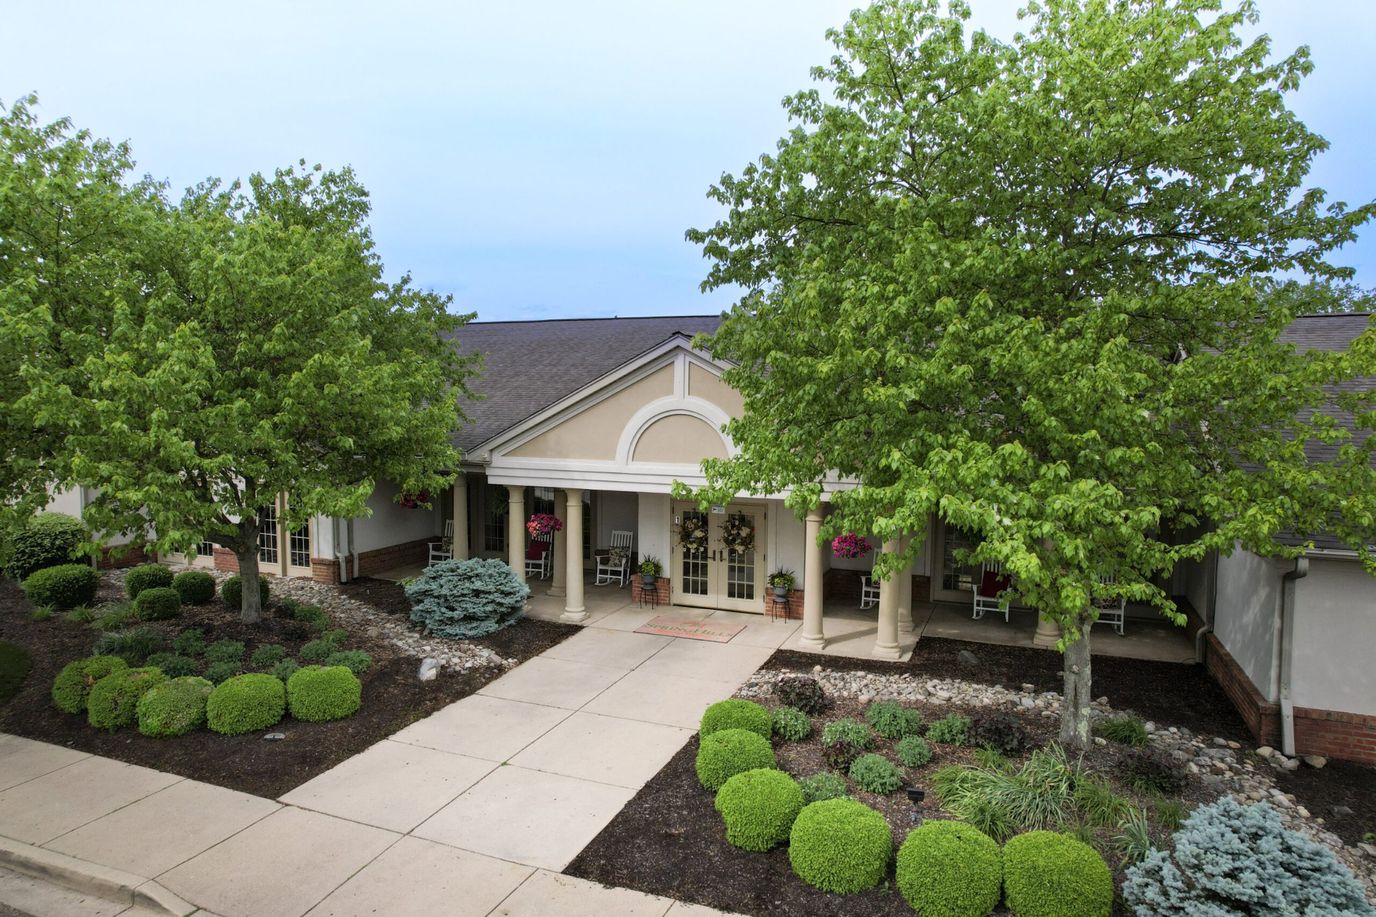
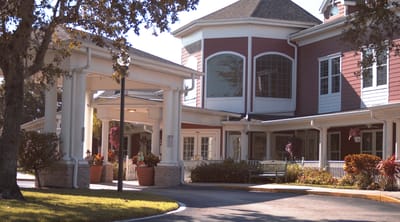
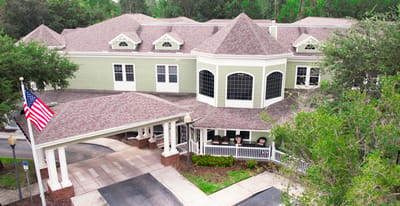
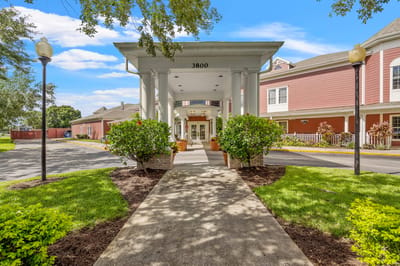
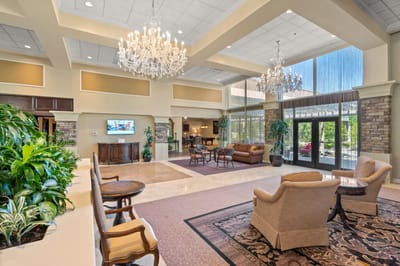
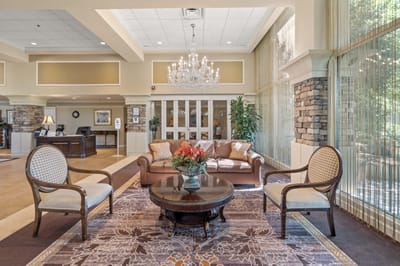
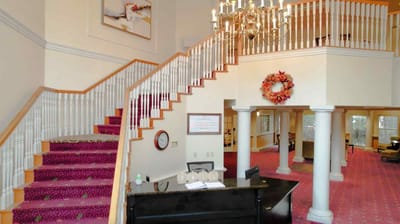
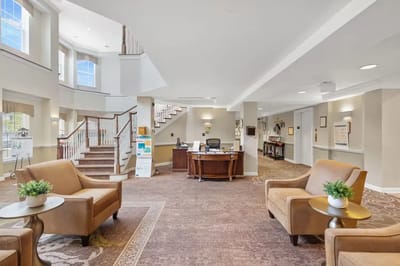
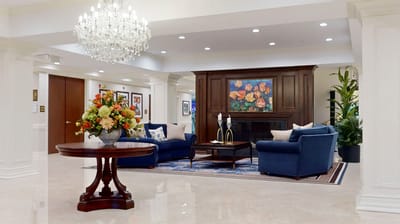
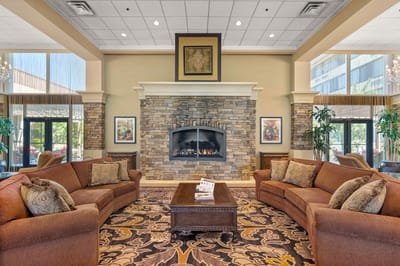
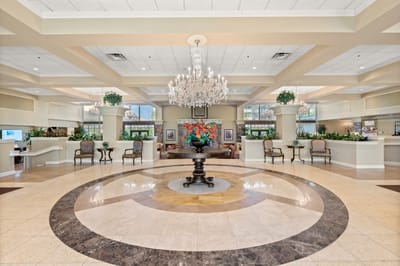
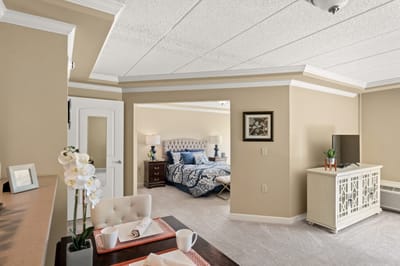
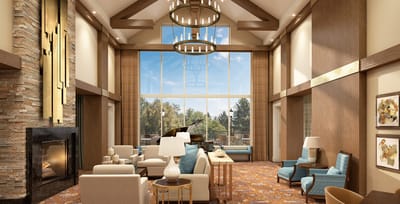
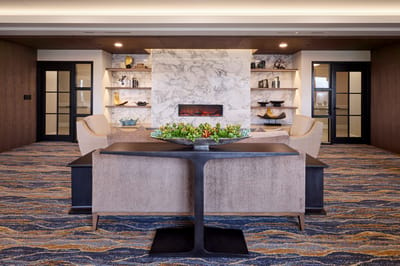
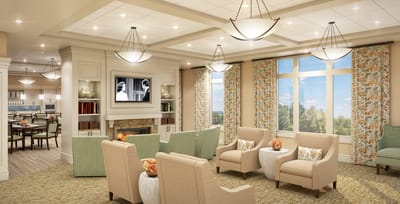
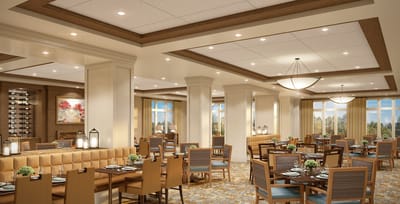
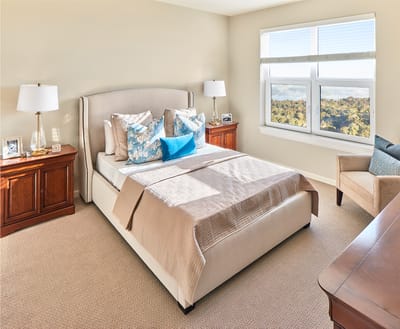
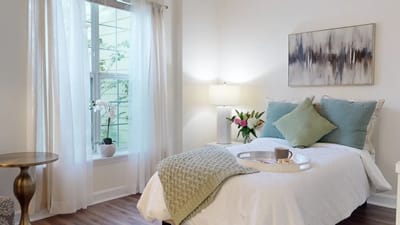
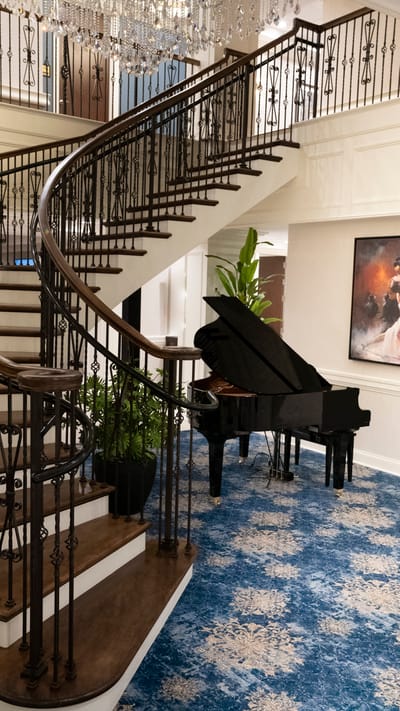
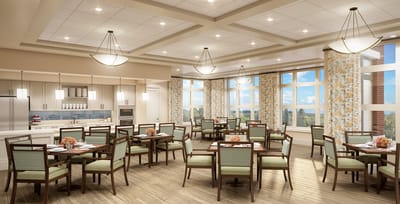
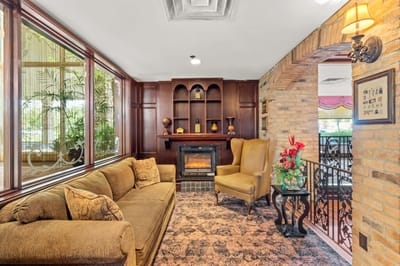
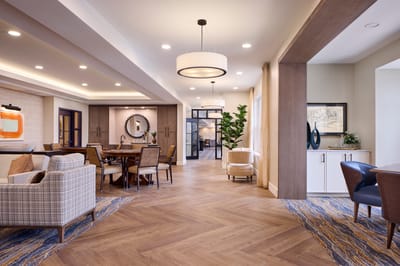
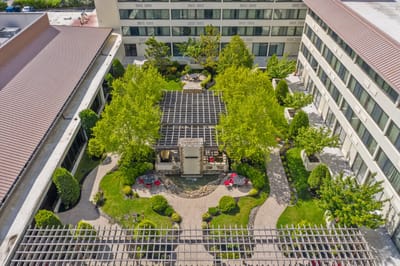
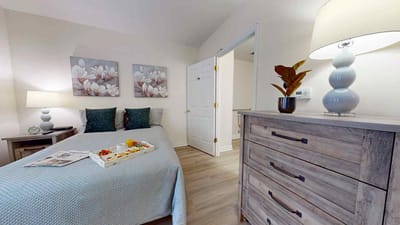
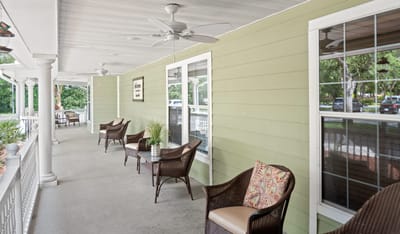
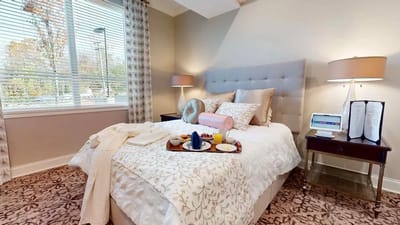
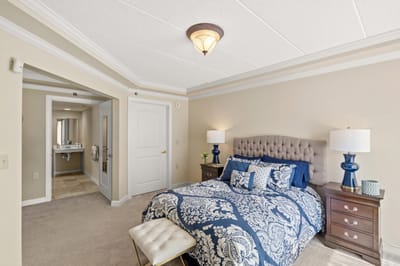
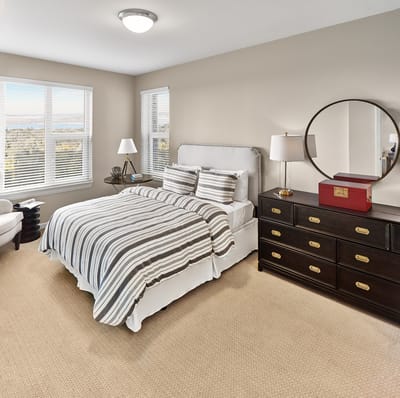
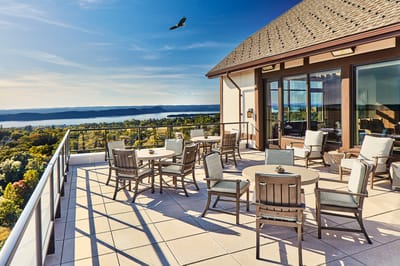
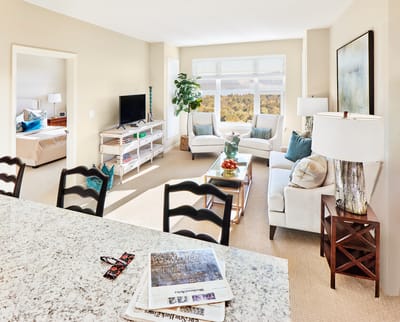
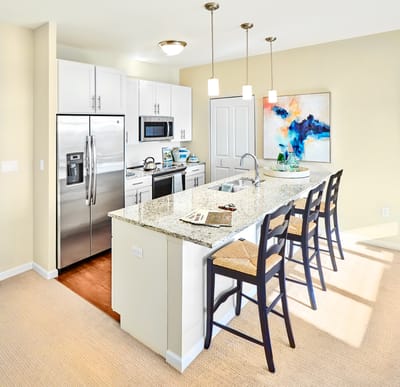
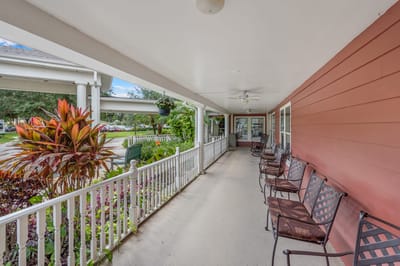
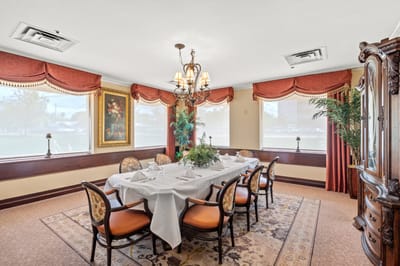
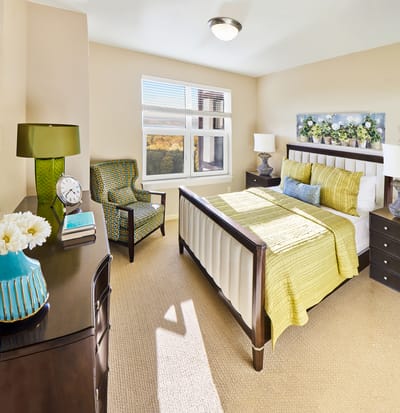
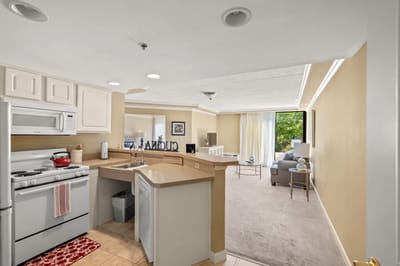
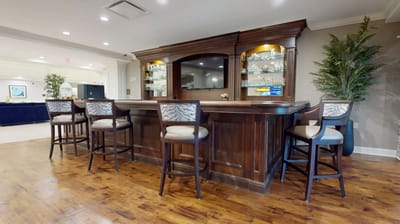
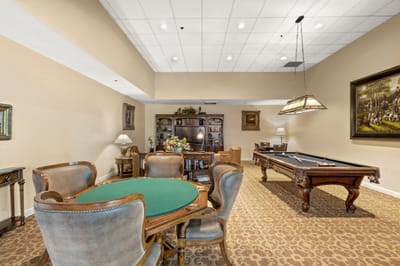
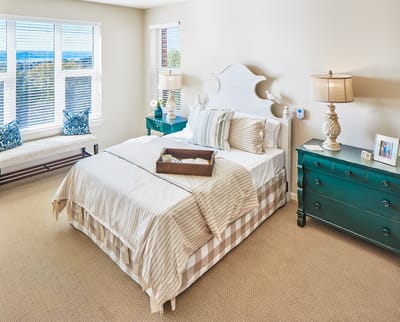
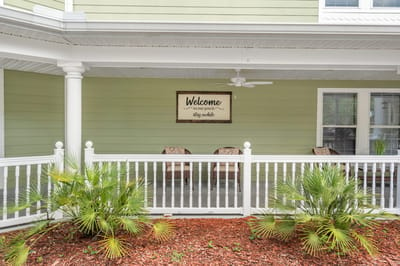
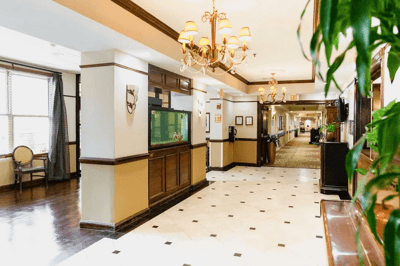
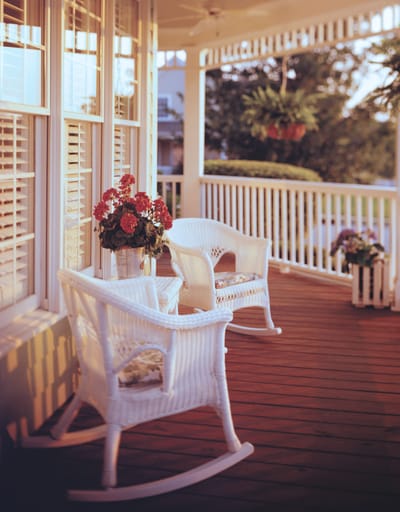
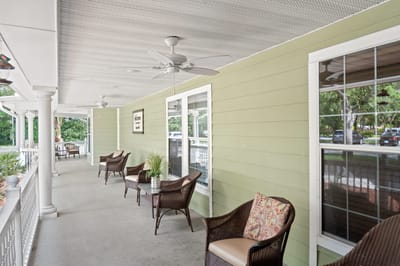
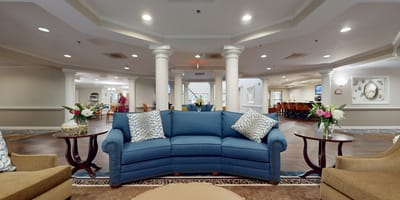
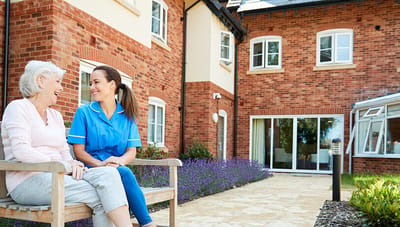
Spring Hills Livingston in New Jersey has been providing care and services to seniors for over 20 years. The community offers a luxurious and elegant atmosphere, with a variety of floor plans to choose from, including studios, one-bedroom, and two-bedroom apartments, each featuring private bathrooms and kitchens. This home strikes a good balance between a peaceful atmosphere and an active environment.
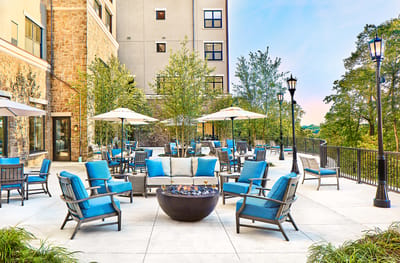
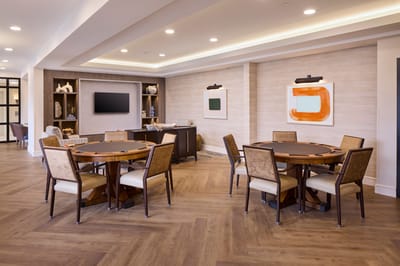
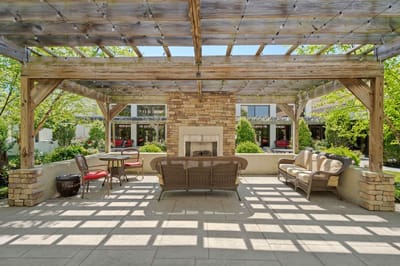
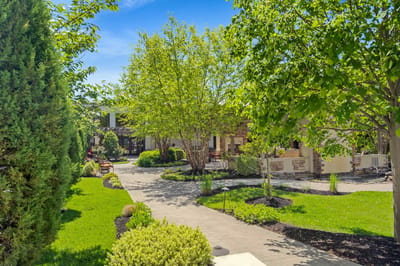
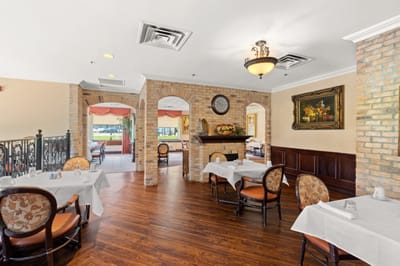
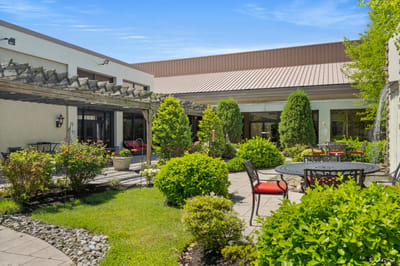
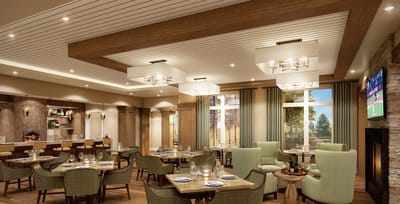
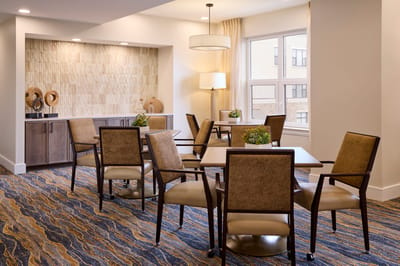
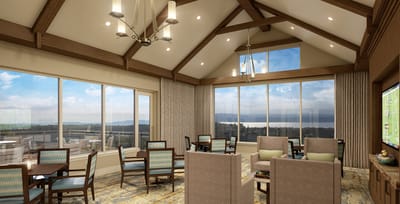
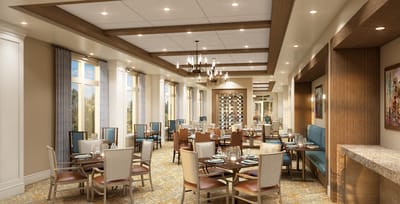
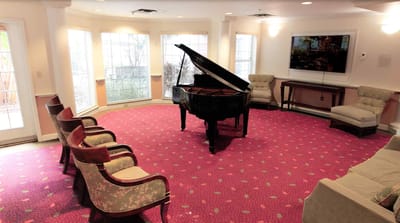
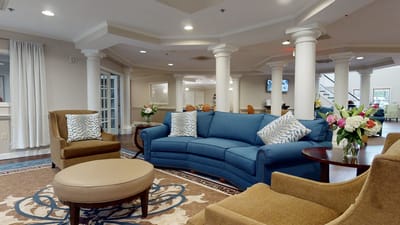
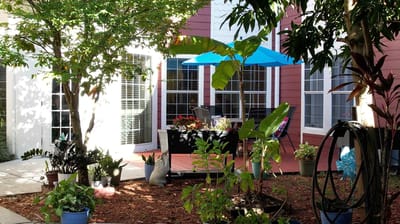
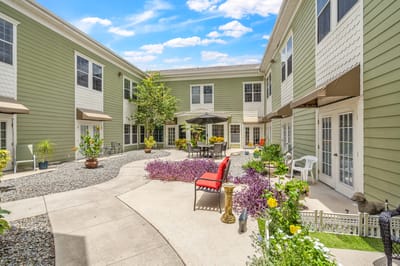
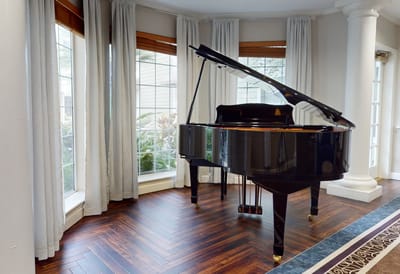
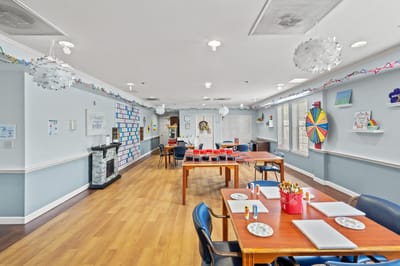
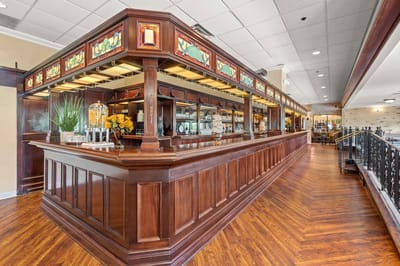
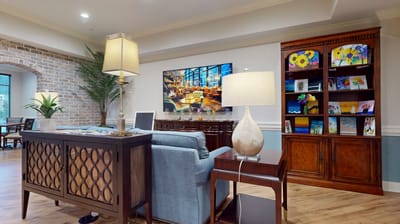
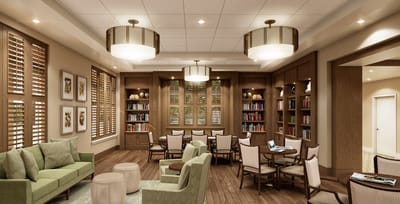
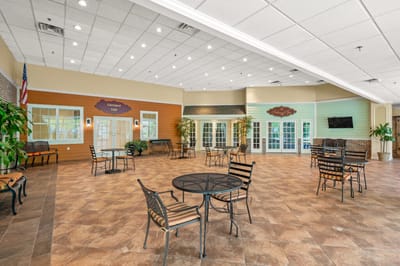
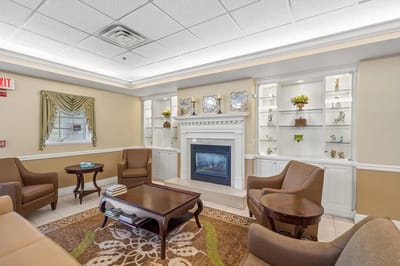
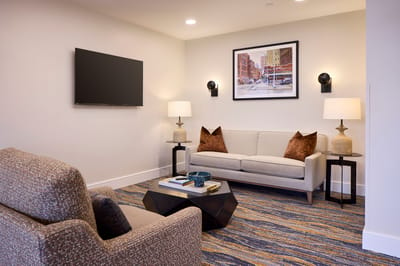
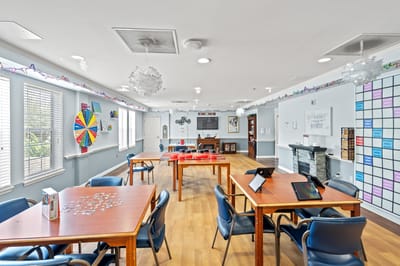
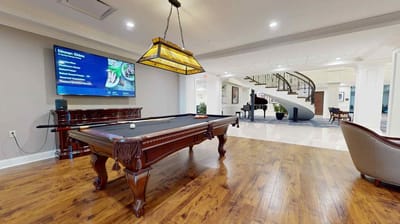
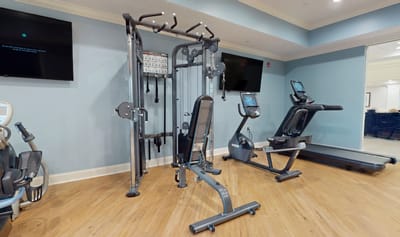
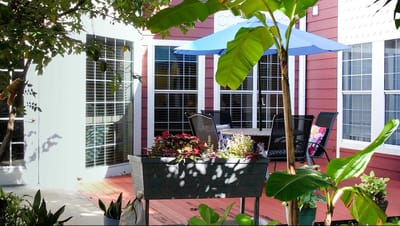
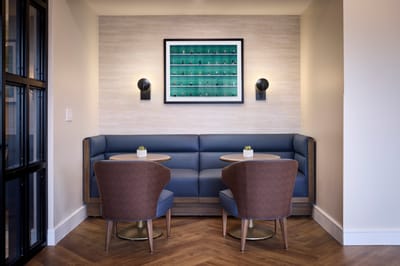
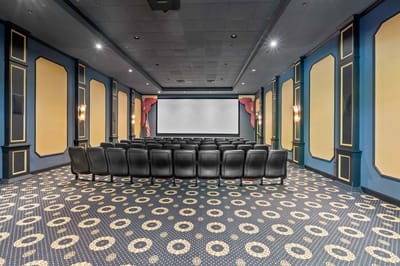
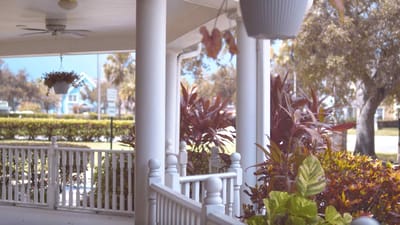
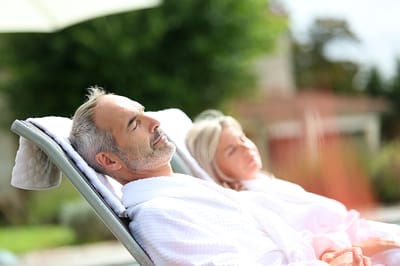
Residents can enjoy a range of amenities such as a tranquil courtyard, social areas to connect with friends, a salon and barber for grooming and pampering, and a movie theater for entertainment. Housekeeping services ensure that residents can relax and enjoy their surroundings, while drivers and valet services are available for easy transportation. The community also offers concierge services to cater to residents’ unique needs and preferences. With its upscale amenities and welcoming environment, Spring Hills Livingston is a perfect choice for seniors looking for a comfortable and fulfilling retirement experience.
150-bed community Rank #145 / 560Bed count — State benchmarkedThis home is ranked 145th out of 560 homes in New Jersey for bed count. Shows this facility's certified or reported bed count compared to other New Jersey facilities. Larger communities may offer more amenities, programs, and on-site services for residents and families.Facilities with the same value for a metric share the same rank. Rankings are based only on facilities in New Jersey that report data for that category. Facilities without available data are excluded from the ranking.Click the rank badge to see the full State ranking.Click here to see the full State ranking.
A larger shared setting that may offer more common spaces and organized community services.
Walk Score: 24 / 100 Rank #481 / 638Walk Score — State benchmarkedThis home is ranked 481st out of 638 homes in New Jersey for walk score. Shows how walkable this facility's neighborhood is compared to the average walk score across New Jersey facilities. Higher scores benefit residents, families, and staff.Facilities with the same value for a metric share the same rank. Rankings are based only on facilities in New Jersey that report data for that category. Facilities without available data are excluded from the ranking.Click the rank badge to see the full State ranking.Click here to see the full State ranking.
Car-dependent. Most errands require a car, with limited nearby walkable options.
About this community
Facility TypeAssisted Living Residence
StatusActive
ExpirationApril 30, 2027
License Number07A022
Spring Hills Livingston is legally operated by Spring Hills Livingston, and administered by Mr. Alexander Markowits.
Officers
Spring Hill Holdings, LLC
Assisted Living
150 units
Total beds
150 units
Accept Medicaid
Accept Medicare
Rehabilitation Services
Respite Care
Nursing Services
24-Hour Staffing
Pets not allowed
HousekeepingYes
Linen ServiceYes
Utilities IncludedYes
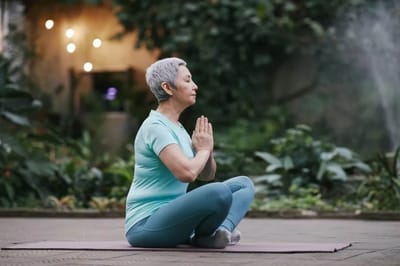
Wellness Program
Branded ProgramsSignature Touches™
Specific Programsenhanced care
Operating HoursMo,Tu,We,Th,Fr,Sa,Su 00:00-23:59
Inspection History
In New Jersey, the Department of Health, Health Facilities Evaluation and Licensing conducts mandatory unannounced surveys to ensure facilities provide safe and effective resident care.
Since 2021 · 5 years of data
1 deficiency
2 inspections
Inspection Scorecard
 This scorecard compares key inspection, deficiency, and complaint metrics at this facility against the New Jersey state average. Metrics rated ≥15% worse than average are highlighted in red; those ≥15% better are highlighted in green.
Since 2021 vs. New Jersey state average
Overall vs. NJ average
0 Worse
No metrics in this bucket.
2 Better
Metrics better than New Jersey average:
• Total deficiencies (94% below)
• Deficiencies per inspection (75% below)
• Total deficiencies (94% below)
• Deficiencies per inspection (75% below)
Deficiencies
| This Facility | NJ Average | vs. NJ Avg |
|---|---|---|---|
|
Total deficiencies
| 1 | 18 | This facility has 94% fewer total deficiencies than a typical New Jersey assisted living residence (1 vs. NJ avg 18).↓ 94% better |
|
Deficiencies per inspection
| 0.5 | 2 | This facility has 75% fewer deficiencies per inspection than a typical New Jersey assisted living residence (0.5 vs. NJ avg 2).↓ 75% better |
Deficiency breakdown
Per-category split of the 1 deficiencies recorded across all inspections. Counts are compared against the New Jersey state average for each category. A green dot means this facility is below the state average for that category; an amber dot means it is above.
1
Routine deficiencies
NJ avg: 18.0
Inspections
| This Facility | NJ Average | vs. NJ Avg |
|---|---|---|---|
|
Total inspections
| 2 | 9 | This facility has had 78% fewer total inspections than the New Jersey average (2 vs. NJ avg 9). More inspections can mean more regulatory scrutiny rather than worse care.↓ 78% fewer |
Inspection Reports Summary
An editor-reviewed summary of the themes and findings across this facility's recent inspection reports.
- November 21, 2025 complaint investigation found failure to administer IV antibiotic for four days, delayed physician notification, and incomplete documentation for Resident 3.
- September 20, 2024 complaint investigation cited 19 deficiencies including inaccurate MDS coding, medication errors, infection control lapses, insufficient staffing, and poor pain management.
- November 27, 2024 COVID-19 focused infection control survey found the facility fully compliant with state regulations and CDC recommended practices.
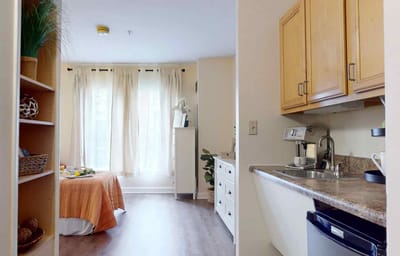
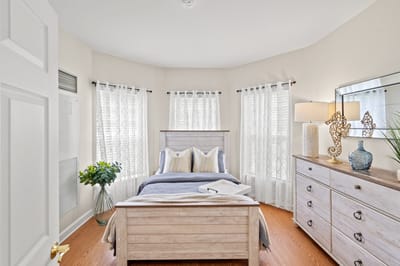
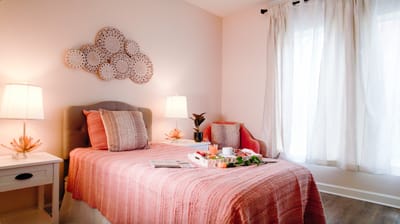
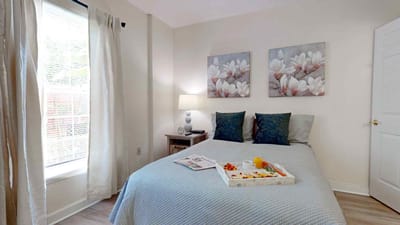
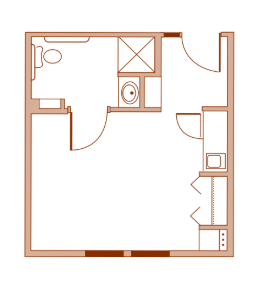
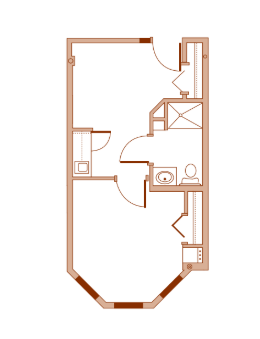
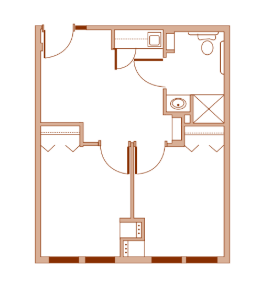
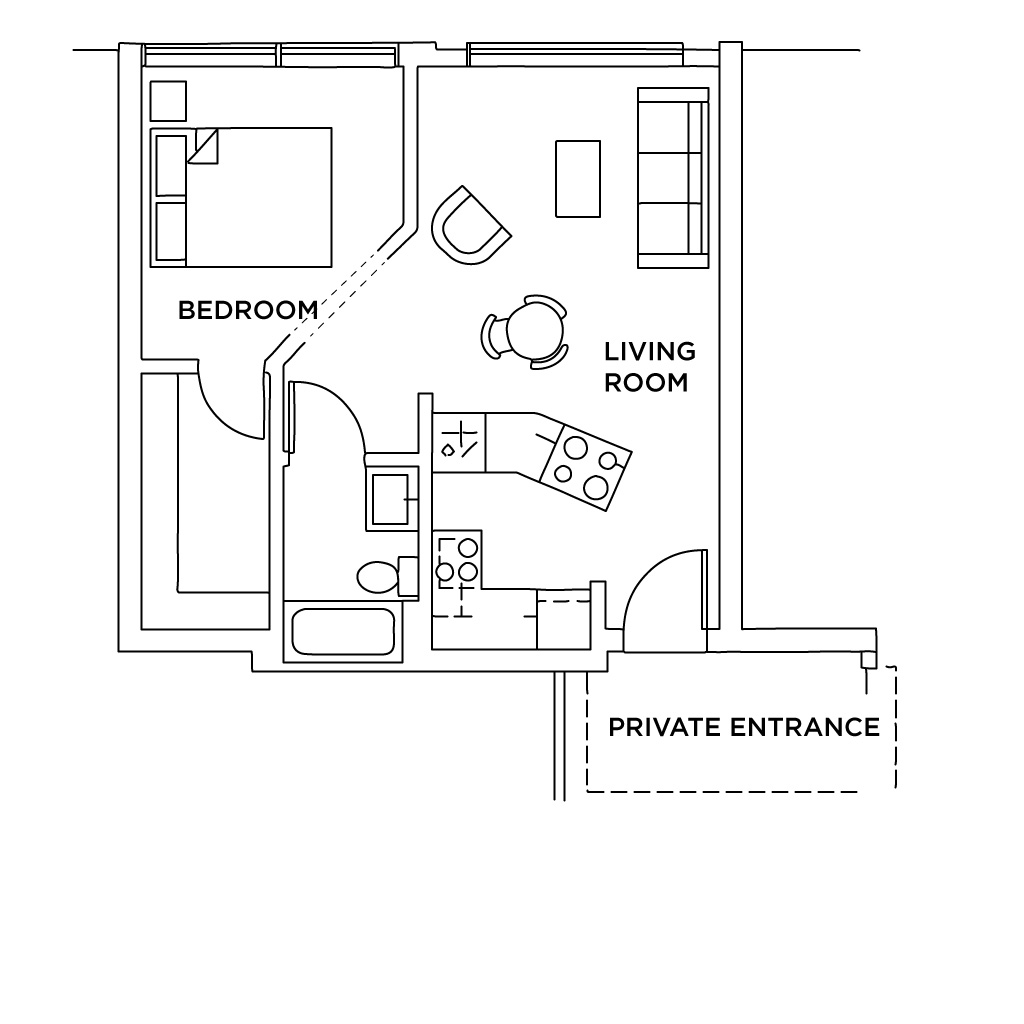
Living Spaces & Floor Plans for Spring Hills Livingston
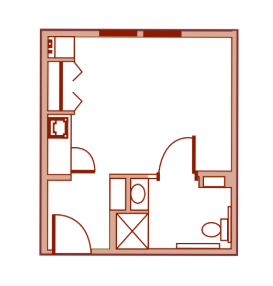
Studio
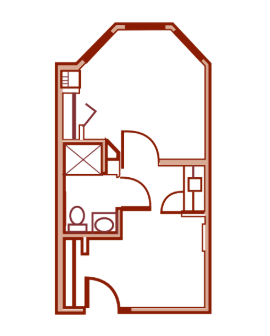
1 Bedroom
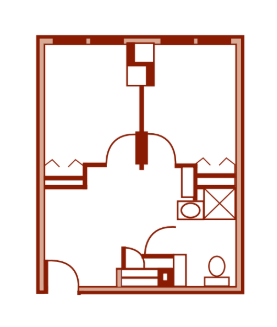
2 bedroom
Studio
1 Bedroom
2 bedroom
Places of interest near Spring Hills Livingston
![]() 1.2 miles from city center
1.2 miles from city center
![]() Estimated distance in miles from Livingston's city center to Spring Hills Livingston's address, calculated via Google Maps.
— 4.64 miles to nearest hospital (Overlook Medical Center)
Estimated distance in miles from Livingston's city center to Spring Hills Livingston's address, calculated via Google Maps.
— 4.64 miles to nearest hospital (Overlook Medical Center)
Calculate Travel Distance to Spring Hills Livingston
Add your location
Compare Assisted Living around Newark
The information below is reported by the New Jersey Department of Health, Health Facilities Evaluation and Licensing.
| Spring Hills Livingston | AL IL MC | Livingston | 150
Facility
150
NJ AVG
125
Rank
#145 / 560 | No |
24
Facility
24
NJ AVG
47
Rank
#481 / 638 | - | Spring Hills Livingston | Mr. Alexander Markowits | 0 | 2 | 0
Facility
0
NJ AVG
3
Rank
#230 / 422 | 35
Facility
35
NJ AVG
18
Rank
#316 / 413 | 17.5
Facility
17.5
NJ AVG
2.0
Rank
#412 / 413 |
| Arbor Terrace Middletown | AL IL MC | Middletown Township (Hendrickson Corners) | 104
Facility
104
NJ AVG
125
Rank
#358 / 560 | Yes |
57
Facility
57
NJ AVG
47
Rank
#225 / 638 | Private Rooms | Arbor Terrace Of Middletown | Ms. Nicole D'andrea | 58.7% | 4 | 2
Facility
2
NJ AVG
3
Rank
#154 / 422 | -
Facility
-
NJ AVG
18
Rank
#1 / 413 | 0.0
Facility
0.0
NJ AVG
2.0
Rank
#1 / 413 |
| Arbor Terrace Roseland | AL MC RC | Roseland | 100
Facility
100
NJ AVG
125
Rank
#367 / 560 | Yes |
34
Facility
34
NJ AVG
47
Rank
#413 / 638 | Studio / 1 Bed / 2 Bed | Benchmark At Roseland | Ms. Shannon Basile | 76.0% | 3 | 1
Facility
1
NJ AVG
3
Rank
#80 / 422 | -
Facility
-
NJ AVG
18
Rank
#1 / 413 | 0.0
Facility
0.0
NJ AVG
2.0
Rank
#1 / 413 |
| The Bristal at Waldwick | AL MC | Waldwick (Wyckoff Avenue) | 93
Facility
93
NJ AVG
125
Rank
#413 / 560 | Yes |
15
Facility
15
NJ AVG
47
Rank
#557 / 638 | Private Rooms / Semi-Private Rooms | The Bristal At Waldwick | Mrs. Colette Peteet | 77.4% | 2 | 2
Facility
2
NJ AVG
3
Rank
#154 / 422 | -
Facility
-
NJ AVG
18
Rank
#1 / 413 | 0.0
Facility
0.0
NJ AVG
2.0
Rank
#1 / 413 |
| Winchester Gardens | AL HC IL MC NH RC SNF | Maplewood (Newark Heights) | 30
Facility
30
NJ AVG
125
Rank
#545 / 560 | Yes |
24
Facility
24
NJ AVG
47
Rank
#481 / 638 | Studio / 1 Bed | Winchester Gardens Health Care Center | Mr. David Weiner | 86.7% | 7 | 2
Facility
2
NJ AVG
3
Rank
#154 / 422 | 19
Facility
19
NJ AVG
18
Rank
#266 / 413 | 2.7
Facility
2.7
NJ AVG
2.0
Rank
#272 / 413 |
Financial Assistance for
Assisted Living in New Jersey
Spring Hills Livingston is located in Livingston, New Jersey.
Here are the financial assistance programs available to residents in New Jersey.
Frequently Asked Questions about Spring Hills Livingston
Is Spring Hills Livingston in a walkable area?
Spring Hills Livingston has a walk score of 24. Car-dependent. Most errands require a car, with limited nearby walkable options.
What is the license number of Spring Hills Livingston?
According to NJ state health department records, Spring Hills Livingston's license number is 07A022.
When does Spring Hills Livingston's license expire?
According to NJ state health department records, Spring Hills Livingston's license expires on April 30, 2027.
Does Spring Hills Livingston have different floorplan options?
Yes — see the floorplan options available at Spring Hills Livingston on this page.
Are pets allowed at Spring Hills Livingston?
No, Spring Hills Livingston has a no-pet policy.
Who is the administrator of Spring Hills Livingston?
Mr. Alexander Markowits is the administrator of Spring Hills Livingston.
How many beds does Spring Hills Livingston have?
Spring Hills Livingston has 150 beds.
Guides for Better Senior Living
Care Cost Calculator: See Prices in Your Area
Assisted Living Explorer
Don’t Wait Too Long: 7 Red Flag Signs Your Parent Needs Assisted Living Now
The True Cost of Assisted Living in 2025 – And How Families Are Paying For It
Understanding Senior Living Costs: Pricing Models, Discounts & Financial Assistance
Updated on
