St James Place Nursing Care Center
Nursing Home, Assisted Living, Independent Living & Memory Care · Baton Rouge, LA
CMS overall rating Info CMS (the Centers for Medicare & Medicaid Services) is the federal agency that rates nursing home quality. Its Overall Rating runs from 1 to 5 stars, combining health inspections, staffing, and quality measures, with inspections weighted most heavily.

St James Place Nursing Care Center

Nursing Home, Assisted Living, Independent Living & Memory Care · Baton Rouge, LA
CMS overall rating Info CMS (the Centers for Medicare & Medicaid Services) is the federal agency that rates nursing home quality. Its Overall Rating runs from 1 to 5 stars, combining health inspections, staffing, and quality measures, with inspections weighted most heavily.
Calculator: See prices in your area
St James Place Nursing Care Center accepts Medicare and private pay.

Overview of St James Place Nursing Care Center

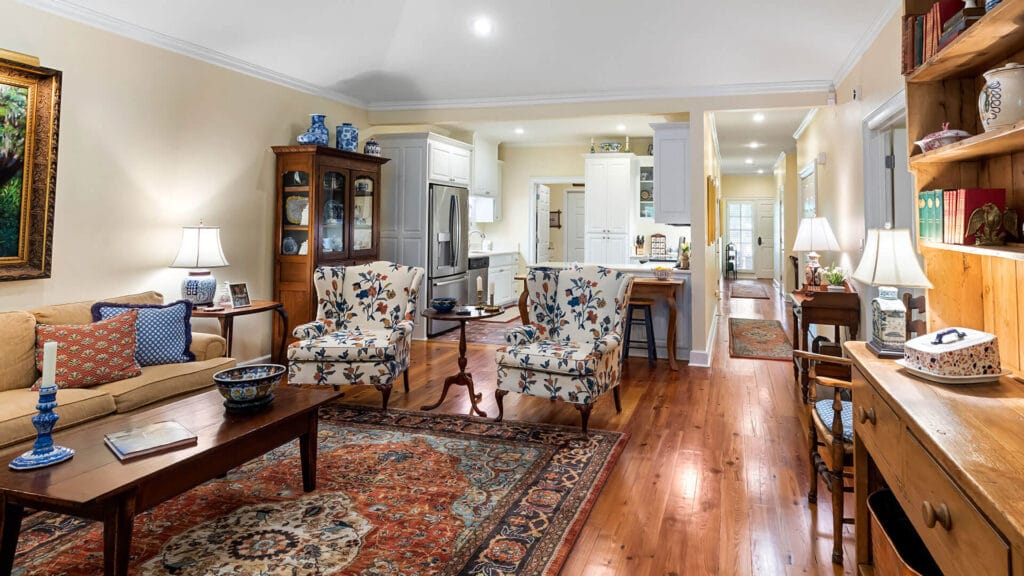
St. James Place Nursing Care Center is a 90-bed skilled nursing and rehabilitation facility located at 333 Lee Drive in Baton Rouge, Louisiana. Operated by Spiritas Senior Services, a nonprofit corporation, the facility is part of a 52-acre retirement campus. Medicare and private pay are accepted; Medicaid is not.

Total adjusted nursing hours are 5 hours and 26 minutes per resident per day, which is 42% above the Louisiana average. Physical therapist hours are 267% above the state average, and LPN hours run 52% above average. However, RN hours are 11% below the state average at 17 minutes per day, and weekend RN hours are 23% below. Quality measures for the facility are in line with state averages.

The Louisiana Department of Health, Health Standards Section, oversees facility inspections. The Health Inspection sub-rating is approximately 24% below the Louisiana average. No civil money penalties or payment denials appear in available reports, and the facility maintains a citations-per-inspection rate of zero. Current occupancy is 89.3%, which is higher than the state average of 71.8%.

The campus offers independent living, assisted living, and memory care alongside skilled nursing. Clinical programs include rehabilitation and wellness activities such as resident-led clubs and live music. The dining program provides daily meals prepared on-site. Specific details regarding monthly pricing are not reported in the available source data, so families should request these details during a tour.

Families seeking a nonprofit, campus-style environment with high total nursing and therapy staffing may find this setting suitable. Families evaluating St. James Place Nursing Care Center should ask directly about findings driving the below-average health inspection rating and confirm that those issues have been addressed before making a placement decision.

Quality ratings

Measured by Centers for Medicare & Medicaid Services (CMS)

Overall rating Info The Overall CMS Rating combines results from health inspections, staffing levels and quality measures. Health inspections carry the most weight. Staffing and quality scores can increase or decrease the final rating based on performance compared to state and national standards.
▼ 16.7% Below LA avg. ▼ 16.7% Below LA avg.LA average: 2.4Click the badge to see the full State ranking.Click here to see the full State ranking.
Health Inspection Info Based on the results of the facility's three most recent standard inspections and any complaint investigations. CMS reviews the number, scope, and severity of deficiencies, with more recent findings weighted more heavily.
▼ 27.6% Below LA avg. ▼ 27.6% Below LA avg.LA average: 2.8Click the badge to see the full State ranking.Click here to see the full State ranking.
Staffing Info Measures average nursing staff hours per resident per day, including Registered Nurses (RNs) and total nursing staff. Ratings are adjusted based on the level of care residents require and are compared to state and national benchmarks.
▲ 66.5% Above LA avg. ▲ 66.5% Above LA avg.LA average: 2.4Click the badge to see the full State ranking.Click here to see the full State ranking.
Quality Measures Info Based on clinical and physical health indicators reported to CMS, such as hospital readmissions, falls, pressure ulcers, and improvements in mobility. These measures reflect how well residents' health needs are being managed.
At LA avg. At LA avg.LA average: 2.0Click the badge to see the full State ranking.Click here to see the full State ranking.

Staffing hours breakdown

Info Daily nursing hours per resident by staff type, reported to CMS. Higher is generally better — compare this facility to state and national averages to see where staffing stands.

Hours per resident per day — compared to Louisiana state averages

Total nursing care / resident Info This home is ranked 6th out of 199 homes in Louisiana for nurse hours. Total adjusted nursing hours per resident per day, combining RN, LPN, and aide time. CMS adjusts this for case-mix so facilities can be fairly compared.
5h 26m per day
Rank #6 / 199Nurse hours — State benchmarkedThis home is ranked 6th out of 199 homes in Louisiana. Shows adjusted nurse hours per resident per day benchmarked to the Louisiana average, with a ranking across 199 Louisiana facilities. More hours mean more direct care. The national average is about 3.5 hrs; below 3.0 is a red flag.Rankings are based only on facilities in Louisiana that report data for that category. Facilities without available data are excluded from the ranking.Click the rank badge to see the full State ranking.Click here to see the full State ranking.
This facility Louisiana avg (4h 9m per day)
vs Louisiana avg
+31%

2 of 6 metrics below state avg

Standout metric Physical Therapist is +264% above state avg
Staff typeHours / Day / Residentvs state avg
Registered Nurse (RN) Info RNs hold the highest nursing license and can assess residents, interpret test results, and direct care plans. More RN hours per day often signals stronger clinical oversight and faster response to health changes. 16m per day ▼ 17% State avg: 19m per day · National avg: 41m per day
LPN / LVN Info Licensed Practical Nurses (LPNs) or Licensed Vocational Nurses (LVNs) deliver routine hands-on care — medication administration, wound dressing, and monitoring vital signs. They work under RN supervision and make up a large share of daily bedside care. 1h 52m per day ▲ 57% State avg: 1h 11m per day · National avg: 52m per day
Nurse Aide Info Certified Nurse Aides (CNAs) provide the most direct day-to-day assistance: bathing, dressing, feeding, and mobility. Nurse aide hours are typically the largest staffing category and directly affect residents' quality of life. 2h 31m per day ▲ 9% State avg: 2h 19m per day · National avg: 2h 20m per day
Weekend Total Nursing Info Combined nursing hours (RN + LPN + Nurse Aide) per resident per day on weekends. Staffing often drops on weekends — this figure reveals whether the facility maintains adequate coverage outside of weekday hours. 4h 1m per day ▲ 23% State avg: 3h 16m per day · National avg: 3h 26m per day
Physical Therapist Info Hours per resident per day provided by licensed Physical Therapists (PTs) or PT Assistants. PT services help residents recover mobility after injury or illness and are especially important for post-acute (short-stay) rehabilitation. 11m per day ▲ 264% State avg: 3m per day · National avg: 4m per day
Weekend RN Info Registered nurse hours specifically on weekends. Facilities sometimes reduce RN presence on Saturdays and Sundays — a low weekend RN figure compared to weekday hours can indicate reduced clinical oversight when most administrative staff are absent. 9m per day ▼ 29% State avg: 13m per day · National avg: 28m per day

Capacity and availability

Avg. Length of Stay
120 days
Bed community size
90-bed community Rank #192 / 262Bed count — State benchmarkedThis home is ranked 192nd out of 262 homes in Louisiana. Shows this facility's certified or reported bed count compared to other Louisiana facilities. Larger communities may offer more amenities, programs, and on-site services for residents and families.Rankings are based only on facilities in Louisiana that report data for that category. Facilities without available data are excluded from the ranking.Click the rank badge to see the full State ranking.Click here to see the full State ranking.
A larger shared setting that may offer more common spaces and organized community services.
Walk Score
Walk Score: 67 / 100 Rank #42 / 368Walk Score — State benchmarkedThis home is ranked 42nd out of 368 homes in Louisiana. Shows how walkable this facility's neighborhood is compared to the average Walk Score across Louisiana facilities. Higher scores benefit residents, families, and staff.Rankings are based only on facilities in Louisiana that report data for that category. Facilities without available data are excluded from the ranking.Click the rank badge to see the full State ranking.Click here to see the full State ranking.
Moderately walkable. Some errands can be accomplished on foot, with a mix of nearby amenities.

About this community

Awards

2025 Best Independent Living community by U.S. News & World Report
two Emblem Awards for high performing scores in Food & Dining and Activities & Enrichment.

License Details

Facility TypeMedicare
CountyE. Baton Rouge
CMS Certification Number195410

Ownership & Operating Entity

Owner NameSpiritas Senior Services
Profit StatusNonprofit

Therapy & Rehabilitation

1 service
Rehabilitation Services

Amenities & Lifestyle

Vibrant Activities
Exceptional Dining
Holistic Wellness
ActivitiesDaily wellness activities, resident-led clubs, live music, and celebrations
Specific ProgramsPrograms & Classes, Wellness & Fitness, Area Attractions

Performance summary

Key indicators of commitment to quality care and safety.

Ratings

Overall Rating
2 / 5

Based on the Louisiana Department of Health, Health Standards Section surveys measuring health inspections, staffing, and quality measures.

Ranked 63rd (tied) of 161 homes in Louisiana See full Louisiana ranking
Health Inspection Rating
2 / 5

Based on the Louisiana Department of Health, Health Standards Section surveys measuring health inspection findings. Fewer deficiencies result in higher ratings.

Ranked 84th (tied) of 161 homes in Louisiana See full Louisiana ranking
Quality Measures Rating
2 / 5

Based on the Louisiana Department of Health, Health Standards Section surveys measuring resident health outcomes and care practices.

Ranked 39th (tied) of 157 homes in Louisiana See full Louisiana ranking
Staffing Rating
4 / 5

Based on the Louisiana Department of Health, Health Standards Section surveys measuring staffing levels, including hours of care provided per resident per day.

Ranked 1st (tied) of 161 homes in Louisiana See full Louisiana ranking

Contact St James Place Nursing Care Center

Inspection History

In Louisiana, the Department of Health, Health Standards Section performs unannounced onsite surveys to verify that healthcare providers meet both state licensing and federal safety rules.

Since 2023 · 3 years of data 22 deficiencies 6 inspections

Inspection Scorecard Info This scorecard compares key inspection, deficiency, and complaint metrics at this facility against the Louisiana state average. Metrics rated ≥15% worse than average are highlighted in red; those ≥15% better are highlighted in green.

Since 2023 vs. Louisiana state average
Overall vs. LA average 0 Worse No metrics in this bucket. 4 Better Metrics better than Louisiana average:
• Total deficiencies (31% below)
• Deficiencies per year (32% below)
• Deficiencies per inspection (8% below)
• Total inspections (25% below)
Latest Inspection January 8, 2026 Annual Inspection

Deficiencies Info Deficiencies are formal regulatory issues recorded during state inspections.

This FacilityLA Averagevs. LA Avg
Total deficiencies Info Formal regulatory issues recorded by inspectors across all inspection types. 2232 This facility has 31% fewer total deficiencies than a typical Louisiana nursing home (22 vs. LA avg 32).↓ 31% better
Deficiencies per year Info Average deficiencies per year since 2023. 7.310.7 This facility has 32% fewer deficiencies per year than a typical Louisiana nursing home (7.3 vs. LA avg 10.7).↓ 32% better
Deficiencies per inspection Info Average deficiencies per inspection. 3.74 This facility has 8% fewer deficiencies per inspection than a typical Louisiana nursing home (3.7 vs. LA avg 4).↓ 8% better

Inspections Info State inspections evaluate whether the facility meets health and safety standards.

This FacilityLA Averagevs. LA Avg
Total inspections Info Combined count of all routine and focused inspections. Excludes complaint investigations. 68 This facility has 25% fewer total inspections than a typical Louisiana nursing home (6 vs. LA avg 8).↓ 25% better

Health Inspection History

Inspections since 2023
Total health inspections 4

Louisiana average 6.5


Last Health inspection on Jun 2025

Total health citations
21 Rank #81 / 204Health citations — State benchmarkedThis home is ranked 81st out of 204 homes in Louisiana. Shows this facility's total health deficiency citations benchmarked to the Louisiana State average, with a ranking across all 204 LA facilities. Lower citation counts earn a better rank.Rankings are based only on facilities in Louisiana that report data for that category. Facilities without available data are excluded from the ranking.Click the rank badge to see the full State ranking.Click here to see the full State ranking.

Louisiana average 25.7

Citations per inspection
5.25 Rank #166 / 204Citations per inspection — State benchmarkedThis home is ranked 166th out of 204 homes in Louisiana. Shows average deficiency citations per CMS inspection for this facility versus the Louisiana mean across 204 facilities with citation data. Lower is better.Rankings are based only on facilities in Louisiana that report data for that category. Facilities without available data are excluded from the ranking.Click the rank badge to see the full State ranking.Click here to see the full State ranking.

Louisiana average 3.95


Health citations are formal notices following inspections when they fail to comply with safety and care standards.

20 of 21 citations resulted from standard inspections; and 1 of 21 resulted from complaint investigations.

Breakdown of citation severity (last 3 years)
Critical health citations
3
173% worse than Louisiana average

Louisiana average: 1.1


Serious health citations
0
100% better than Louisiana average

Louisiana average: 0.5

3 critical citations Louisiana average: 1.1

0 serious citations Louisiana average: 0.5

18 moderate citations Louisiana average: 23.7

0 minor citations Louisiana average: 0.4
Citations history (last 3 years)
Administration moderate citation Jun 25, 2025
Corrected

Infection Control moderate citation Jun 25, 2025
Corrected

Infection Control moderate citation Jun 25, 2025
Corrected

Infection Control moderate citation Jun 25, 2025
Corrected

Staffing Data

Reporting period: October 1 – December 31, 2025 (Q4 2025). Source: CMS Payroll-Based Journal report.

Total staff 134
Employees 81
Contractors 53
Staff to resident ratio 2.31 : 1
54% more staff per resident than Louisiana average
Louisiana average ratio: 1.50 : 1 Louisiana average ratio: 1.50 : 1See full Louisiana ranking
Avg staff/day 36
Average shift 8.5 hours
0% compared with Louisiana average
Louisiana average: 8.2 hours Louisiana average shift: 8.2 hoursSee full Louisiana ranking
Total staff hours (quarter) 28,296

Nursing staff breakdown

Q4 2025 · Oct 1 – Dec 31 More info This data comes from the CMS Payroll-Based Journal report covering October 1 – December 31, 2025.
Registered Nurse

Manages medical care and health needs.

RN Staff Info All 5 RN Staff are full-time employees. No contractors work on this role. 5
Average shift length Info Average shift length. Calculated as total hours divided by days worked and average staff per day. 8.1 hours
Licensed Practical Nurse

Assists with medical care and medications.

LPN Staff Info 37 total: 28 full-time employees and 9 contractors. 37
Average shift length Info Average shift length. Calculated as total hours divided by days worked and average staff per day. 10.1 hours
Certified Nursing Assistant

Helps with daily care and mobility.

CNA Staff Info 63 total: 39 full-time employees and 24 contractors. 63
Average shift length Info Average shift length. Calculated as total hours divided by days worked and average staff per day. 8.8 hours

Contractor staffing

Q4 2025 · Oct 1 – Dec 31 More info This data comes from the CMS Payroll-Based Journal report covering October 1 – December 31, 2025.

Total hours from contractors

11.2%

3,161 contractor hours this quarter

Certified Nursing Assistant: 24 Licensed Practical Nurse: 9 Therapeutic Recreation Specialist: 6 Respiratory Therapy Technician: 5 Feeding Assistant: 2 Physical Therapy Assistant: 2 Speech Language Pathologist: 1 Qualified Social Worker: 1 Occupational Therapy Assistant: 1 Medical Director: 1 Occupational Therapy Aide: 1

Staff by category

Q4 2025 · Oct 1 – Dec 31 More info This data comes from the CMS Payroll-Based Journal report covering October 1 – December 31, 2025.
Certified Nursing Assistant39246313,04192100%8.8
Licensed Practical Nurse289377,82292100%10.1
RN Director of Nursing4041,8186571%8.3
Respiratory Therapy Technician0559436672%7.6
Dental Services Staff1014886166%8
Physical Therapy Assistant0224766571%7.3
Nurse Practitioner1014725964%8
Registered Nurse5054705863%8.1
Administrator1014565762%8
Dietitian1014325459%8
Clinical Nurse Specialist1014135257%7.9
Speech Language Pathologist0113985459%7.4
Therapeutic Recreation Specialist0663975459%4.2
Qualified Social Worker0113365964%5.7
Feeding Assistant0221674043%3.9
Medical Director011962426%4
Occupational Therapy Aide0114789%5.9
Occupational Therapy Assistant011251820%1.4
63 Certified Nursing Assistant
% of Days 100%
37 Licensed Practical Nurse
% of Days 100%
4 RN Director of Nursing
% of Days 71%
5 Respiratory Therapy Technician
% of Days 72%
1 Dental Services Staff
% of Days 66%
2 Physical Therapy Assistant
% of Days 71%
1 Nurse Practitioner
% of Days 64%
5 Registered Nurse
% of Days 63%
1 Administrator
% of Days 62%
1 Dietitian
% of Days 59%
1 Clinical Nurse Specialist
% of Days 57%
1 Speech Language Pathologist
% of Days 59%
6 Therapeutic Recreation Specialist
% of Days 59%
1 Qualified Social Worker
% of Days 64%
2 Feeding Assistant
% of Days 43%
1 Medical Director
% of Days 26%
1 Occupational Therapy Aide
% of Days 9%
1 Occupational Therapy Assistant
% of Days 20%

Penalties and fines

Includes penalties issued in 2024

Federal penalties imposed by CMS for regulatory violations, including civil money penalties (fines) and denials of payment for new Medicare/Medicaid admissions.

Source: CMS Penalties Database (Data as of Jan 2026)

Total fines amount $72K Rank #154 / 204Federal fines — State benchmarkedThis home is ranked 154th out of 204 homes in Louisiana. Shows this facility's cumulative CMS federal fine dollars versus the Louisiana average among facilities with fines, and where it ranks among 204 facilities in the pool. Lower total dollars mean a better rank.Rankings are based only on facilities in Louisiana that report data for that category. Facilities without available data are excluded from the ranking.Click the rank badge to see the full State ranking.Click here to see the full State ranking.
30% lower than Louisiana average

Louisiana average: $103K

Number of fines 1
51% fewer fines than Louisiana average

Louisiana average: 2.0

Payment Denials Info Serious action where Medicare and/or Medicaid temporarily stops payments for new residents until issues are fixed. 1
226% more payment denials than Louisiana average

Louisiana average: 0.3

Fines amount comparison
This facility $72K
Louisiana average $103K
Penalty History

Penalties are imposed by CMS for violations of federal nursing home regulations.

2 penalties in the past 3 years

Multiple penalties were reported in the last 3 years.

Civil Money Penalty Info Fines imposed for noncompliance, which can be assessed per day or per instance of violation. May 31, 2024
$72K
Payment Denial Info Serious action where Medicare and/or Medicaid temporarily stops payments for new residents until issues are fixed. May 31, 2024
5 days

Last updated: Jan 2026

Quality of care over time

These measures show how residents usually do over time at this home, based on health outcomes and preventive care.

High-risk clinical events score Info A composite score based on pressure ulcers, falls with injury, weight loss, walking ability decline, and activities of daily living decline. 18.2
55% worse than Louisiana average

Louisiana average: 11.7

Functional decline score Info A composite score based on activities of daily living decline, walking ability decline, and incontinence. 33.1
63% worse than Louisiana average

Louisiana average: 20.4

Long-stay resident measures
Below average Louisiana avg: 2.2 Info CMS star rating based on long-stay quality measure performance. 5 stars = significantly above average, 1 star = significantly below average.
Need for Help with Daily Activities Increased Info Percent of long-stay residents whose need for help with daily activities has increased 34.3%
67% worse than Louisiana average

Louisiana average: 20.5%

Walking Ability Worsened Info Percent of long-stay residents whose ability to move independently worsened 37.7%
60% worse than Louisiana average

Louisiana average: 23.5%

Low Risk Residents with Bowel/Bladder Incontinence Info Percent of low risk long-stay residents who lose control of their bowels or bladder 27.4%
61% worse than Louisiana average

Louisiana average: 17.1%

Falls with Major Injury Info Percent of long-stay residents experiencing one or more falls with major injury 3.4%
In line with Louisiana average

Louisiana average: 3.5%

High Risk Residents with Pressure Ulcers Info Percent of long-stay high risk residents with pressure ulcers 13.2%
108% worse than Louisiana average

Louisiana average: 6.4%

Urinary Tract Infection Info Percent of long-stay residents with a urinary tract infection 6.9%
154% worse than Louisiana average

Louisiana average: 2.7%

Lost Too Much Weight Info Percent of long-stay residents who lose too much weight 2.5%
51% better than Louisiana average

Louisiana average: 5.1%

Depressive Symptoms Info Percent of long-stay residents who have depressive symptoms 0.0%
100% better than Louisiana average

Louisiana average: 1.6%

Antipsychotic Use Info Percent of long-stay residents who received an antipsychotic medication 20.6%
In line with Louisiana average

Louisiana average: 20.4%

Pneumococcal Vaccine Info Percent of long-stay residents assessed and appropriately given the pneumococcal vaccine 96.0%
5% better than Louisiana average

Louisiana average: 91.5%

Influenza Vaccine Info Percent of long-stay residents assessed and appropriately given the seasonal influenza vaccine 91.1%
In line with Louisiana average

Louisiana average: 94.9%

Hospitalizations per 1,000 days Info Number of hospitalizations per 1,000 long-stay resident days. 0.88
66% better than Louisiana average

Louisiana average: 2.61

ED visits per 1,000 days Info Number of outpatient emergency department visits per 1,000 long-stay resident days. 1.41
49% better than Louisiana average

Louisiana average: 2.77

Short-stay resident measures
Below average Louisiana avg: 2.0 Info CMS star rating based on short-stay quality measure performance. 5 stars = much above average, 1 star = much below average.
Pneumococcal Vaccine Info Percent of short-stay residents assessed and appropriately given the pneumococcal vaccine 93.3%
13% better than Louisiana average

Louisiana average: 82.5%

Antipsychotic medication increase Info Percent of short-stay residents who newly received an antipsychotic medication 0.4%
86% better than Louisiana average

Louisiana average: 3.1%

Influenza Vaccine Info Percent of short-stay residents assessed and appropriately given the seasonal influenza vaccine 87.5%
15% better than Louisiana average

Louisiana average: 76.2%

Re-hospitalized after SNF stay Info Percentage of short-stay residents who were re-hospitalized after their nursing home admission. 47.0%
69% worse than Louisiana average

Louisiana average: 27.8%

Emergency department visits Info Percentage of short-stay residents who had an outpatient emergency department visit. 20.0%
36% worse than Louisiana average

Louisiana average: 14.7%

Falls with major injury Info Percentage of SNF residents who experience falls with major injury during their stay. 4.2%
449% worse than Louisiana average

Louisiana average: 0.8%

Ability to care for self at discharge Info Percentage of residents at or above expected ability to care for themselves at discharge. 37.5%
30% worse than Louisiana average

Louisiana average: 53.7%

Successful return to home or community Info Rate of successful return to home or community from a skilled nursing facility. 61.1%
21% better than Louisiana average

Louisiana average: 50.6%

Breakdown by payment type

Medicare

38% of new residents, usually for short-term rehab.

Typical stay 23 days

Private pay

63% of new residents, often for short stays.

Typical stay 5 - 6 months

Facility Characteristics

Source: CMS Long-Term Care Facility Characteristics (Data as of Jan 2026)

Total residents 58
Medicare
11
19% of residents
Private pay or other
47
81% of residents
Programs & Services
Residents Group

Residents meet regularly to discuss policies, care quality, and activities

CCRC

Part of a Continuing Care Retirement Community offering multiple care levels

Active Resident Council

Organized group of residents that meets regularly to discuss facility policies, quality of life, and activities.

Finances and operations

Based on CMS SNF Cost Report for fiscal year ending in 12/2023.

Nonprofit
Nonprofit Corporation
Net patient revenue Info Net patient revenue — what the home actually collects for resident care, after contractual allowances, bad debt and discounts are subtracted from its gross charges (CMS cost report, Worksheet G-3). It covers resident care only; money the home earns from other sources is shown separately as "Other income."
$5.8M
Net patient income Info Net patient income: net patient revenue minus the home's total operating expenses. A positive figure means it earns more from resident care than it spends to deliver it; a negative figure means the opposite. It excludes non-operating "other income."
-$10.1M
Nonprofit Nonprofit Corporation
Net patient revenue Info Net patient revenue — what the home actually collects for resident care, after contractual allowances, bad debt and discounts are subtracted from its gross charges (CMS cost report, Worksheet G-3). It covers resident care only; money the home earns from other sources is shown separately as "Other income."
$5.8M Rank #1 / 203Revenue — State benchmarkedThis home is ranked 1st out of 203 homes in Louisiana. Shows this facility's annual revenue compared to the Louisiana average. Higher revenue generally means more resources for staffing and capital — read alongside Payroll %.Rankings are based only on facilities in Louisiana that report data for that category. Facilities without available data are excluded from the ranking.Click the rank badge to see the full State ranking.Click here to see the full State ranking.
Net patient income Info Net patient income: net patient revenue minus the home's total operating expenses. A positive figure means it earns more from resident care than it spends to deliver it; a negative figure means the opposite. It excludes non-operating "other income."
-$10.1M
Other income Info Money the home earns outside of resident care — such as investments, grants, rentals and other non-operating sources (CMS cost report, Worksheet G-3). It is tracked separately from net patient revenue: it is not part of that figure, and it is not included in net patient income.
$26.0M
Payroll costs Info Staff salaries plus wage-related costs — benefits such as payroll taxes, health insurance and retirement — from the home's own accounting records (CMS cost report, Worksheet A). Contract or agency labor is counted separately, under other operating costs. Rank #5 / 203Payroll — State benchmarkedThis home is ranked 5th out of 203 homes in Louisiana. Shows total annual staff payroll benchmarked to the Louisiana average. Higher payroll investment relative to peers often signals better staffing and less reliance on cheaper contract labor.Rankings are based only on facilities in Louisiana that report data for that category. Facilities without available data are excluded from the ranking.Click the rank badge to see the full State ranking.Click here to see the full State ranking.
$8.5M 145.5% of net patient revenue Info Payroll as a share of revenue: staff salaries and wage-related benefits divided by net patient revenue. A higher figure means more of each revenue dollar goes to staff pay. Rank #203 / 203Payroll % — State benchmarkedThis home is ranked 203rd out of 203 homes in Louisiana. Shows payroll as a percentage of revenue versus the Louisiana average. Well-run Louisiana facilities typically land around 54–67% — the top third Statewide. Below 25% may signal understaffing or heavy agency use — read with Staffing ratings.Rankings are based only on facilities in Louisiana that report data for that category. Facilities without available data are excluded from the ranking.Click the rank badge to see the full State ranking.Click here to see the full State ranking.
Other operating costs Info Everything it costs to run the home apart from payroll — food, utilities, supplies, maintenance, contract labor and administration. Calculated as total operating expense minus payroll (staff salaries and wage-related benefits).
$7.5M
Total costs Info The home's total operating expense for the year — all the costs of running it, salaries included (CMS cost report, Worksheet G-3).
$16.0M

Who this home usually serves

TYPE OF STAY

Primarily short stays

Residents typically stay for brief periods, with frequent admissions and discharges throughout the year.

Most new residents arrive under private pay (63% of admissions), and a typical private pay stay runs around 5 - 6 months.

Admissions
176 total

Coverage residents most often arrive under.

Medicare 38%
Private pay 63%
Discharges
174 total

Coverage residents most often leave under.

Medicare 31%
Private pay 69%

Places of interest near St James Place Nursing Care Center

Address 4.2 miles from city center Info Estimated distance in miles from Baton Rouge's city center to St James Place Nursing Care Center's address, calculated via Google Maps.

Calculate Travel Distance to St James Place Nursing Care Center

Add your location

Address

Compare Nursing Homes around Baton Rouge

The information below is reported by the Louisiana Department of Health, Health Standards Section.

5 facilities compared · CMS & LA Dept. of Health data

Landmark South Nursing and Rehabilitation Center
NH
HC
MC
PC
Baton Rouge (Saint George)
144
Facility 144
LA AVG 113
Rank #63 / 262
93.8%
Facility 93.8%
LA AVG 71.8%
Rank #15 / 204
+31%
3.87
Facility 3.87
LA AVG 4.14
Rank #101 / 199
-19%-7%
$10.0k
Facility $10.0k
LA AVG $107.9k
Rank #101 / 204
12
Facility 12
LA AVG 25.7
Rank #22 / 204
2.4
Facility 2.4
LA AVG 3.9
Rank #17 / 204
1139A+
38
Facility 38
LA AVG 37
Rank #178 / 368
James Smith
$15.0M
Facility $15.0M
LA AVG $9.6M
Rank #52 / 203
$6.8M
Facility $6.8M
LA AVG $3.9M
Rank #14 / 203
45.5%
Facility 45.5%
LA AVG 42%
Rank #29 / 203
195480
St James Place Nursing Care Center
NH
AL
IL
MC
Baton Rouge (Highlands/Perkins)
90
Facility 90
LA AVG 113
Rank #192 / 262
--
5.43
Facility 5.43
LA AVG 4.14
Rank #6 / 199
-21%+31%
$72.5k
Facility $72.5k
LA AVG $107.9k
Rank #154 / 204
21
Facility 21
LA AVG 25.7
Rank #81 / 204
5.3
Facility 5.3
LA AVG 3.9
Rank #166 / 204
315-
67
Facility 67
LA AVG 37
Rank #42 / 368
Gary Field
$5.8M
Facility $5.8M
LA AVG $9.6M
Rank #1 / 203
$8.5M
Facility $8.5M
LA AVG $3.9M
Rank #5 / 203
145.5%
Facility 145.5%
LA AVG 42%
Rank #203 / 203
195410
Flannery Oaks Guest House
NH
HC
PC
Baton Rouge (Park Forest/La North)
130
Facility 130
LA AVG 113
Rank #85 / 262
71.5%
Facility 71.5%
LA AVG 71.8%
Rank #108 / 204
0%
3.22
Facility 3.22
LA AVG 4.14
Rank #173 / 199
-100%-22%
$0
Facility $0
LA AVG $107.9k
Rank #1 / 204
34
Facility 34
LA AVG 25.7
Rank #156 / 204
5.7
Facility 5.7
LA AVG 3.9
Rank #180 / 204
-106A+
19
Facility 19
LA AVG 37
Rank #282 / 368
Donnie Hodges
$7.7M
Facility $7.7M
LA AVG $9.6M
Rank #171 / 203
$3.7M
Facility $3.7M
LA AVG $3.9M
Rank #115 / 203
48.9%
Facility 48.9%
LA AVG 42%
Rank #14 / 203
195477
The Pines Retirement Center
NH
AL
IL
Baton Rouge (Broadmoor/Sherwood Forest)
45
Facility 45
LA AVG 113
Rank #247 / 262
54.8%
Facility 54.8%
LA AVG 71.8%
Rank #166 / 204
-24%
4.57
Facility 4.57
LA AVG 4.14
Rank #30 / 199
-32%+10%
$175.0k
Facility $175.0k
LA AVG $107.9k
Rank #182 / 204
73
Facility 73
LA AVG 25.7
Rank #200 / 204
4.9
Facility 4.9
LA AVG 3.9
Rank #158 / 204
356A+
21
Facility 21
LA AVG 37
Rank #271 / 368
Joel Stewart
$5.7M
Facility $5.7M
LA AVG $9.6M
Rank #177 / 203
$2.3M
Facility $2.3M
LA AVG $3.9M
Rank #187 / 203
40.3%
Facility 40.3%
LA AVG 42%
Rank #119 / 203
195512
White Oak Post Acute Care
NH
Baton Rouge (Eastgate)
176
Facility 176
LA AVG 113
Rank #19 / 262
52.3%
Facility 52.3%
LA AVG 71.8%
Rank #177 / 204
-27%
3.94
Facility 3.94
LA AVG 4.14
Rank #101 / 199
-53%-5%
$567.8k
Facility $567.8k
LA AVG $107.9k
Rank #204 / 204
90
Facility 90
LA AVG 25.7
Rank #204 / 204
6.4
Facility 6.4
LA AVG 3.9
Rank #194 / 204
894A+
53
Facility 53
LA AVG 37
Rank #83 / 368
Keira Juge
$8.2M
Facility $8.2M
LA AVG $9.6M
Rank #134 / 203
$3.9M
Facility $3.9M
LA AVG $3.9M
Rank #131 / 203
47.8%
Facility 47.8%
LA AVG 42%
Rank #89 / 203
195488

Financial Assistance for
Nursing Home in Louisiana

St James Place Nursing Care Center is located in BATON ROUGE, Louisiana.
Here are the financial assistance programs available to residents in Louisiana.

Get Financial aid guidance

Community Choices Waiver

Louisiana Medicaid Community Choices

Age 65+ or 21+ with disability
General Louisiana resident, Medicaid- eligible, nursing home-level care need.
Income Limits (2025) ~$2,829/month 300% FBR, individual
Asset Limits $2,000 (individual), $3,000 (couple).
LA

High demand in urban areas.

Benefits
In-home care (5-7 hours/day) Respite (240 hours/year) Home modifications Transitional support

Louisiana Elderly and Disabled Adults Program

LA EDA Program

Age 60+
General Louisiana resident, at risk of nursing home.
Income Limits ~$1,800/month varies
Asset Limits $5,000 individual
LA

Limited funding; rural focus.

Benefits
In-home care (3-5 hours/week) Respite (up to 10 days/year) Transportation (~5 trips/month)

Long Term-Personal Care Services (LT-PCS)

Louisiana Medicaid Long Term-Personal Care Services

Age 65+ or disabled
General Louisiana resident, Medicaid-eligible, needs ADL assistance.
Income Limits (2025) $943/month (individual), $1,415/month (couple).
Asset Limits $2,000 (individual), $3,000 (couple).
LA

Medically Needy Spend-Down option available.

Benefits
ADL/IADL assistance (20-32 hours/week, varies by need)

Program of All-Inclusive Care for the Elderly (PACE)

Louisiana PACE

Age 55+
General Louisiana resident, Medicare/Medicaid-eligible, nursing home-level care need, safe community living possible.
Income Limits (2025) No strict limit; Medicaid portion $2,901/month max.
Asset Limits $2,000 (individual) for Medicaid; none for Medicare-only.
LA

Limited centers (e.g., Baton Rouge, Lafayette).

Benefits
Adult day care Medical care Personal care Transportation Drugs Respite

Adult Day Health Care (ADHC) Waiver

Louisiana Medicaid Adult Day Health Care Waiver

Age 65+ or 22-64 with disabilities
General Louisiana resident, Medicaid-eligible, nursing home-level care need.
Income Limits (2025) $2,901/month 300% FBR, individual
Asset Limits $2,000 (individual), $3,000 (couple).
LA

Includes transitional support from nursing homes.

Benefits
Adult day care (up to 8 hours/day, 5 days/week) Personal care Respite Transitional aid

Aged, Blind, and Disabled (ABD) Medicaid

Louisiana Medicaid Aged, Blind, and Disabled Program

Age 65+
General blind, or disabled, Louisiana resident, Medicaid-eligible.
Income Limits (2025) $943/month (individual), $1,415/month (couple).
Asset Limits $2,000 (individual), $3,000 (couple).
LA

Medically Needy Spend-Down available.

Benefits
Personal care Adult day care Limited in-home supports

Louisiana Elderly Protective Services (EPS)

Louisiana Governor’s Office of Elderly Affairs - Elderly Protective Services

Age 60+
General Louisiana resident, experiencing abuse/neglect/exploitation.
Income Limits (2025) No strict limit; prioritizes low-income.
Asset Limits None specified.
LA

Focus on urban and rural elder abuse cases.

Benefits
Emergency care Temporary housing Legal aid Care coordination (varies by case)

Senior Rx Program

Louisiana Senior Rx (Prescription Assistance)

Age 65+
General Louisiana resident, no/low prescription coverage.
Income Limits (2025) Varies by linked program; ~$30,000/year suggested.
Asset Limits None specified.
LA

Bridges gaps in Medicare Part D coverage.

Benefits
Prescription cost reduction (up to 50% discounts) Application assistance

Veterans Aid and Attendance (A&A) Benefit

Louisiana VA Aid and Attendance (Federal/State Coordination)

Age
General Wartime veteran or spouse, age 65+ or disabled, needs ADL help, Louisiana resident.
Income Limits (2025) Net income minus medical expenses < $1,984/month individual with A&A
Asset Limits ~$155,356 2025 net worth limit
LA

High veteran population in rural areas.

Benefits
Cash benefit ($1,478-$2,471/month individual, varies by status) for care costs

Frequently Asked Questions about St James Place Nursing Care Center

What neighborhood is St James Place Nursing Care Center in?

St James Place Nursing Care Center is in the Highlands/Perkins neighborhood of BATON ROUGE.

Who is the owner of St James Place Nursing Care Center?

St James Place Nursing Care Center is legally operated by Spiritas Senior Services.

Is St James Place Nursing Care Center in a walkable area?

St James Place Nursing Care Center has a walk score of 67. Moderately walkable. Some errands can be accomplished on foot, with a mix of nearby amenities.

What is the occupancy rate at St James Place Nursing Care Center?

St James Place Nursing Care Center's occupancy is 89.3%.

Does St James Place Nursing Care Center operate as a for-profit or non-profit?

St James Place Nursing Care Center is registered as a non-profit in LA.

What is the overall rating for St James Place Nursing Care Center?

St James Place Nursing Care Center received a 2-star overall rating from the CMS (Centers for Medicare and Medicaid Services). This score combines results from staffing levels, quality measures, and health inspections.

How many beds does St James Place Nursing Care Center have?

St James Place Nursing Care Center has 90 beds.

Guides for Better Senior Living

Care Cost Calculator: See Prices in Your Area

Nursing Home Data Explorer

Don’t Wait Too Long: 7 Red Flag Signs Your Parent Needs Assisted Living Now

The True Cost of Assisted Living in 2025 – And How Families Are Paying For It

Understanding Senior Living Costs: Pricing Models, Discounts & Financial Assistance