Explore Open Rooms

1 Contact details
2 What type of senior care service are you looking for?
3 What budget do you have in mind for senior care?
4 How soon do you need to find care?
5 Additional details

Thank you for your interest!

Our team will be in touch shortly to help with next steps.

Nursing Home in Jefferson City

CMS overall rating Info The Overall CMS Rating combines results from health inspections, staffing levels and quality measures. Health inspections carry the most weight. Staffing and quality scores can increase or decrease the final rating based on performance compared to state and national standards.

Stonebridge Villa Marie

1030 Edmonds St, Jefferson City, MO 65109 View map
Overview of Stonebridge Villa Marie

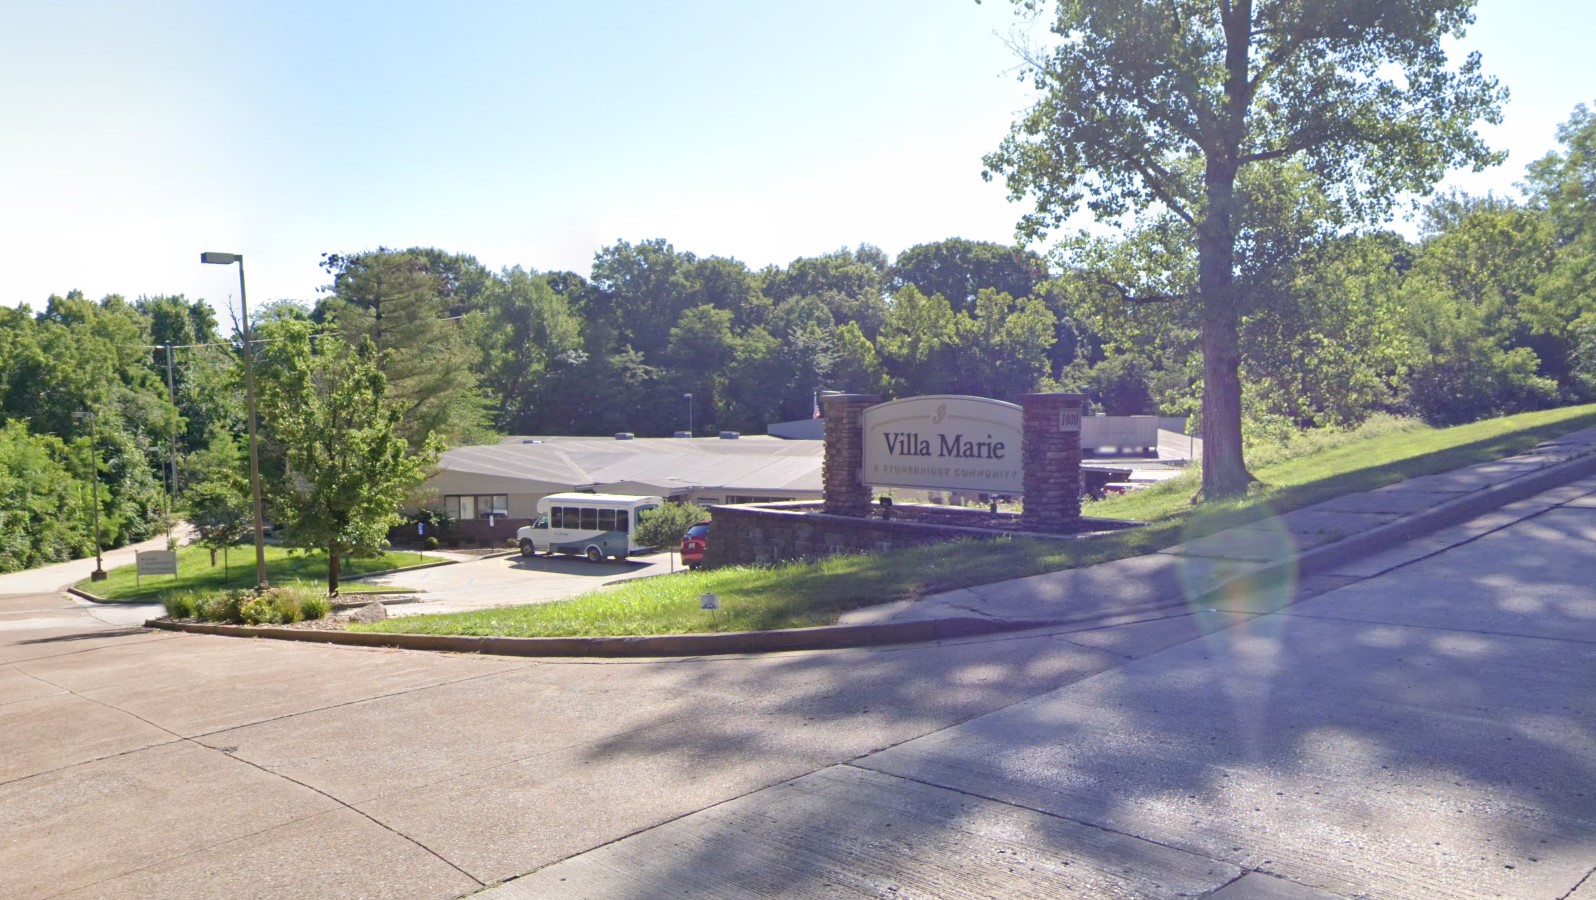
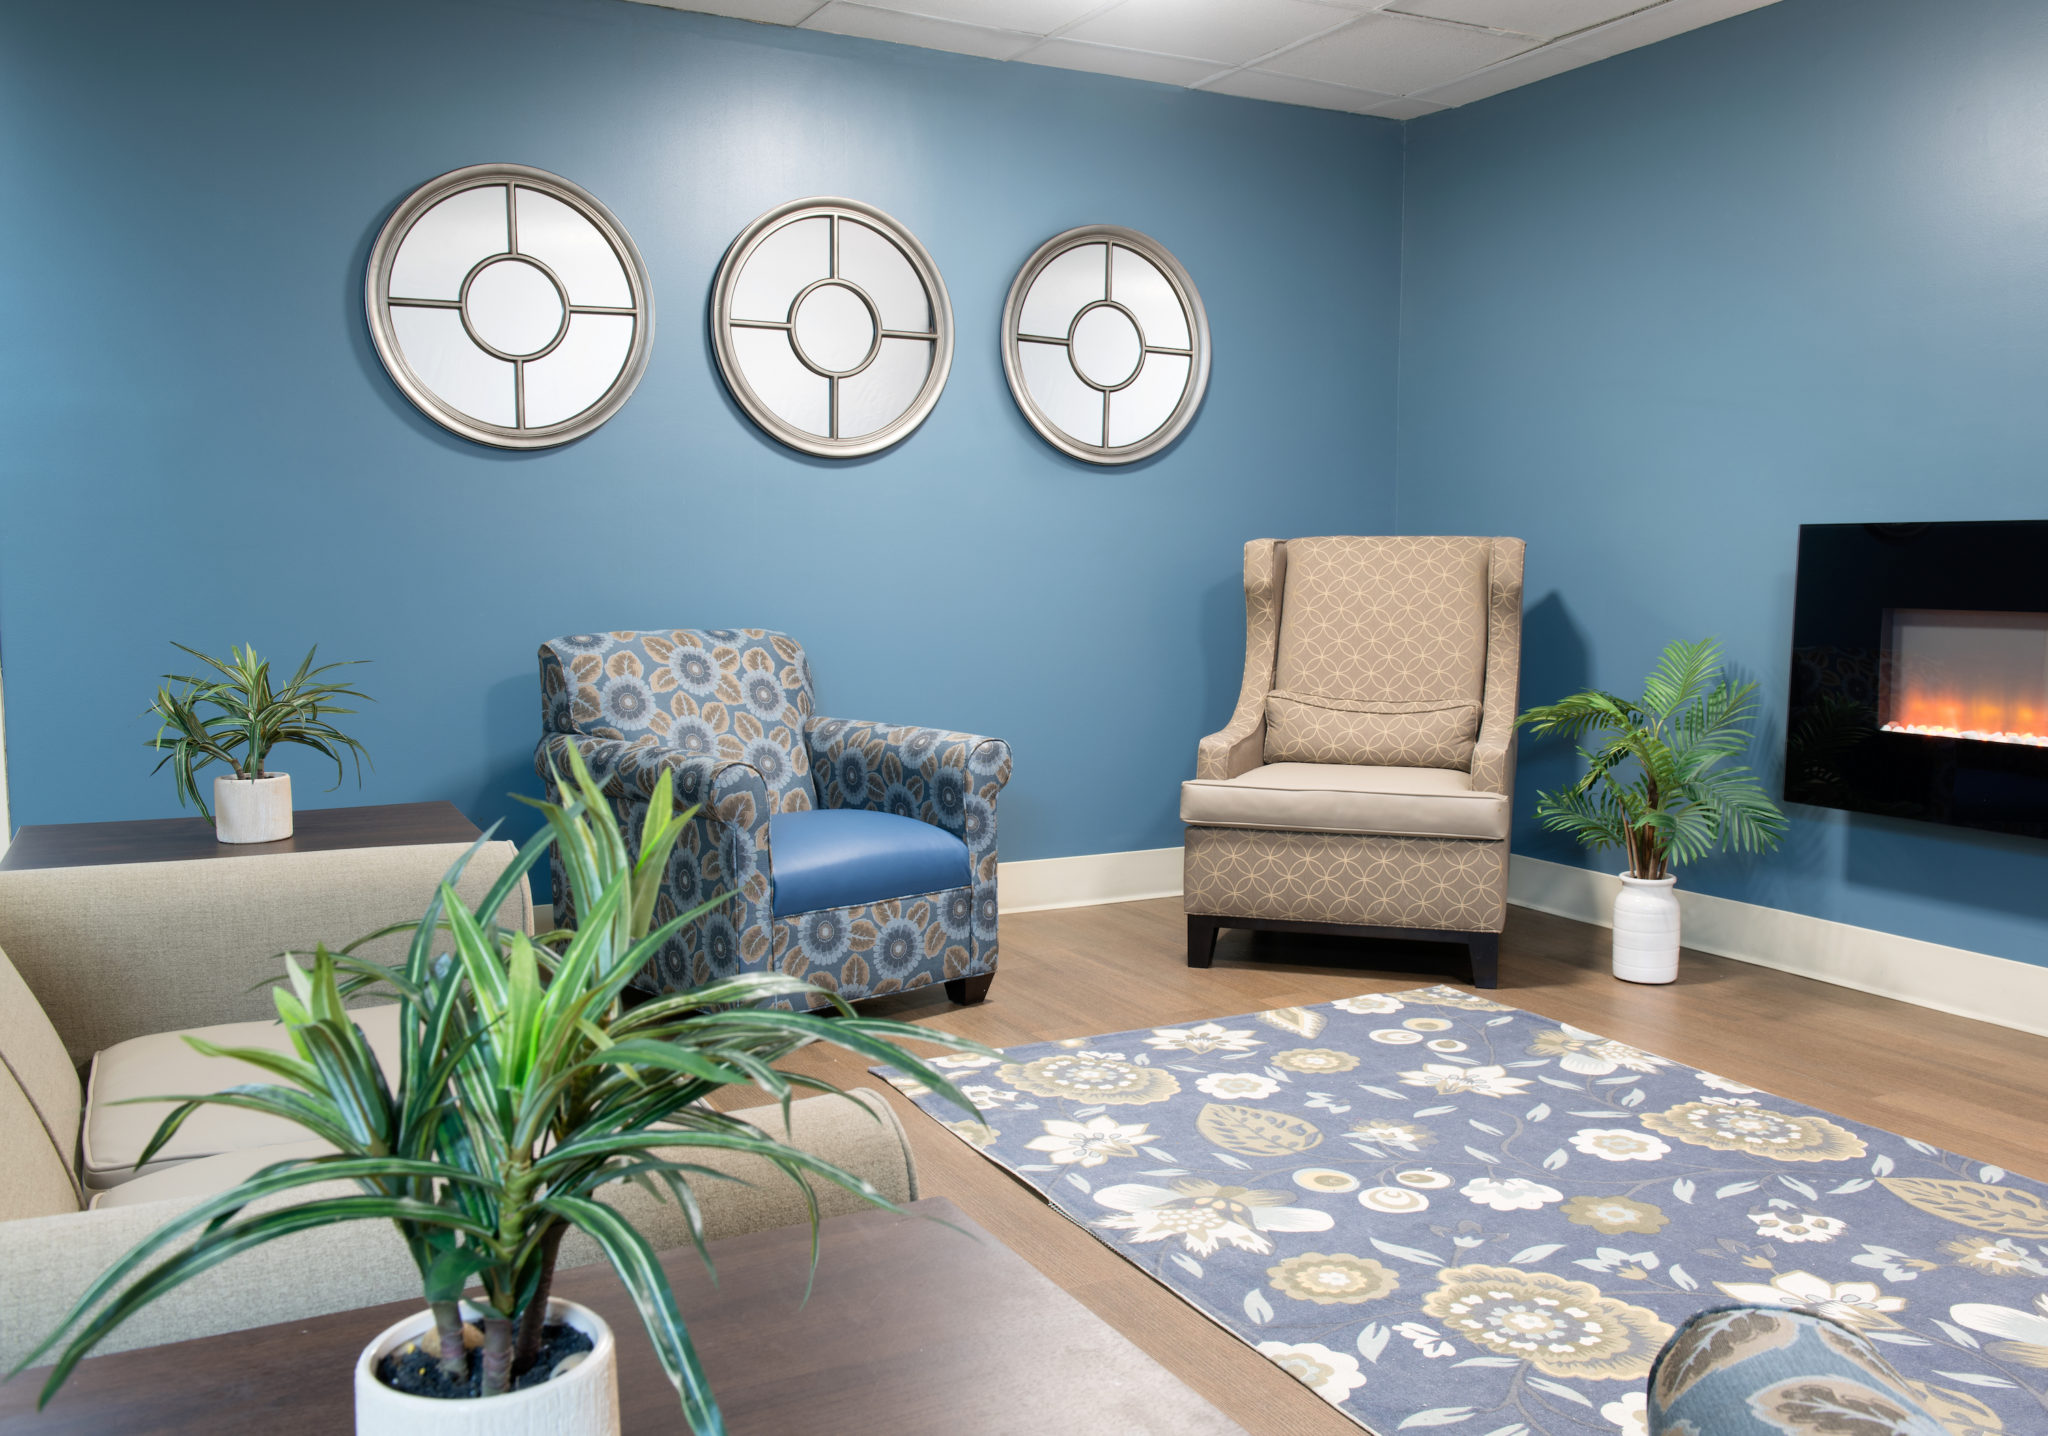
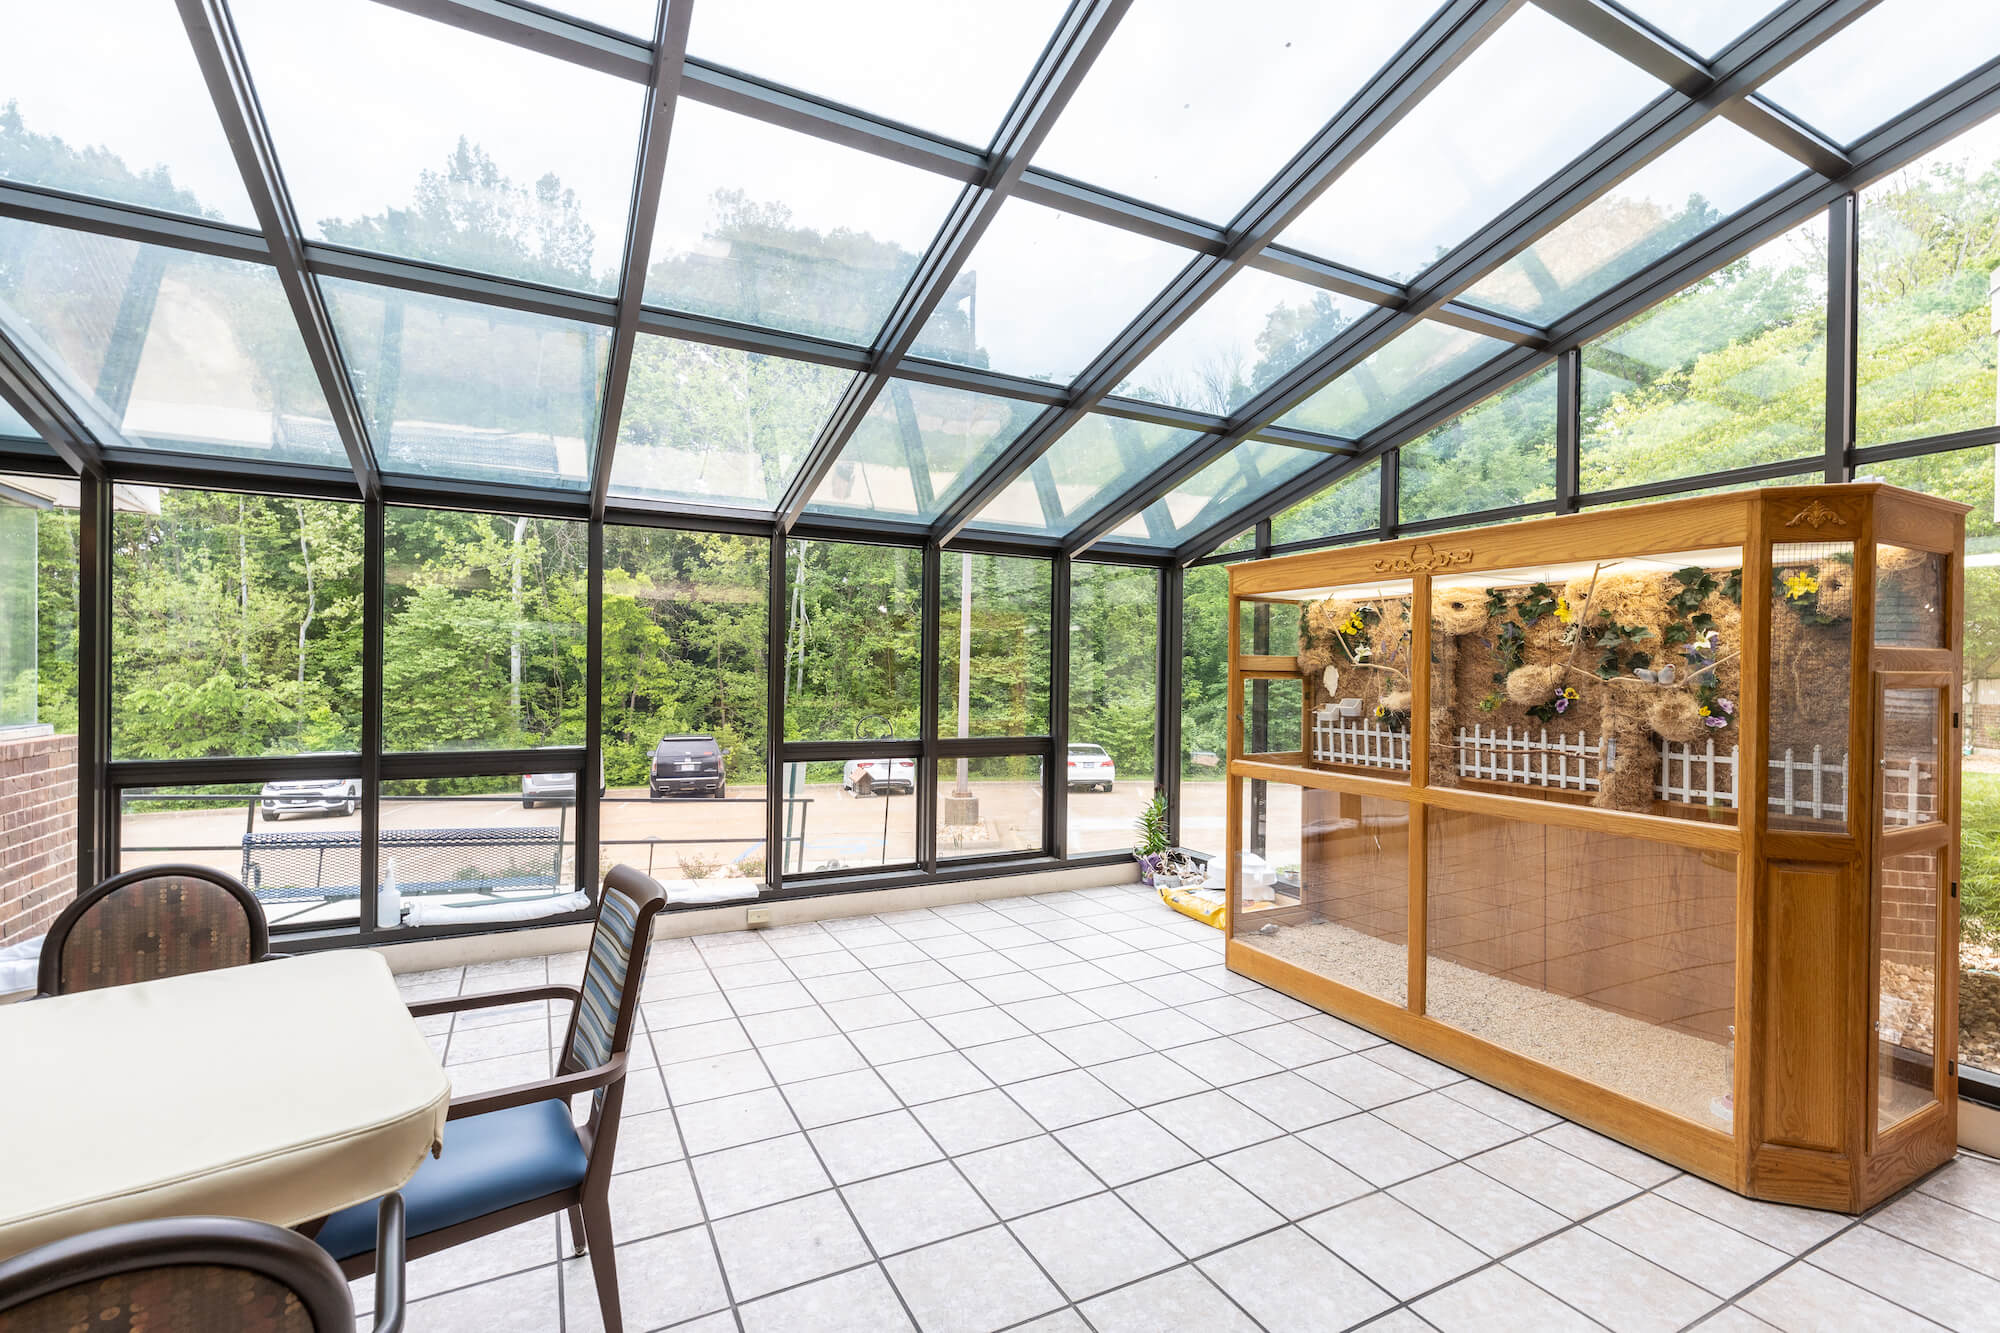
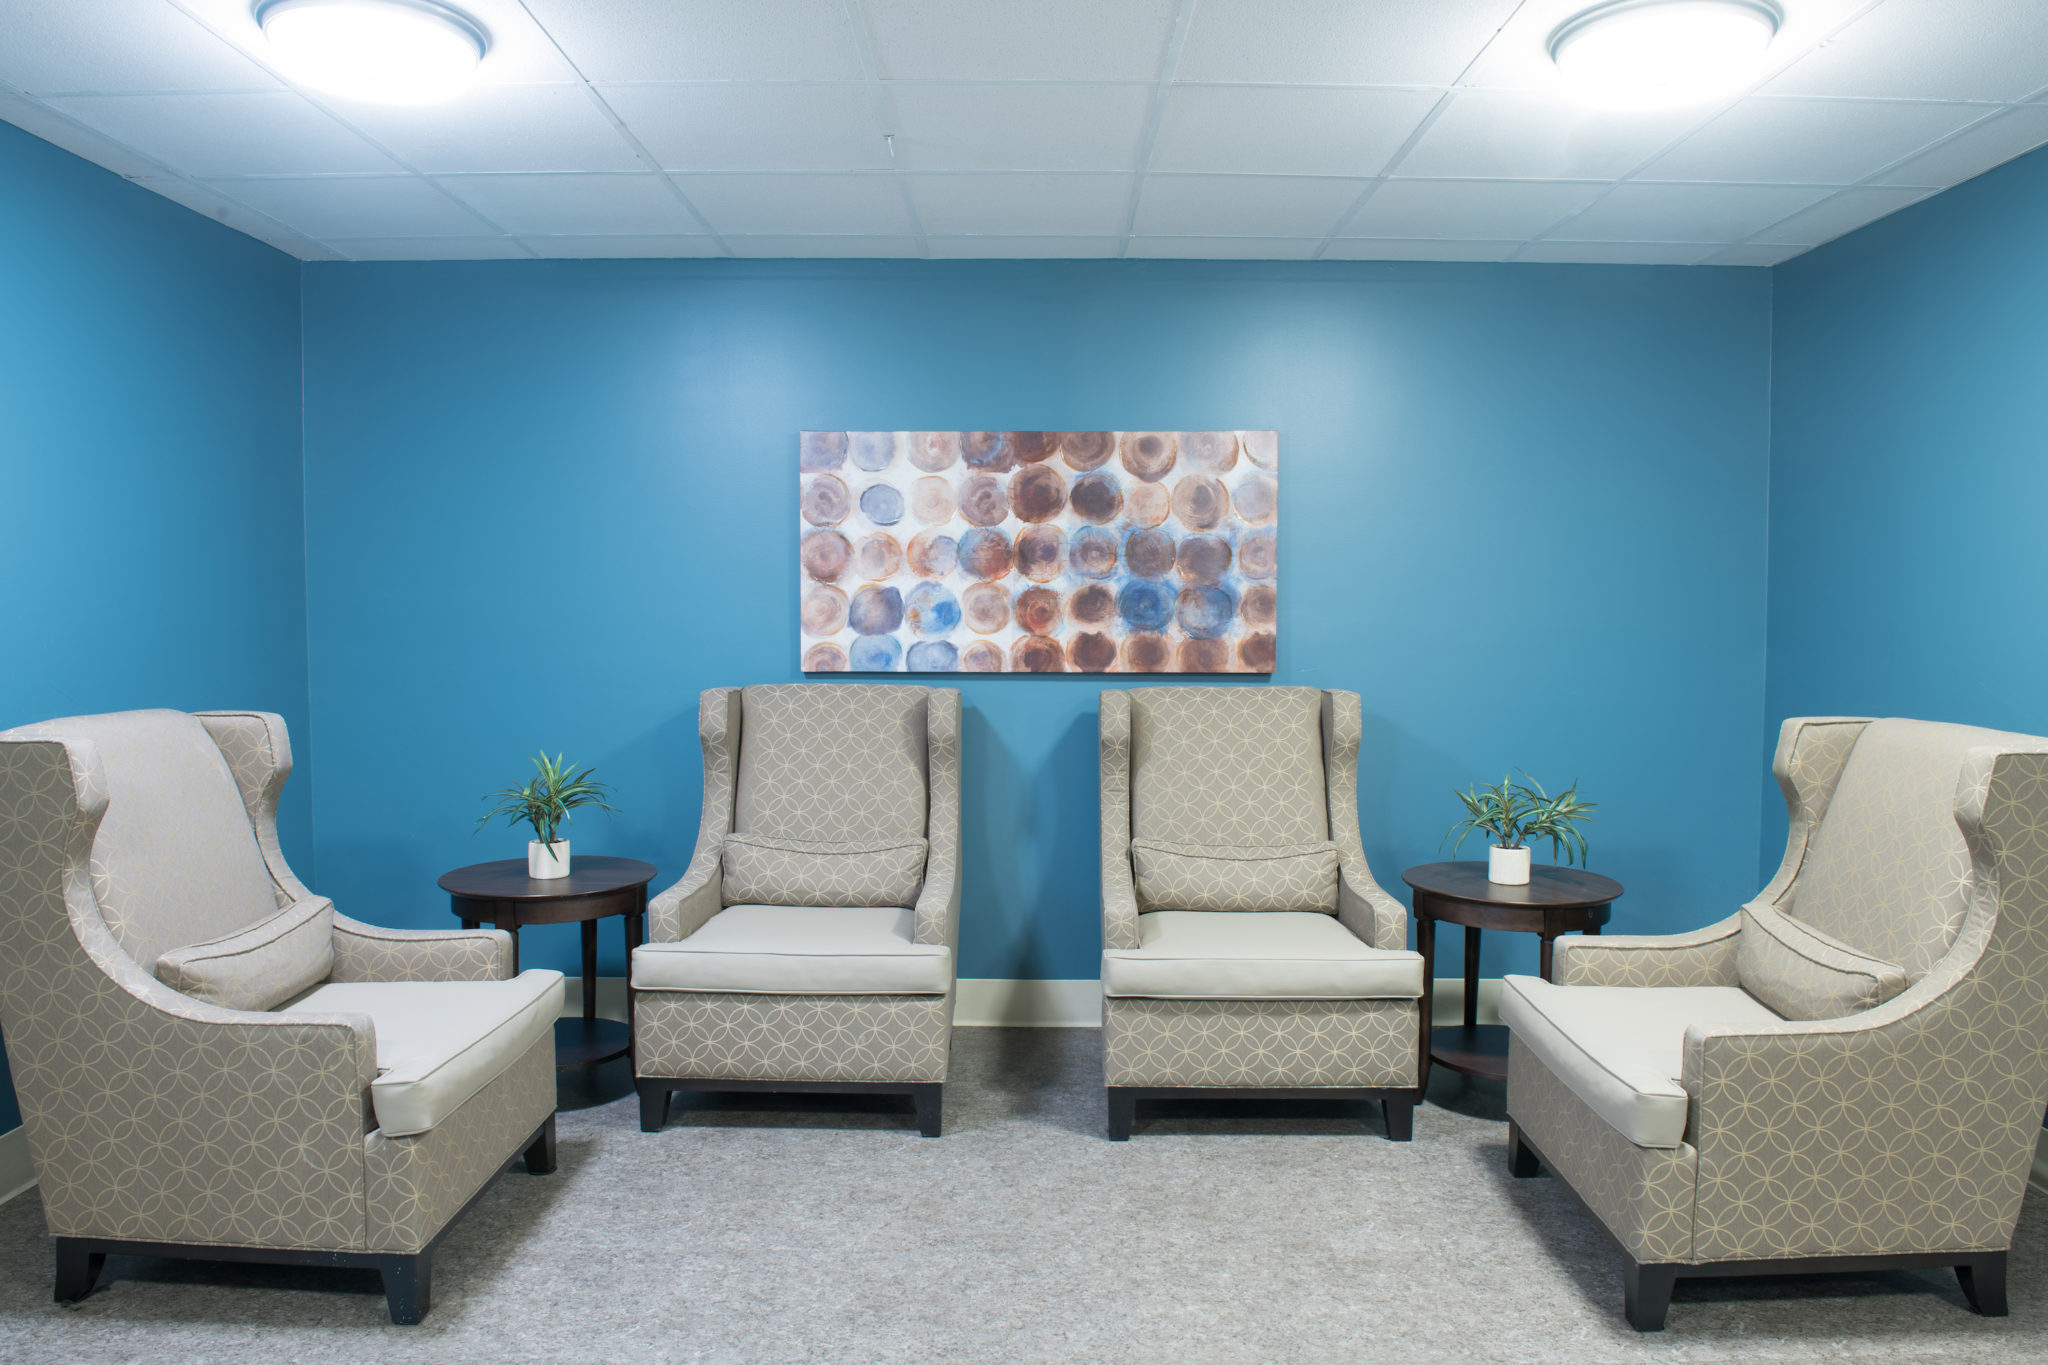
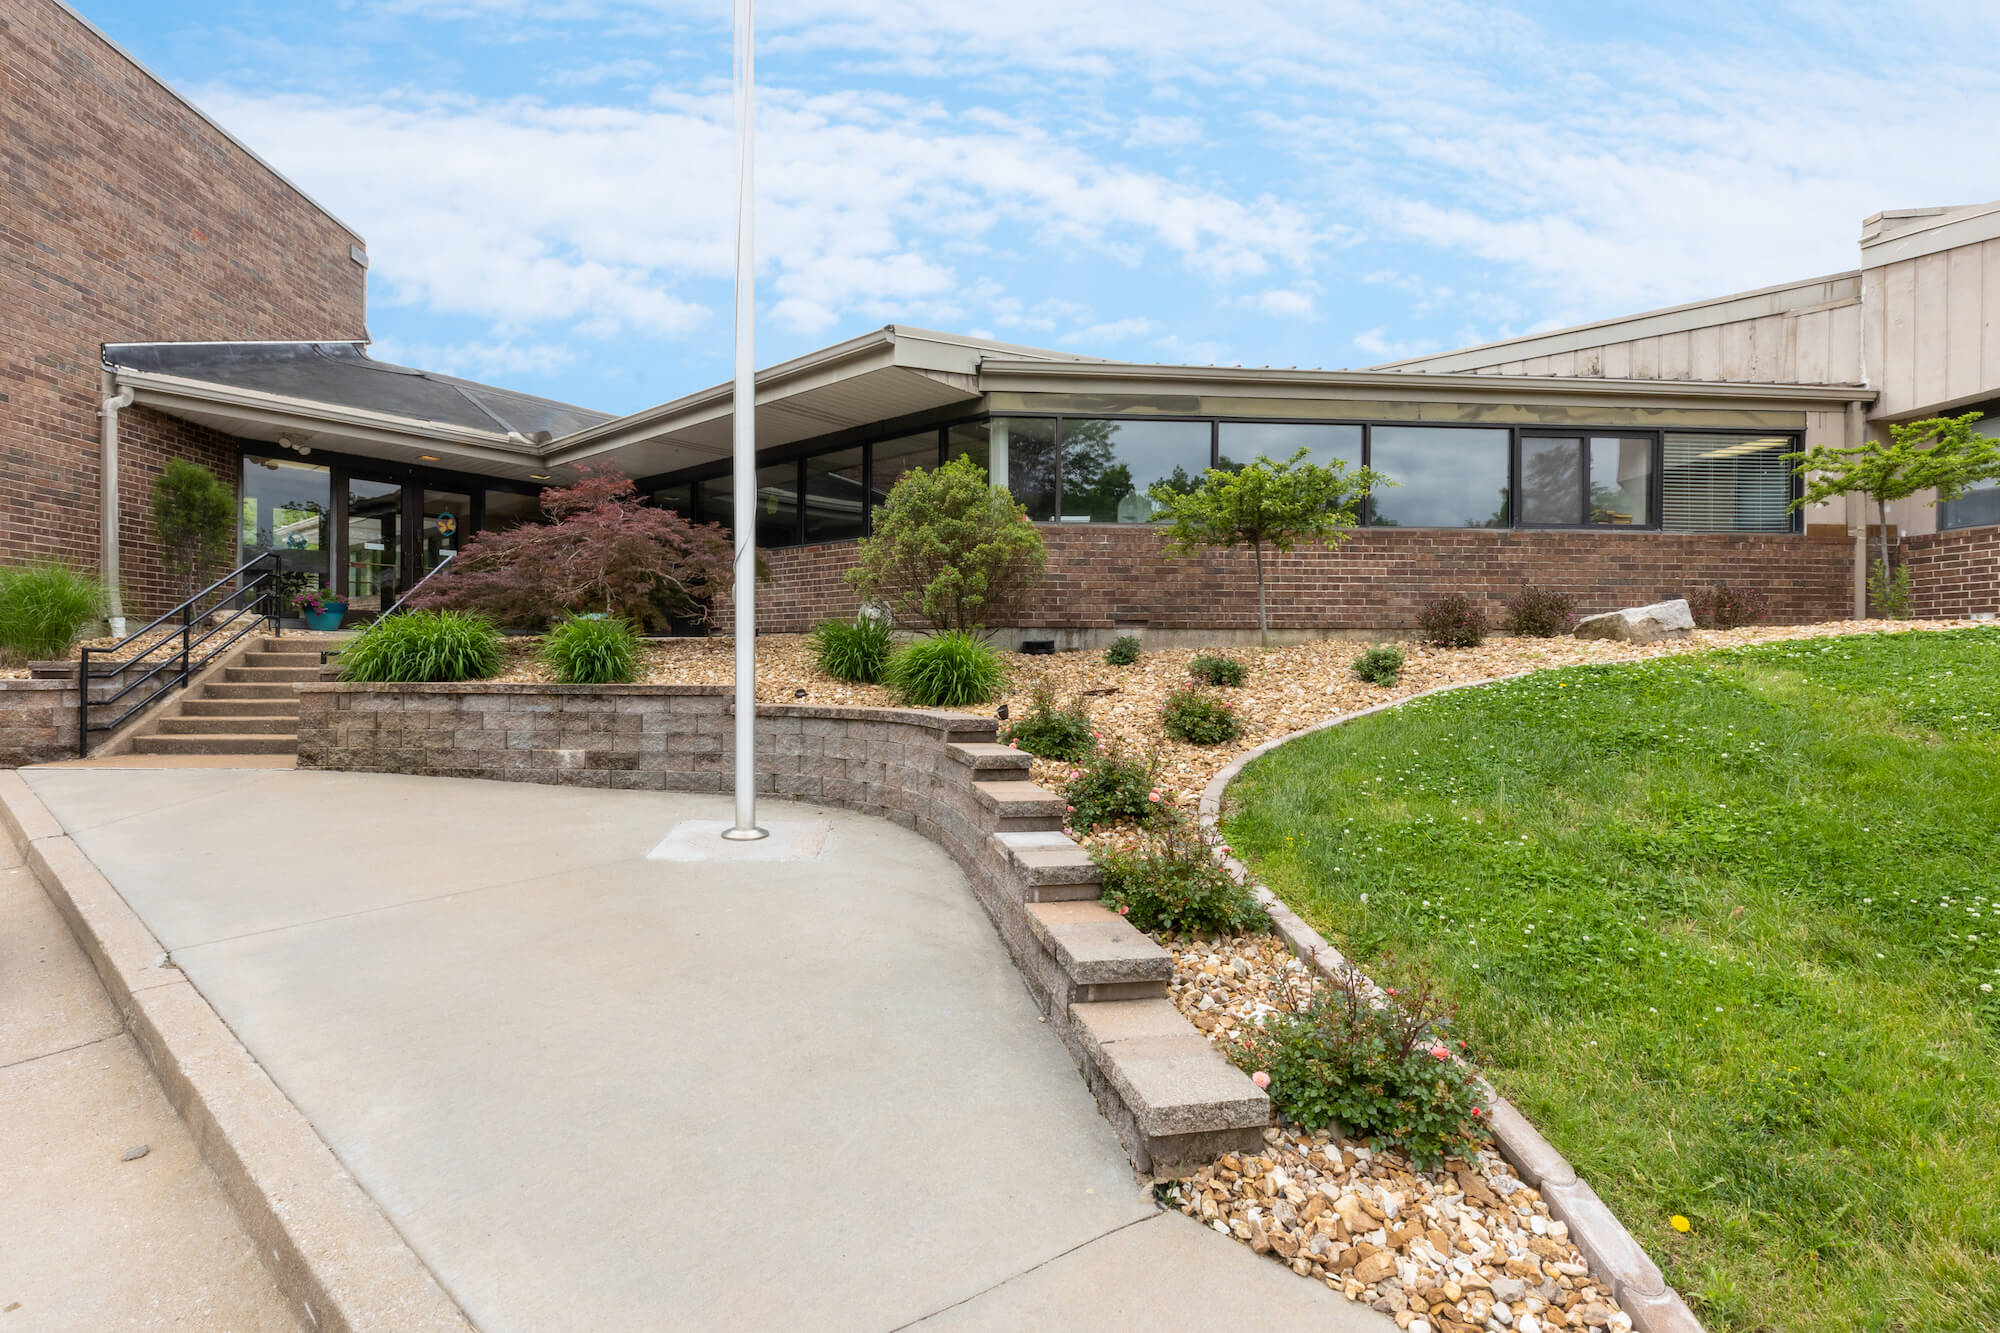
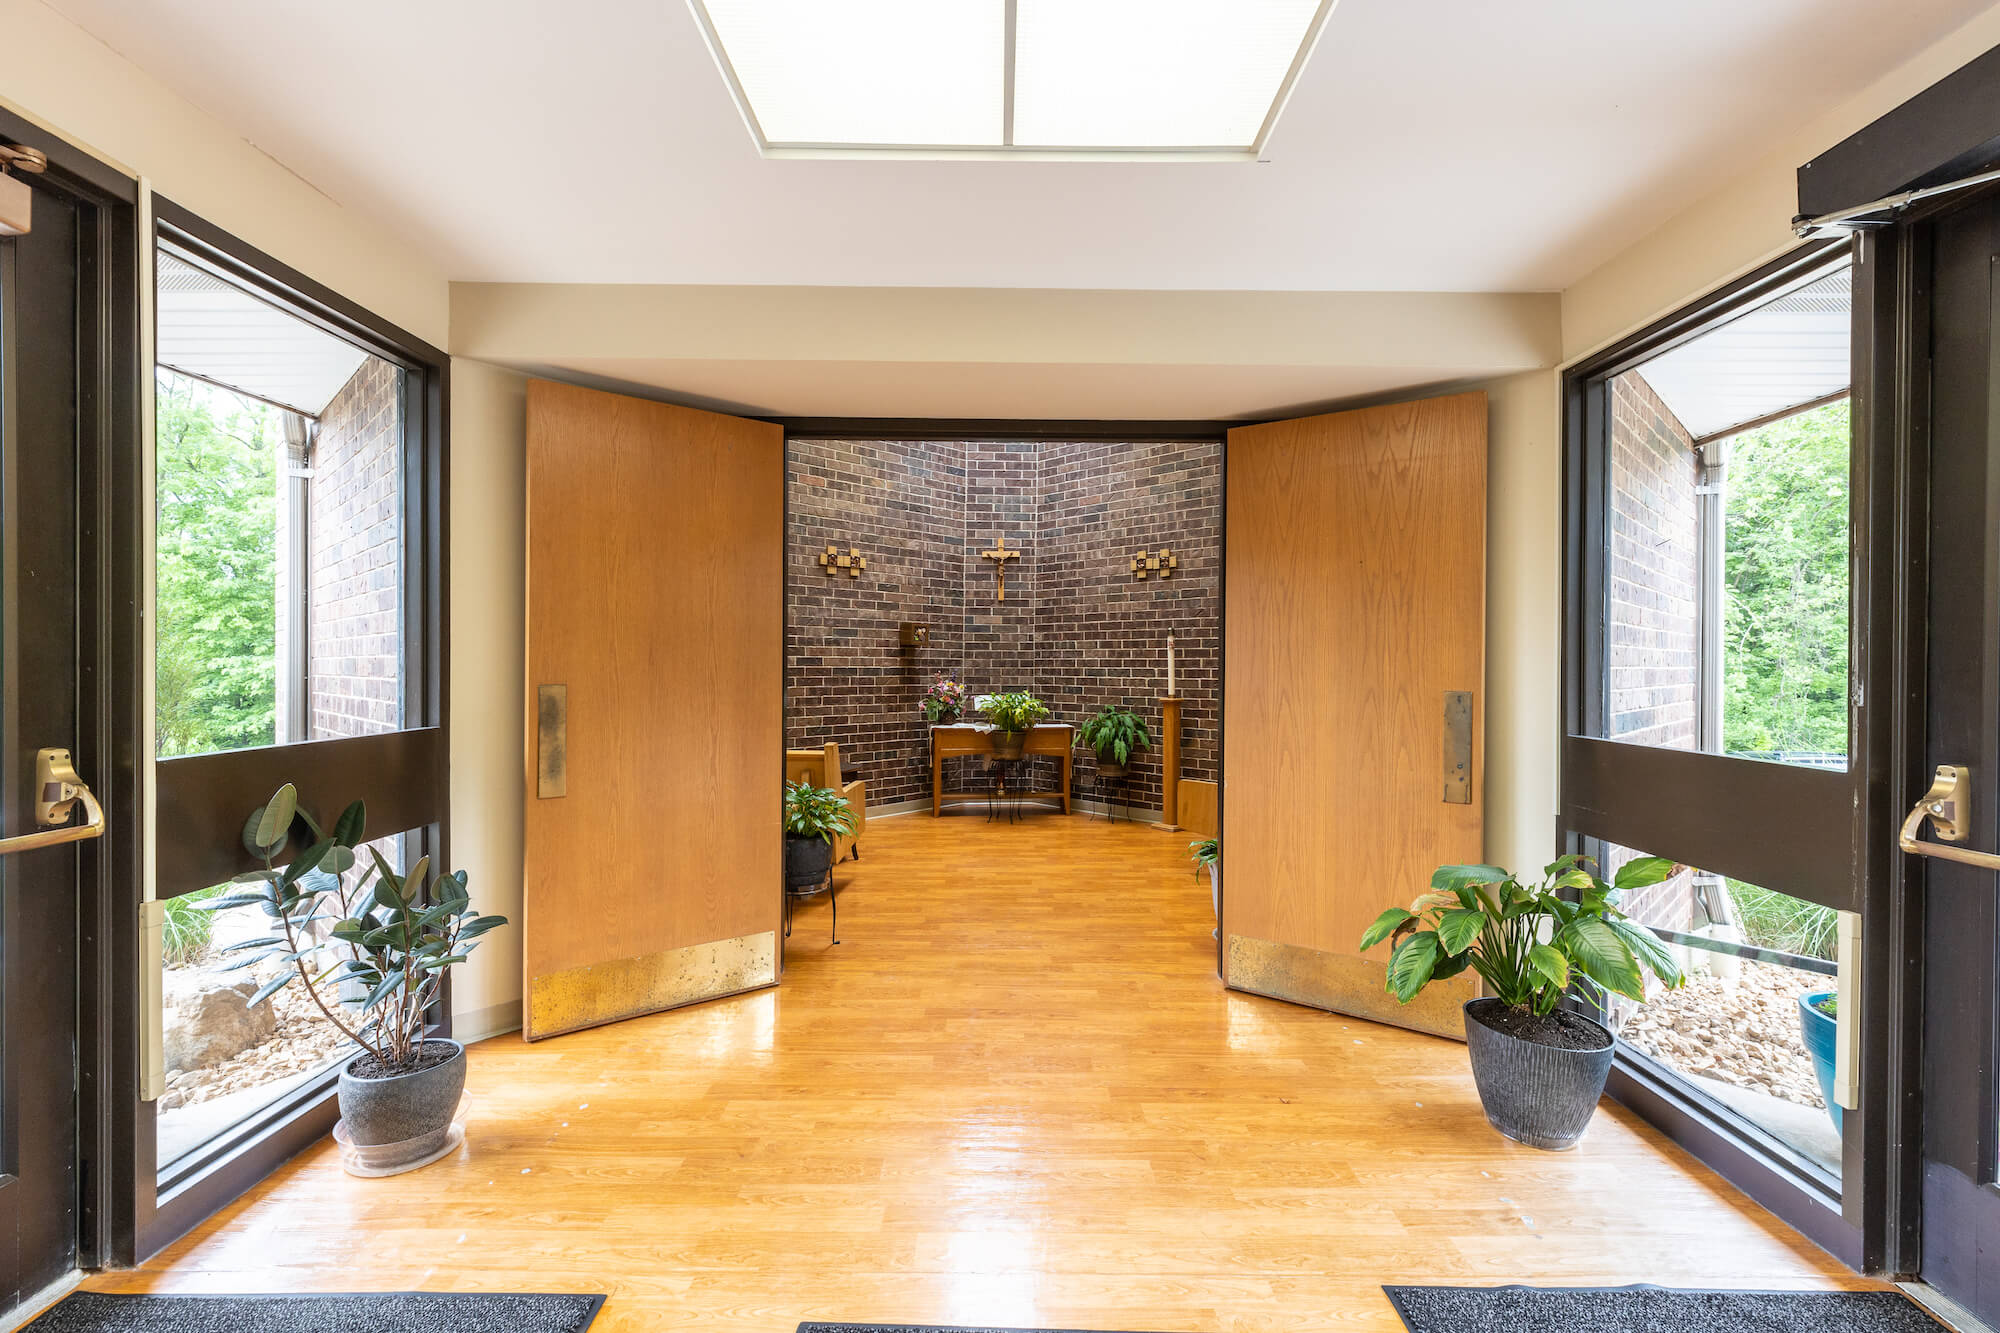
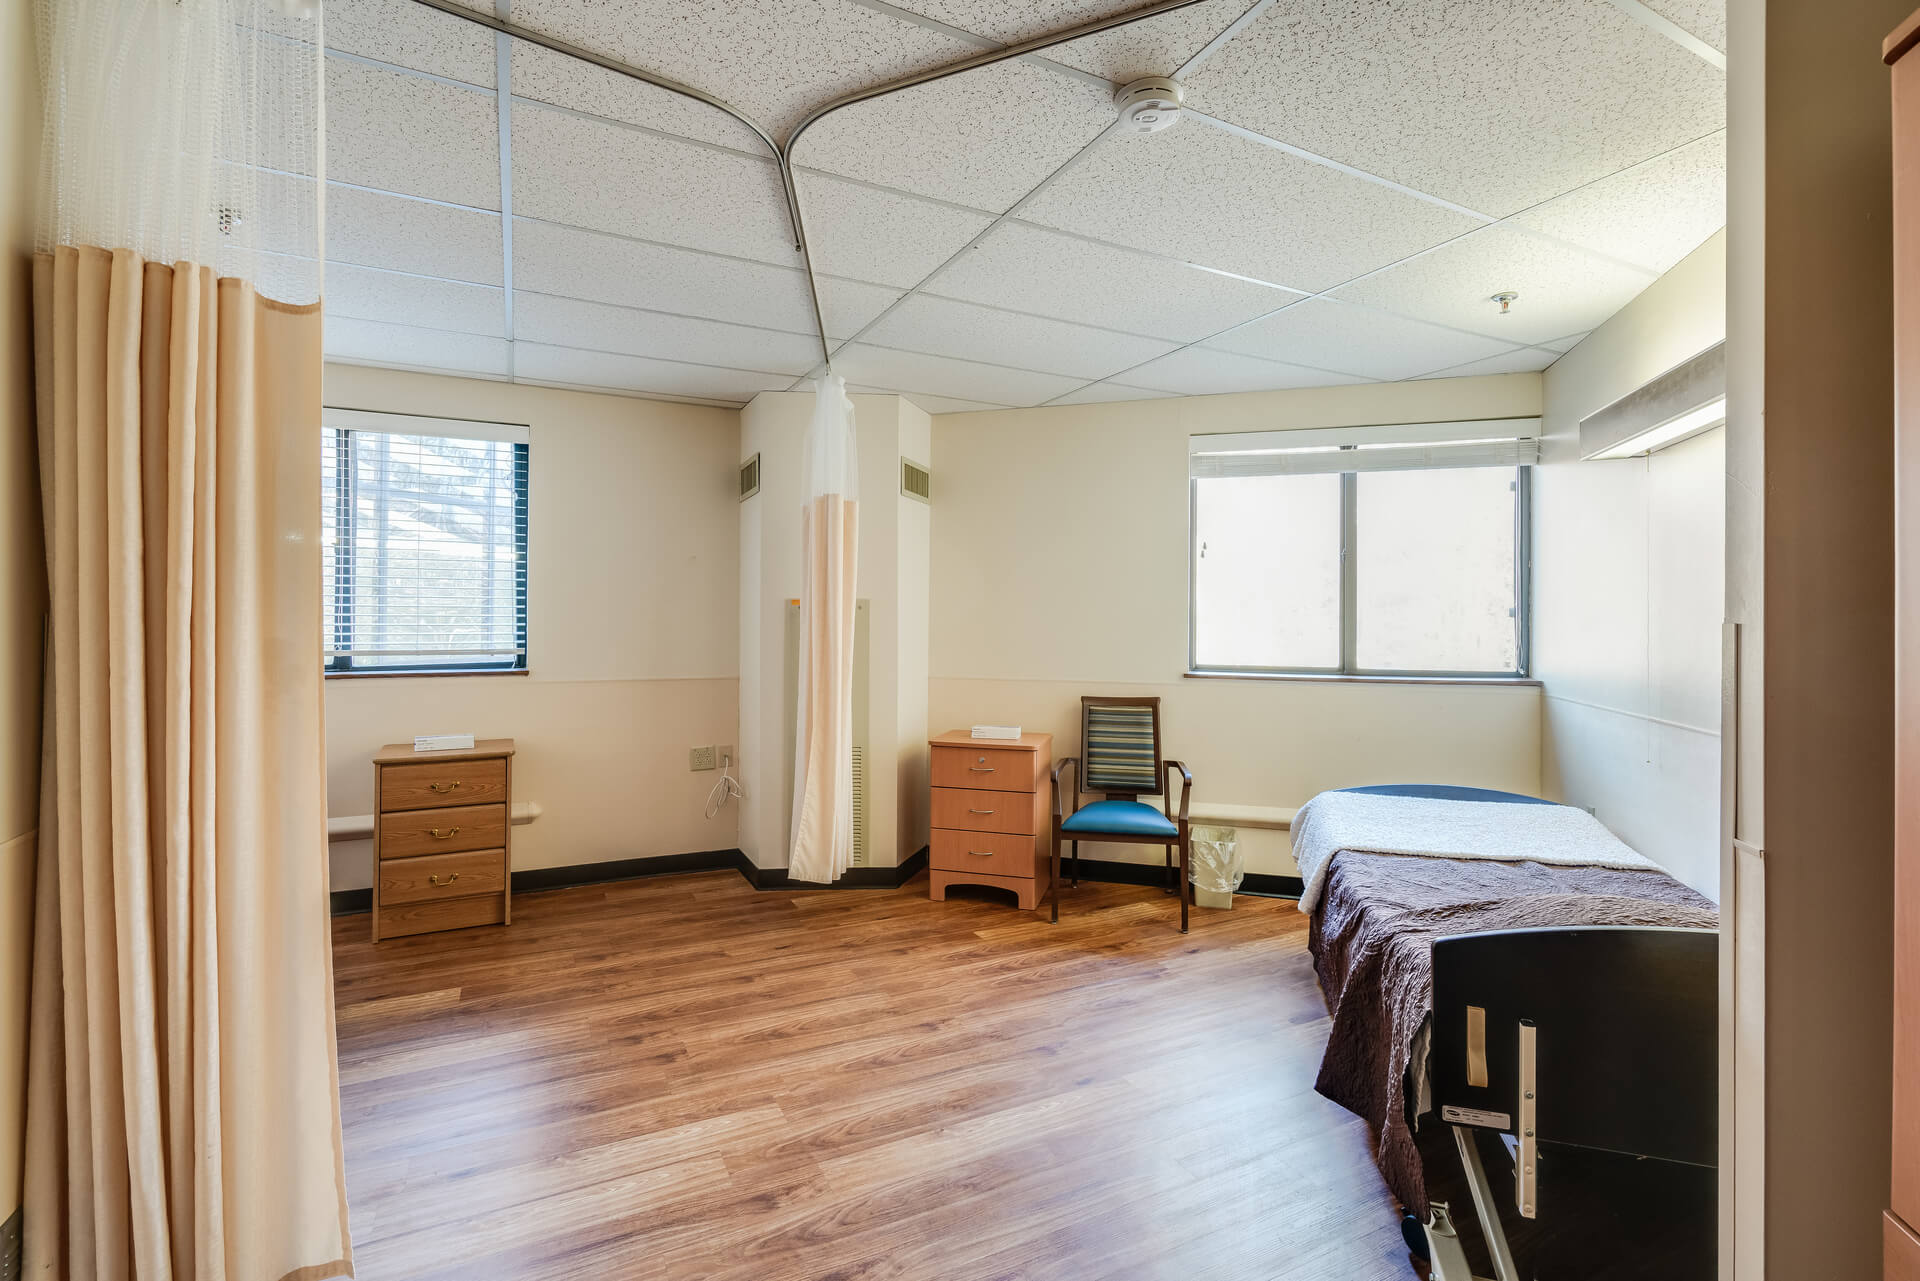
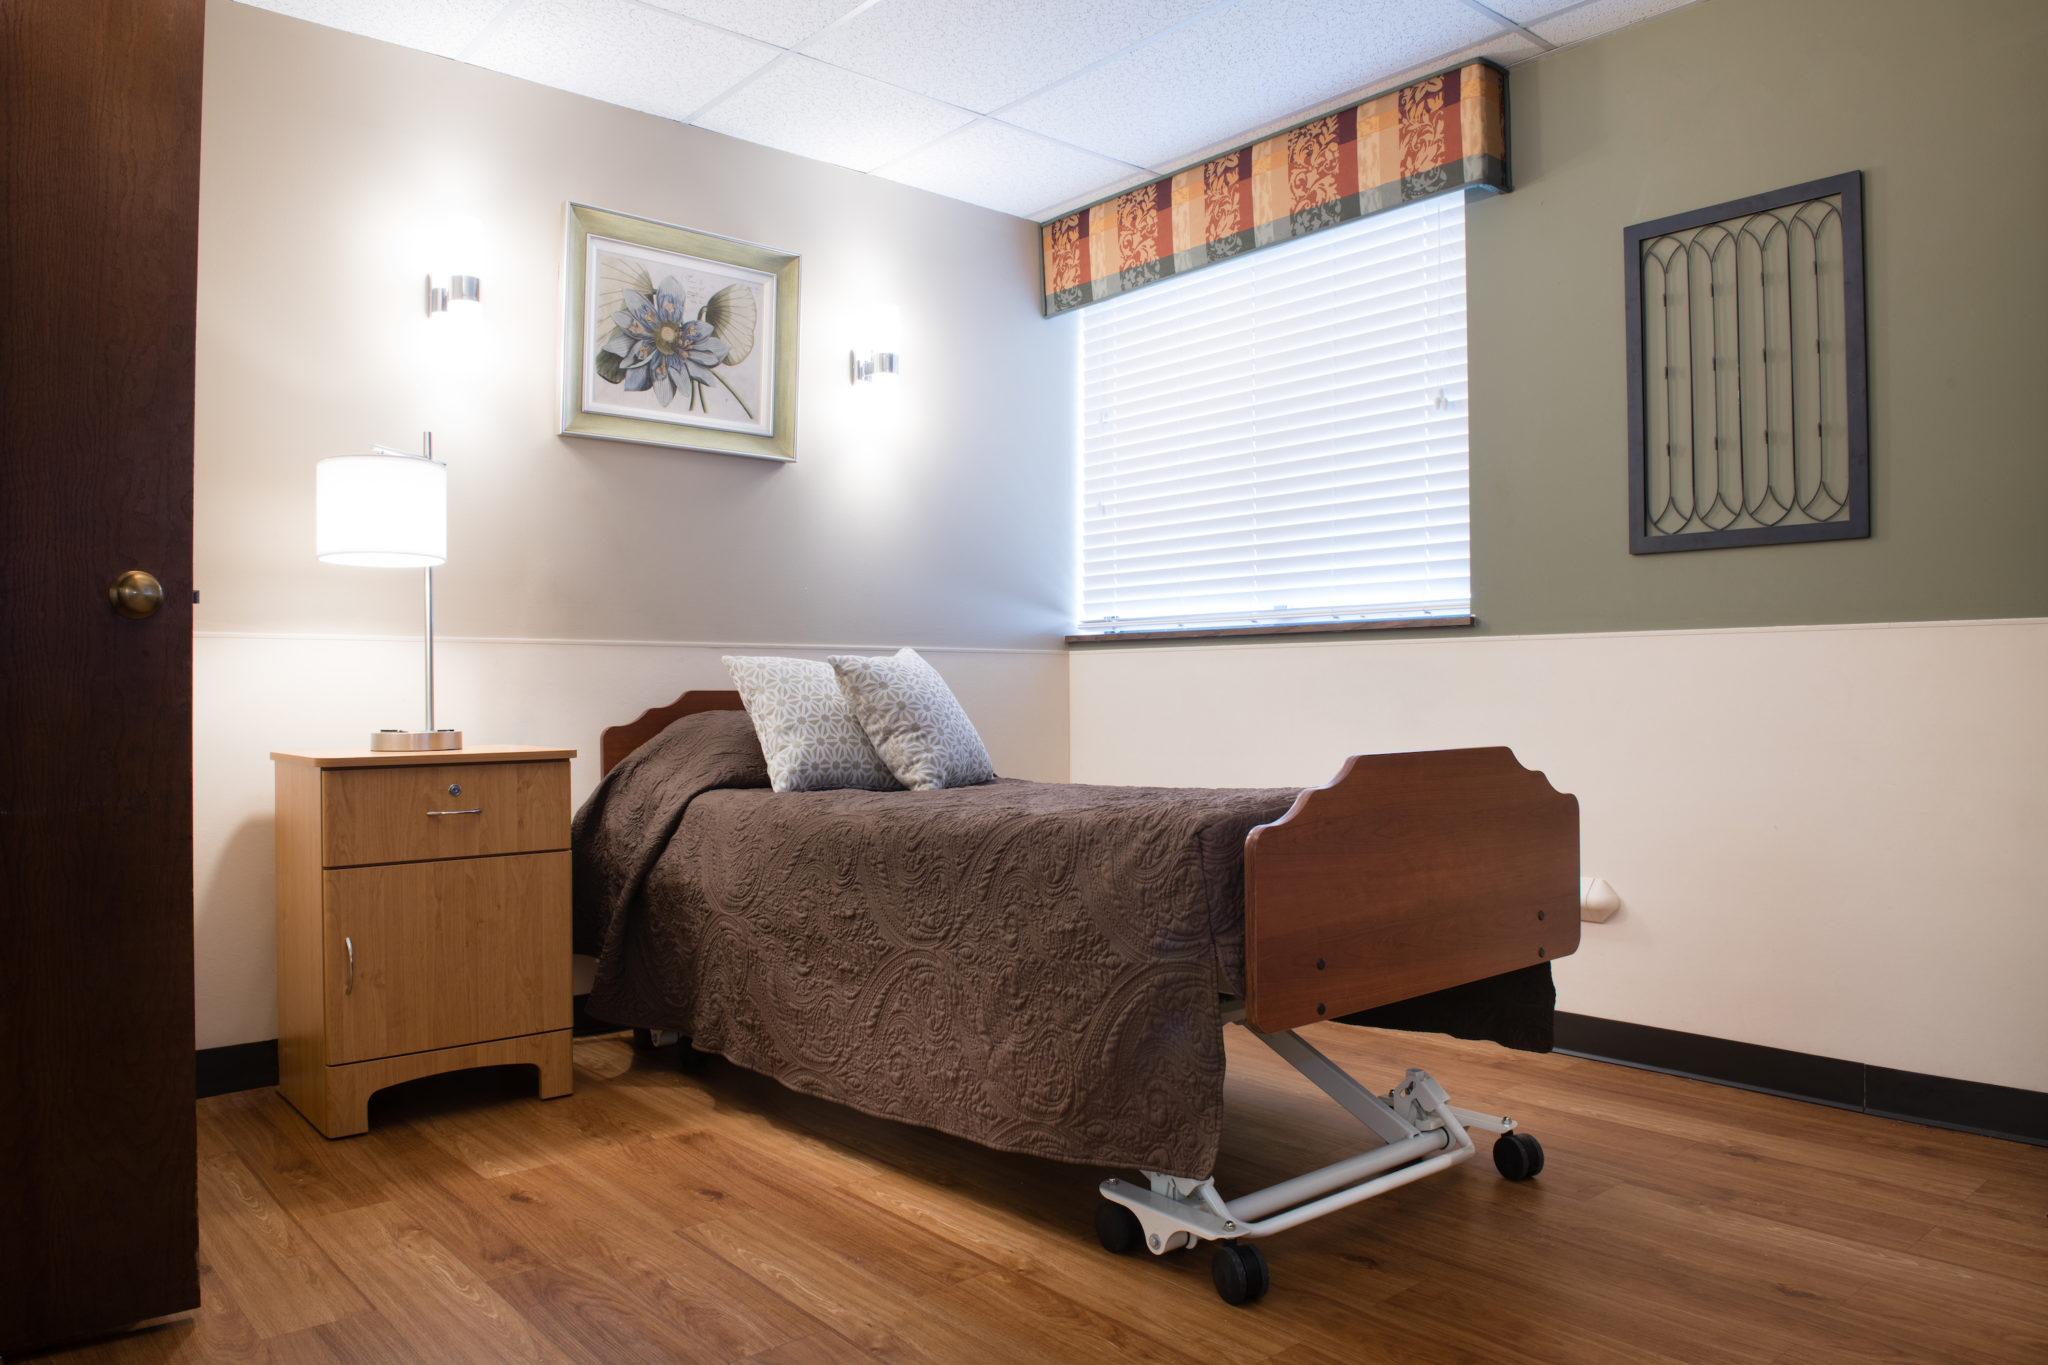
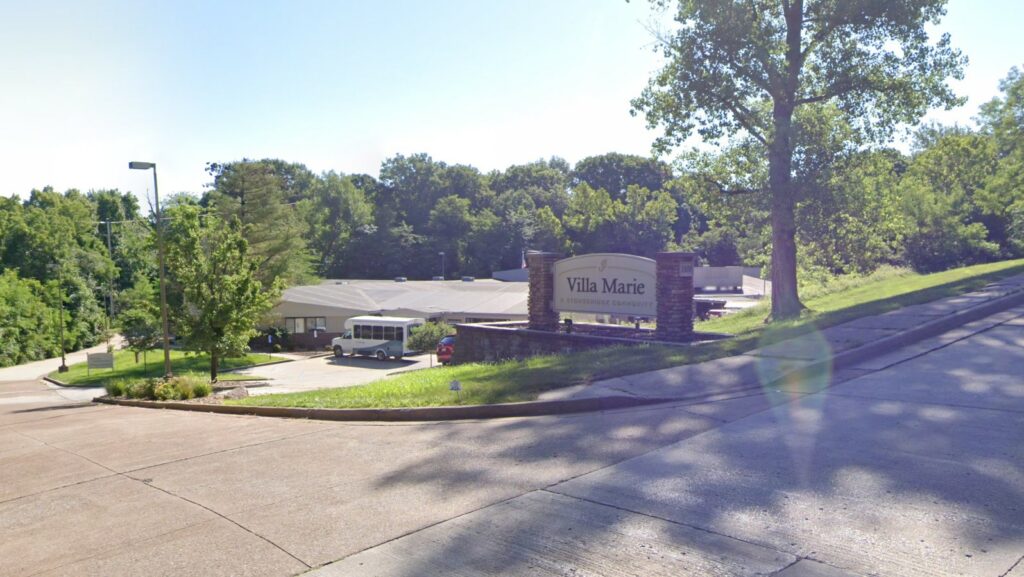
Stonebridge Villa Marie beckons with a welcoming environment that invites residents to embrace their passions and talents in Jefferson City, Missouri. As a family-owned and operated establishment, it exudes a sense of warmth and personal touch that sets it apart. The facility itself boasts a modern and pristine design, reflecting a commitment to aesthetics and functionality. With a professionally curated interior, every corner exudes comfort and sophistication.
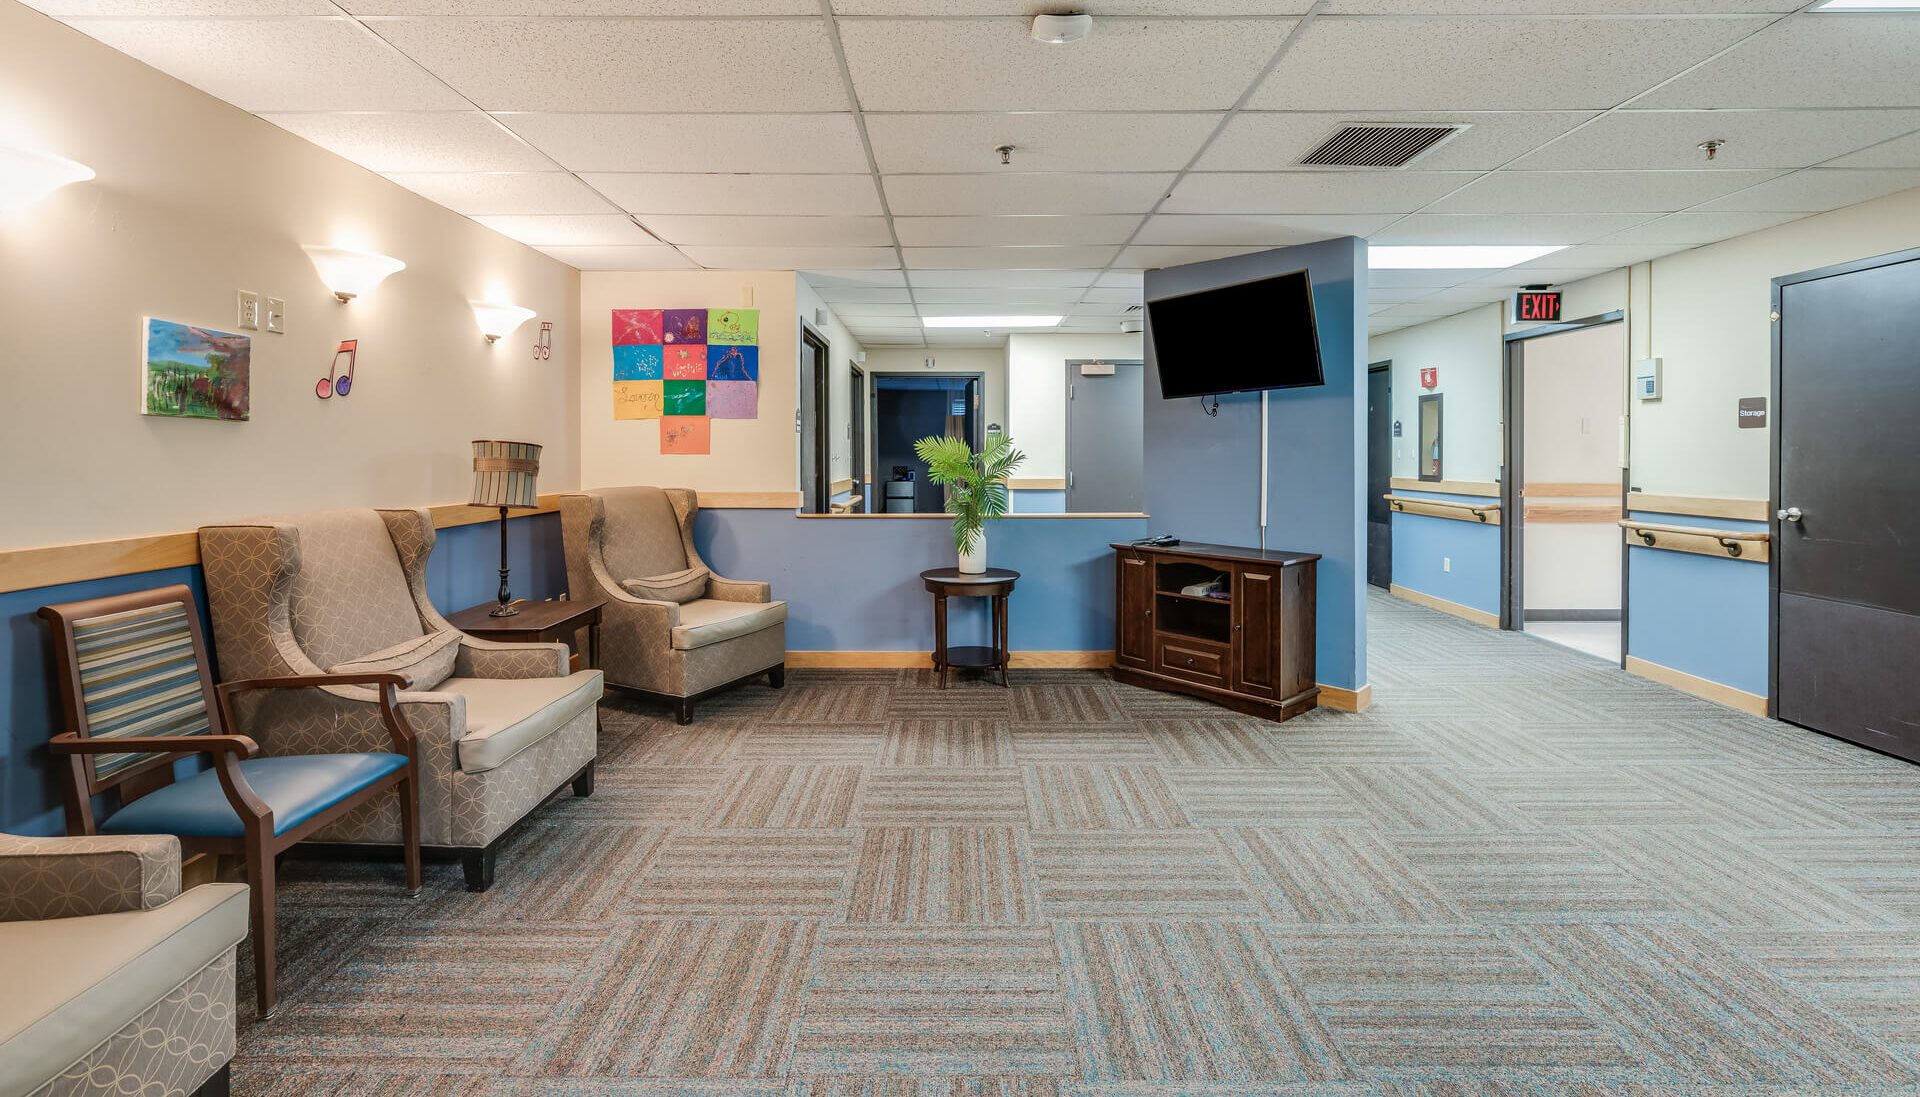
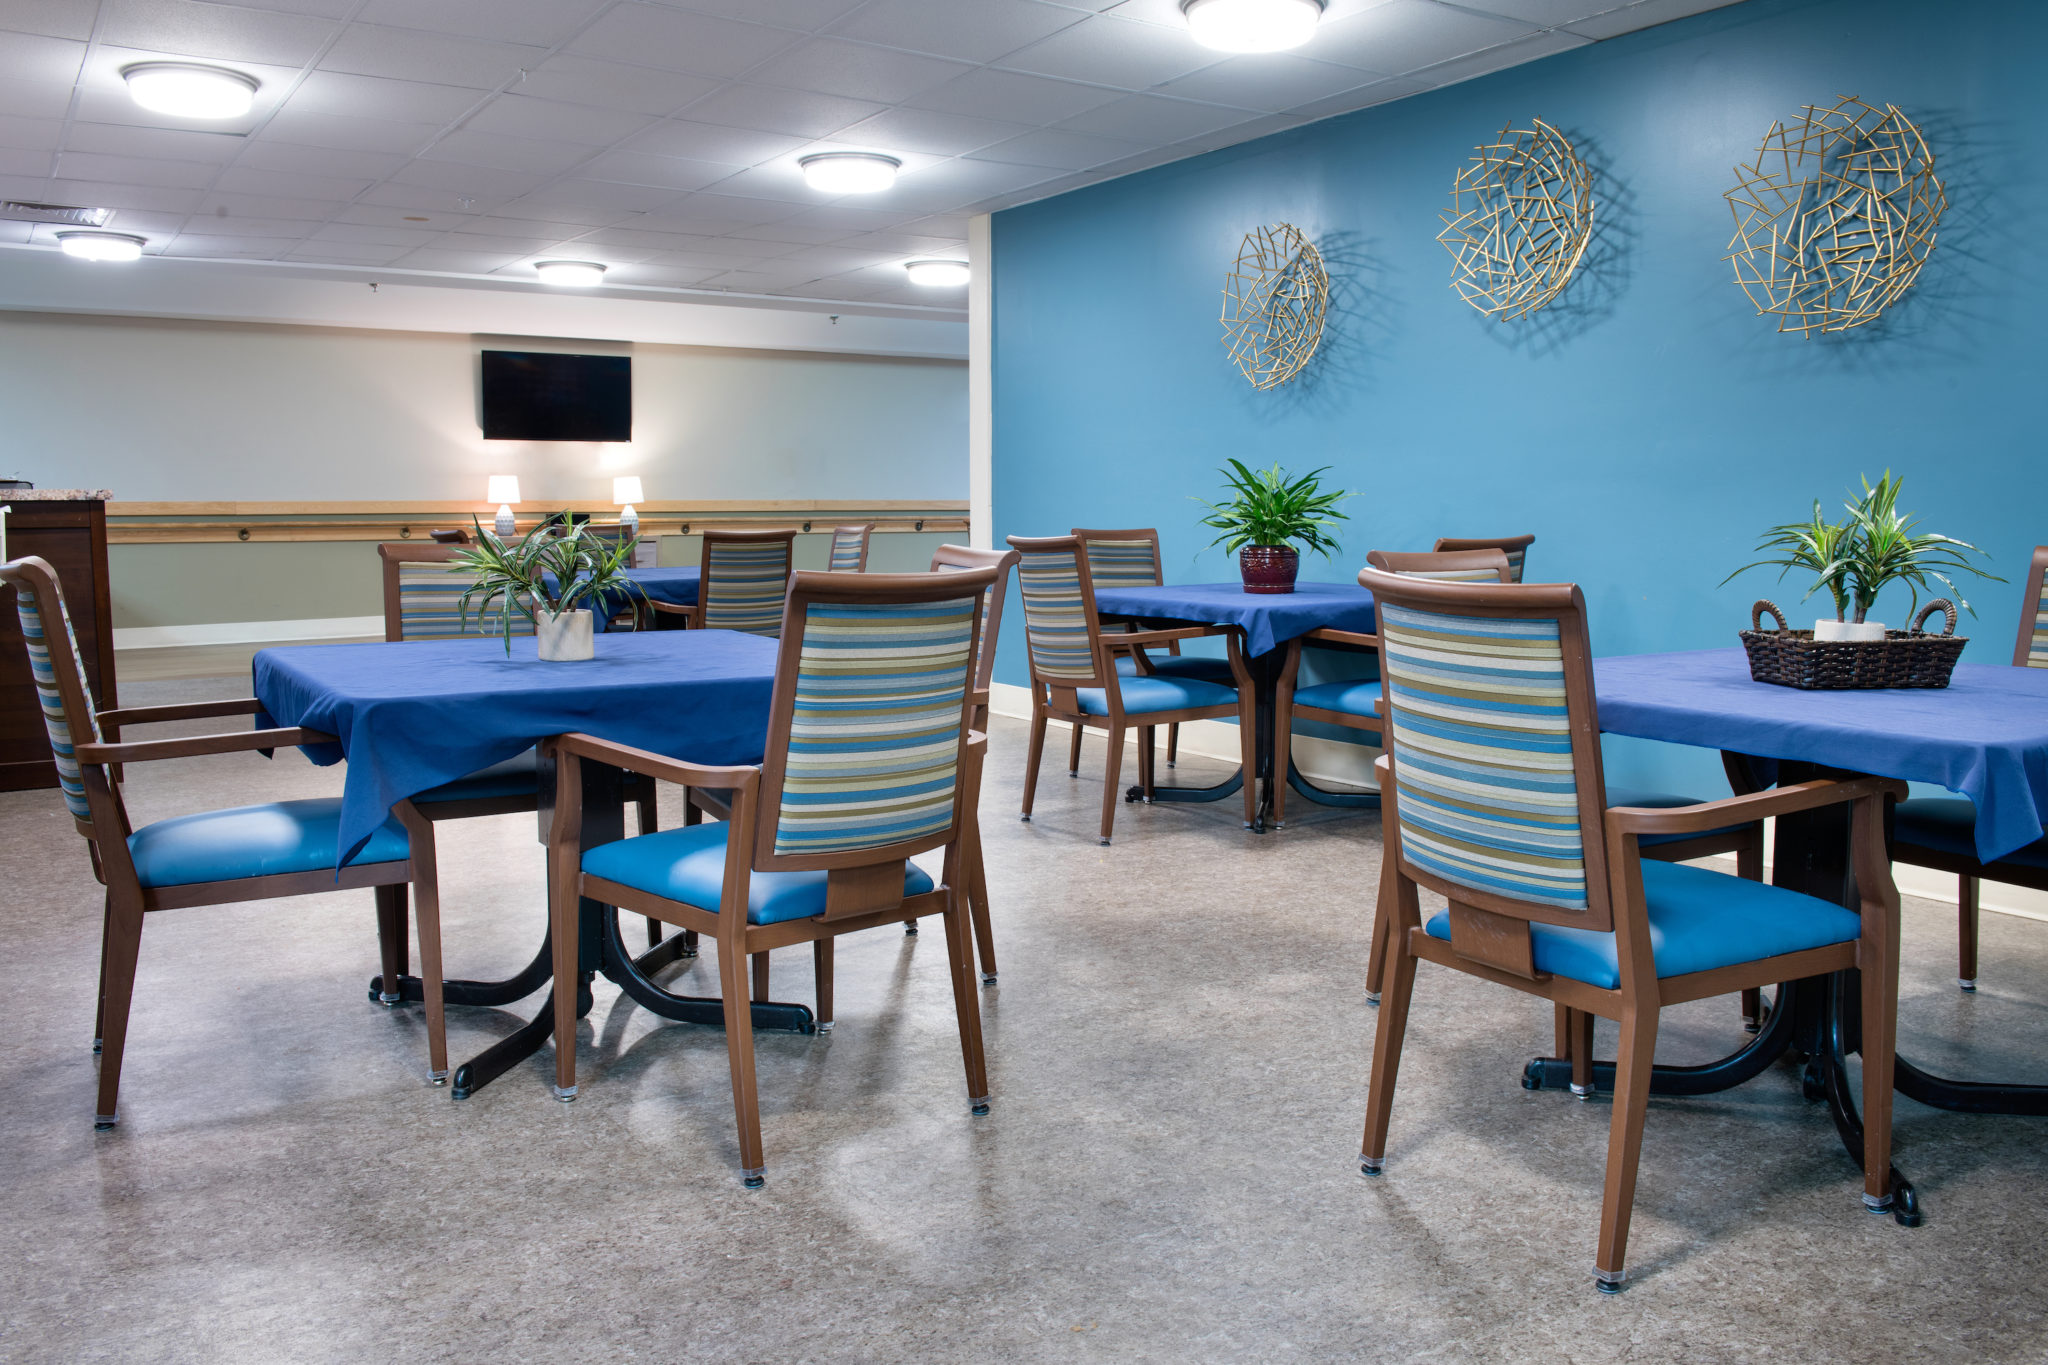
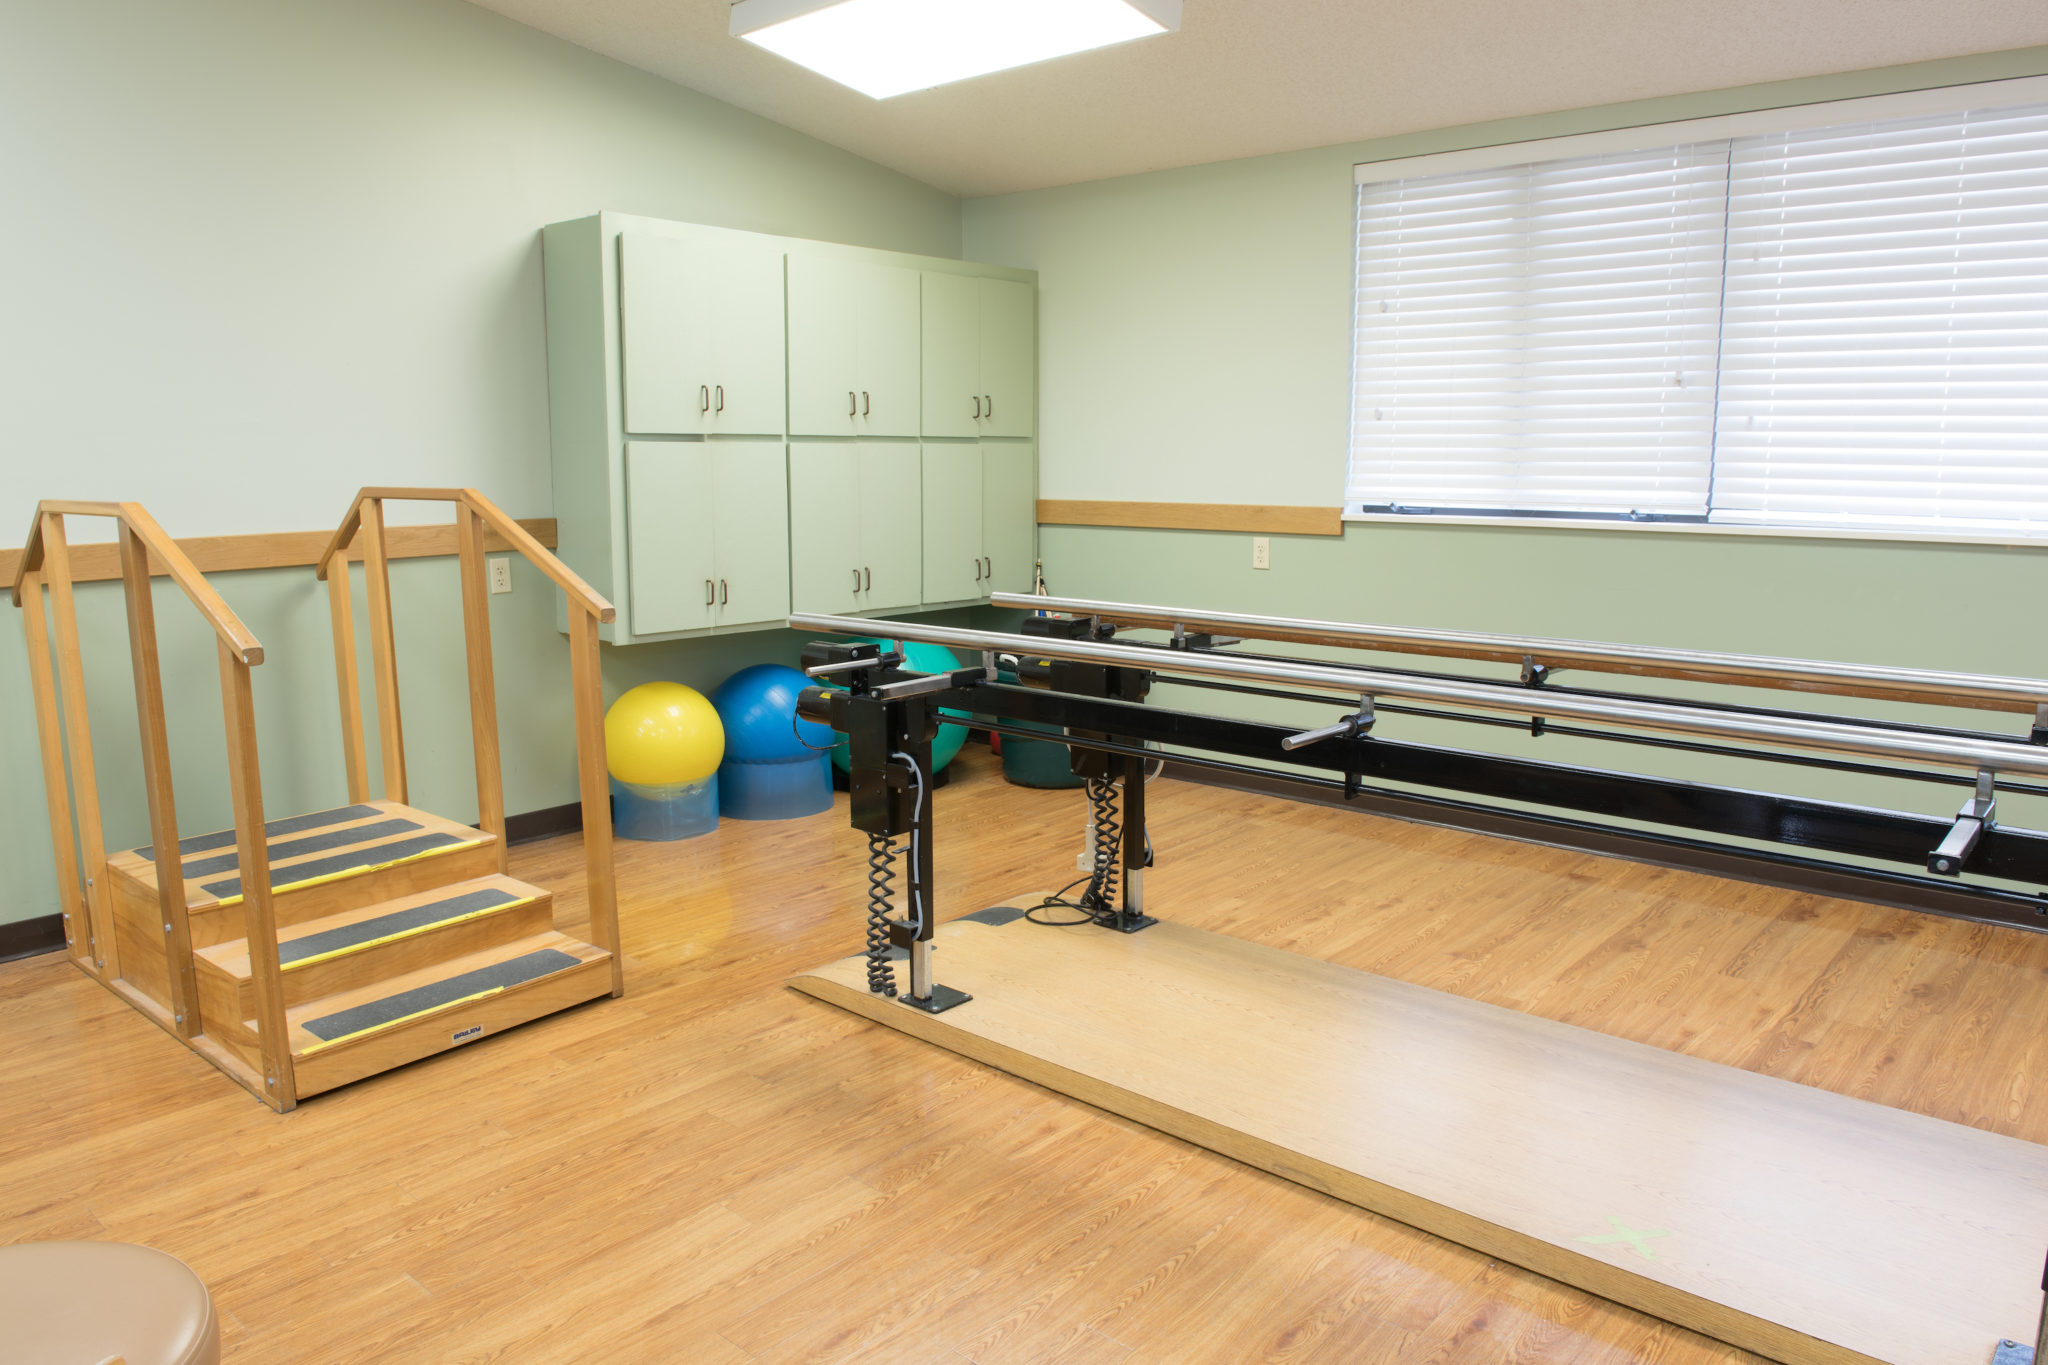
Stonebridge Villa Marie offers a range of specialized care services including rehabilitation, skilled nursing, and memory care. This comprehensive approach is complemented by a home-like setting that encourages socialization and peer interaction, fostering a sense of community that truly feels like family. Grounded in principles of dignity and respect, this haven ensures that each resident’s unique journey is honored every step of the way.

(573) 635-3381

Quality ratings

Measured by Centers for Medicare & Medicaid Services (CMS)

Overall rating Info The Overall CMS Rating combines results from health inspections, staffing levels and quality measures. Health inspections carry the most weight. Staffing and quality scores can increase or decrease the final rating based on performance compared to state and national standards.
1/5
Missouri average: 2.6/5
Health Inspection Info Based on the results of the facility's three most recent standard inspections and any complaint investigations. CMS reviews the number, scope, and severity of deficiencies, with more recent findings weighted more heavily.
2/5
Missouri average: 2.9/5
Staffing Info Measures average nursing staff hours per resident per day, including Registered Nurses (RNs) and total nursing staff. Ratings are adjusted based on the level of care residents require and are compared to state and national benchmarks.
2/5
Missouri average: 2.2/5
Quality Measures Info Based on clinical and physical health indicators reported to CMS, such as hospital readmissions, falls, pressure ulcers, and improvements in mobility. These measures reflect how well residents' health needs are being managed.
1/5
Missouri average: 2.8/5

Nursing care per resident

Info This shows how many total hours of nursing staff time are available per resident each day. Higher numbers usually mean more staff support.
3h 49m per day

This home provides 0% more nursing time per resident than the Missouri average.

Missouri average: 3h 48m per day

Staffing hours breakdown

Info Hours of care per resident per day, broken down by staff type. Data from CMS Medicare.
Staff type Facility State avg National avg
Registered Nurse (RN) Info Registered nurse hours per resident per day. 25m per day 28m per day 41m per day
Nurse Aide Info Nurse aide hours per resident per day. 2h 18m per day 2h 20m per day 2h 21m per day
Total Nursing (Weekend) Info Total number of nurse staff hours per resident per day on weekends. 2h 55m per day 3h 3m per day 3h 26m per day
Physical Therapist Info Physical therapist staff hours per resident per day. 2m per day 2m per day 4m per day
RN (Weekend) Info Registered nurse hours per resident per day on weekends. 20m per day 20m per day 29m per day

Capacity and availability

Medium-capacity home

Offers a balance of services and community atmosphere.

Total beds 120

This home usually has availability

Lower occupancy suggests more openings may be available.

Lower demand than the Missouri average
Occupancy rate 56.7%
Residents per day (avg) 70
Occupancy rate
56.7%
Residents per day (avg)
70

Who this home usually serves

TYPE OF STAY

Mostly long-term care residents

Most residents stay for extended periods and receive ongoing daily care.

Might be optimal for
Long-term daily care Ongoing support needs

Breakdown by payment type

Medicare

24% of new residents, usually for short-term rehab.

Typical stay 1 - 2 months

Private pay

45% of new residents, often for short stays.

Typical stay 3 - 4 months

Medicaid

32% of new residents, often for long-term daily care.

Typical stay 1 - 2 years

Finances and operations

Privately-owned community
Operated by a business corporation.
Home revenue
$6.2M
Operating loss
-$37.7K
Privately-owned community Operated by a business corporation.
Home revenue
$6,188,517.00
Operating loss
$-37,722.00
Payroll costs Info The portion of the home's budget spent on staff, including nurses, caregivers, and other employees who support care and operations.
$2.4M
38.2% of revenue
Other operating costs Info All remaining costs needed to run the home, such as food, utilities, building maintenance, supplies and administrative expenses.
$3.9M
Total costs $6.2M
Bed community size
120-bed community
A larger shared setting that may offer more common spaces and organized community services.
Walk Score
Walk Score: 53 / 100
Moderately walkable. Some errands can be accomplished on foot, with a mix of nearby amenities.

About this community

Occupancy

Occupancy rate
57%
In line with Missouri average
Occupied beds
68 / 120
Average residents 72 per day

License Details

Facility TypeSnf
CountyCOLE

Ownership & Operating Entity

Stonebridge Villa Marie is legally operated by Eldercare Of Mid-missouri Vii, Inc, and administrated by Mcbryant.

Corporate EntityELDERCARE OF MID-MISSOURI VII, INC

Types of Care at Stonebridge Villa Marie

Memory Care Nursing Home
Contact Stonebridge Villa Marie

Access & Eligibility

Ways to qualify for care at this community, including accepted programs and payment options.

Medicare Accepted

This facility is certified for eligible Medicare services.

Payment & Funding Options

Medicare

Inspection History

In Missouri, the Department of Health and Senior Services, Division of Regulation and Licensure performs the inspections and unannounced surveys required for all long-term care providers.

6 visits/inspections

2 visits/inspections triggered by complaints

3 routine inspections

Results

6 with issues

0 without issues

Latest inspection

Date July 17, 2025
Annual Inspection

36 deficiencies

Deficiencies indicate regulatory issues. A higher number implies the facility had several areas requiring improvement.

Missouri average: 35 deficiencies

Health Inspection History

Inspections
Total health inspections 7

Missouri average 6.6


Last Health inspection on Jul 2025

Total health citations 36

Missouri average 36.5

Citations per inspection
5.14

Missouri average 5.67


Health citations are formal notices following inspections when they fail to comply with safety and care standards.

29 of 36 citations resulted from standard inspections; 6 of 36 resulted from complaint investigations; and 1 of 36 came from combined inspections (standard and complaint).

Breakdown of citation severity (last 3 years)
Critical Health citations More info 0
100% better than Missouri average

Missouri average: 0.7


Serious Health citations More info 1
In line with Missouri average

Missouri average: 1

0 critical citations More info Missouri average: 0.7

1 serious citation More info Missouri average: 1

33 moderate citations More info Missouri average: 33.6

2 minor citations More info Missouri average: 1.2
Citations history (last 3 years)
Infection Control moderate citation Info Issues related to preventing and controlling infections, including hygiene practices and safety protocols. Jul 17, 2025
Corrected

Care Planning moderate citation Info Issues related to creating and updating personalized care plans for residents based on their needs and conditions. Jul 17, 2025
Corrected

Abuse/Neglect moderate citation Info Issues related to protecting resident's from harm, including abuse, neglect, or mistreatment. Jan 22, 2025
Corrected

Abuse/Neglect moderate citation Info Issues related to protecting resident's from harm, including abuse, neglect, or mistreatment. Jan 22, 2025
Corrected

Compare Nursing Homes around Jefferson City The information below is reported by the Missouri Department of Health and Senior Services, Division of Regulation and Licensure.

5 facilities compared · CMS & MO Dept. of Health data · Updated Apr 2026

Filter by care type
Jefferson City Manor
NH

Nursing Home Licensed facility providing 24/7 skilled nursing care for residents with complex, ongoing medical needs. Staffed by RNs, LPNs, and CNAs. Inspected and star-rated annually by CMS. Accepts Medicare (short-term rehab) and Medicaid (long-term care).

AL

Assisted Living A licensed, long-term care setting for seniors or individuals with disabilities who need help with daily activities — like bathing, dressing, and medication management — but not 24-hour skilled nursing. Offers housing, meals, and around-the-clock support while aiming to maximize resident independence.

Jefferson City
102
70.2%
+5%
3.53
-26%
-5%
1
34
3.4
2
61
4
Juckette, Cynthia
$13.0M
$2.4M
18.3%
265285
1 Bed
Stonebridge Adams Street
NH

Nursing Home Licensed facility providing 24/7 skilled nursing care for residents with complex, ongoing medical needs. Staffed by RNs, LPNs, and CNAs. Inspected and star-rated annually by CMS. Accepts Medicare (short-term rehab) and Medicaid (long-term care).

AL

Assisted Living A licensed, long-term care setting for seniors or individuals with disabilities who need help with daily activities — like bathing, dressing, and medication management — but not 24-hour skilled nursing. Offers housing, meals, and around-the-clock support while aiming to maximize resident independence.

Jefferson City
120
44.9%
-33%
3.67
-14%
-2%
1
37
4.6
1
49
54
Volkart, Ruth
$5.1M
$2.3M
44.4%
265810
1 Bed
River City Living Community
NH

Nursing Home Licensed facility providing 24/7 skilled nursing care for residents with complex, ongoing medical needs. Staffed by RNs, LPNs, and CNAs. Inspected and star-rated annually by CMS. Accepts Medicare (short-term rehab) and Medicaid (long-term care).

AL

Assisted Living A licensed, long-term care setting for seniors or individuals with disabilities who need help with daily activities — like bathing, dressing, and medication management — but not 24-hour skilled nursing. Offers housing, meals, and around-the-clock support while aiming to maximize resident independence.

Jefferson City
87
52.6%
-21%
5.38
+6%
+44%
2
44
4.4
2
38
17
-
$4.0M
$1.7M
41.5%
265482
1 Bed
Stonebridge Villa Marie
NH

Nursing Home Licensed facility providing 24/7 skilled nursing care for residents with complex, ongoing medical needs. Staffed by RNs, LPNs, and CNAs. Inspected and star-rated annually by CMS. Accepts Medicare (short-term rehab) and Medicaid (long-term care).

AL

Assisted Living A licensed, long-term care setting for seniors or individuals with disabilities who need help with daily activities — like bathing, dressing, and medication management — but not 24-hour skilled nursing. Offers housing, meals, and around-the-clock support while aiming to maximize resident independence.

Jefferson City
120
53.0%
-20%
3.82
-36%
+2%
0
36
5.1
1
70
53
Lierman, Mark
$6.1M
$2.4M
38.5%
265208
1 Bed
Capitol River Wellness & Rehabilitation
-
NH

Nursing Home Licensed facility providing 24/7 skilled nursing care for residents with complex, ongoing medical needs. Staffed by RNs, LPNs, and CNAs. Inspected and star-rated annually by CMS. Accepts Medicare (short-term rehab) and Medicaid (long-term care).

AL

Assisted Living A licensed, long-term care setting for seniors or individuals with disabilities who need help with daily activities — like bathing, dressing, and medication management — but not 24-hour skilled nursing. Offers housing, meals, and around-the-clock support while aiming to maximize resident independence.

JEFFERSON CITY
120
-
-
-
-
-
-
-
-
0
0
0.0
0
-
-
-
-
-
-
-
-

Places of interest near Stonebridge Villa Marie

Address 1.5 miles from city center — 0.68 miles to nearest hospital (OB/GYN Clinic-Jefferson City)

Address 1030 Edmonds St, Jefferson City, MO 65109

Calculate Travel Distance to Stonebridge Villa Marie

Add your location

Address

Staffing Data (Q2 2025)

This data corresponds to Q2 2025 and is based on CMS Payroll-Based Journal.

Total staff 202
Employees 63
Contractors 139
Staff to resident ratio 3.06:1
79% better than Missouri average

Missouri average ratio: 1.71:1

Avg staff/day 38
Average shift 7.8 hours
0% compared with Missouri average

Missouri average: 8.1 hours

Total staff hours (quarter) 26,984
Nursing staff breakdown
Registered Nurse

Manages medical care and health needs.

Total count 10
Average shift length Info Average shift length. Calculated as total hours divided by days worked and average staff per day. 8.9 hours

This role is partially covered by contractors.

Licensed Practical Nurse

Assists with medical care and medications.

Total count 33
Average shift length Info Average shift length. Calculated as total hours divided by days worked and average staff per day. 9.3 hours

This role is partially covered by contractors.

Certified Nursing Assistant

Helps with daily care and mobility.

Total count 112
Average shift length Info Average shift length. Calculated as total hours divided by days worked and average staff per day. 7.7 hours

This role is partially covered by contractors.

Contractor staffing

Total hours from contractors

24.3%

6,555 contractor hours this quarter

Certified Nursing Assistant: 80 Licensed Practical Nurse: 29 Medication Aide/Technician: 11 Registered Nurse: 7 Speech Language Pathologist: 5 Qualified Social Worker: 1 Physical Therapy Aide: 1 Physical Therapy Assistant: 1 Respiratory Therapy Technician: 1 Occupational Therapy Aide: 1 Medical Director: 1 Occupational Therapy Assistant: 1
Staff by category
Certified Nursing Assistant328011212,65091100%7.7
Licensed Practical Nurse429333,66391100%9.3
Medication Aide/Technician911203,39391100%8.1
Other Dietary Services Staff4041,65391100%7.6
Registered Nurse37101,3878492%8.9
RN Director of Nursing2025977785%7.5
Clinical Nurse Specialist2025856470%8
Nurse Practitioner1015787279%8
Administrator1015126470%8
Dietitian1014215965%7.1
Nurse Aide in Training3033954347%7.5
Mental Health Service Worker1013404347%7.9
Qualified Social Worker0112964448%6.7
Physical Therapy Aide0111924347%4.5
Speech Language Pathologist0551443842%3.8
Occupational Therapy Aide011592123%2.8
Respiratory Therapy Technician011502730%1.9
Physical Therapy Assistant011432426%1.8
Occupational Therapy Assistant0112433%8
Medical Director011333%1
112 Certified Nursing Assistant
% of Days 100%
33 Licensed Practical Nurse
% of Days 100%
20 Medication Aide/Technician
% of Days 100%
4 Other Dietary Services Staff
% of Days 100%
10 Registered Nurse
% of Days 92%
2 RN Director of Nursing
% of Days 85%
2 Clinical Nurse Specialist
% of Days 70%
1 Nurse Practitioner
% of Days 79%
1 Administrator
% of Days 70%
1 Dietitian
% of Days 65%
3 Nurse Aide in Training
% of Days 47%
1 Mental Health Service Worker
% of Days 47%
1 Qualified Social Worker
% of Days 48%
1 Physical Therapy Aide
% of Days 47%
5 Speech Language Pathologist
% of Days 42%
1 Occupational Therapy Aide
% of Days 23%
1 Respiratory Therapy Technician
% of Days 30%
1 Physical Therapy Assistant
% of Days 26%
1 Occupational Therapy Assistant
% of Days 3%
1 Medical Director
% of Days 3%

Facility Characteristics

Source: CMS Long-Term Care Facility Characteristics (Data as of Jan 2026)

Total census
66 residents
Residents by payment source
Medicare
2 residents (3%)
Medicaid
30 residents (45.5%)
Private pay or other
34 residents (51.5%)
Programs & Services
Residents' Group

Residents meet regularly to discuss policies, care quality, and activities

Active Resident Council

Organized group of residents that meets regularly to discuss facility policies, quality of life, and activities.

Quality of care over time

These measures show how residents usually do over time at this home, based on health outcomes and preventive care.

High-risk clinical events score Info A composite score based on pressure ulcers, falls with injury, weight loss, walking ability decline, and activities of daily living decline. 15.1
38% worse than Missouri average

Missouri average: 10.9

Functional decline score Info A composite score based on activities of daily living decline, walking ability decline, and incontinence. 23.5
21% worse than Missouri average

Missouri average: 19.5

Long-stay resident measures
Significantly below average Missouri avg: 3.1 Info CMS star rating based on long-stay quality measure performance. 5 stars = significantly above average, 1 star = significantly below average.
Need for Help with Daily Activities Increased Info Percent of long-stay residents whose need for help with daily activities has increased 28.1%
42% worse than Missouri average

Missouri average: 19.8%

Walking Ability Worsened Info Percent of long-stay residents whose ability to move independently worsened 24.5%
19% worse than Missouri average

Missouri average: 20.6%

Low Risk Residents with Bowel/Bladder Incontinence Info Percent of low risk long-stay residents who lose control of their bowels or bladder 17.7%
In line with Missouri average

Missouri average: 18.1%

Falls with Major Injury Info Percent of long-stay residents experiencing one or more falls with major injury 6.5%
61% worse than Missouri average

Missouri average: 4.0%

High Risk Residents with Pressure Ulcers Info Percent of long-stay high risk residents with pressure ulcers 6.2%
23% worse than Missouri average

Missouri average: 5.0%

Urinary Tract Infection Info Percent of long-stay residents with a urinary tract infection 2.9%
6% worse than Missouri average

Missouri average: 2.7%

Lost Too Much Weight Info Percent of long-stay residents who lose too much weight 9.9%
78% worse than Missouri average

Missouri average: 5.6%

Depressive Symptoms Info Percent of long-stay residents who have depressive symptoms 30.8%
140% worse than Missouri average

Missouri average: 12.8%

Antipsychotic Use Info Percent of long-stay residents who received an antipsychotic medication 29.1%
32% worse than Missouri average

Missouri average: 22.0%

Pneumococcal Vaccine Info Percent of long-stay residents assessed and appropriately given the pneumococcal vaccine 72.0%
16% worse than Missouri average

Missouri average: 85.2%

Influenza Vaccine Info Percent of long-stay residents assessed and appropriately given the seasonal influenza vaccine 82.9%
9% worse than Missouri average

Missouri average: 90.9%

Hospitalizations per 1,000 days Info Number of hospitalizations per 1,000 long-stay resident days. 2.43
17% worse than Missouri average

Missouri average: 2.08

ED visits per 1,000 days Info Number of outpatient emergency department visits per 1,000 long-stay resident days. 1.15
51% better than Missouri average

Missouri average: 2.35

Short-stay resident measures
Significantly below average Missouri avg: 2.6 Info CMS star rating based on short-stay quality measure performance. 5 stars = much above average, 1 star = much below average.
Pneumococcal Vaccine Info Percent of short-stay residents assessed and appropriately given the pneumococcal vaccine 46.0%
31% worse than Missouri average

Missouri average: 66.6%

Antipsychotic medication increase Info Percent of short-stay residents who newly received an antipsychotic medication 11.8%
431% worse than Missouri average

Missouri average: 2.2%

Influenza Vaccine Info Percent of short-stay residents assessed and appropriately given the seasonal influenza vaccine 33.3%
47% worse than Missouri average

Missouri average: 63.5%

Re-hospitalized after SNF stay Info Percentage of short-stay residents who were re-hospitalized after their nursing home admission. 33.2%
31% worse than Missouri average

Missouri average: 25.3%

Emergency department visits Info Percentage of short-stay residents who had an outpatient emergency department visit. 13.8%
In line with Missouri average

Missouri average: 13.4%

Falls with major injury Info Percentage of SNF residents who experience falls with major injury during their stay. 5.0%
549% worse than Missouri average

Missouri average: 0.8%

Successful return to home or community Info Rate of successful return to home or community from a skilled nursing facility. 41.3%
18% worse than Missouri average

Missouri average: 50.6%

Guides for Better Senior Living

Care Cost Calculator: See Prices in Your Area

Nursing Home Data Explorer

Don’t Wait Too Long: 7 Red Flag Signs Your Parent Needs Assisted Living Now

The True Cost of Assisted Living in 2025 – And How Families Are Paying For It

Understanding Senior Living Costs: Pricing Models, Discounts & Financial Assistance

Financial Aid for Missouri Seniors

Get financial aid guidance

Aged and Disabled Waiver

Missouri Medicaid A&D Waiver

Age 65+ or disabled, Missouri resident, Medicaid- eligible, nursing home-level care need.

~$2,829/month (300% FBR, individual).

$2,000 (individual), $3,000 (couple).

Rural access prioritized.

Missouri Supplemental Nursing Care (SNC)

MO SNC

Age 65+, Missouri resident, in approved facility.

~$1,215/month (individual).

$2,000 (individual).

Supplements SSI; facility-based only.

Structured Family Caregiving Waiver (SFCW)

Missouri Structured Family Caregiving Waiver

Age 65+, Missouri resident, MO HealthNet-eligible, NFLOC, dementia diagnosis, live with caregiver.

~$2,901/month (300% FBR, individual); QIT required.

$5,909.25 (individual), $11,818.45 (couple).

Caregiver must be family; small program size.

MO HealthNet Aged, Blind, and Disabled (ABD)

Missouri MO HealthNet ABD

Age 65+ or disabled, Missouri resident, MO HealthNet-eligible, needs help with 1+ ADL.

~$1,690/month (individual, projected); spenddown allowed.

$5,909.25 (individual), $11,818.45 (couple).

Less intensive than waivers; statewide access.

Medicare Savings Program (MSP)

Missouri Medicare Savings Program

Age 65+ or disabled, Missouri resident, Medicare Part A/B.

~$2,510/month (QMB), ~$3,380/month (SLMB), ~$3,598/month (QI)—individual.

$9,430 (individual), $14,130 (couple).

Three tiers; no waitlist; includes Extra Help for Part D.

Missouri Caregiver Program (Customized Caregiver Training & Relief)

Missouri Caregiver Program

Caregivers of 60+ with dementia, Missouri resident, functional needs (2+ ADLs).

No strict cap; prioritizes low-income (~$24,980/year individual).

Not assessed; need-based.

Administered via AAAs and Alzheimer’s Association; rural focus.

Senior Community Service Employment Program (SCSEP)

Missouri SCSEP

Age 55+, unemployed, low-income, Missouri resident.

~$1,983/month (125% FPL).

Not specified; income-focused.

Priority for veterans, rural residents; AARP partnership.

VA Aid and Attendance (A&A) and Housebound Benefits

Missouri VA Aid and Attendance/Housebound

Age 65+ or disabled veteran/spouse, Missouri resident, wartime service, need for ADL help (A&A) or homebound.

Net income < ~$1,984/month (veteran with dependent, A&A); pension offsets income.

~$155,356 (net worth limit).

High veteran demand in rural/urban areas.

Tour Icon
Planning a tour? Check our touring checklist.
Chat Icon
Thinking of living here? We can help you speak to a current resident