Explore Open Rooms

1 Contact details
2 What type of senior care service are you looking for?
3 What budget do you have in mind for senior care?
4 How soon do you need to find care?
5 Additional details

Thank you for your interest!

Our team will be in touch shortly to help with next steps.

Memory Care Home

StoneRidge Senior Living

Memory Care Home

StoneRidge Senior Living

186 Jerry Browne Rd Building #1, Mystic, CT 06355 View map
Overview of Stoneridge Senior Living

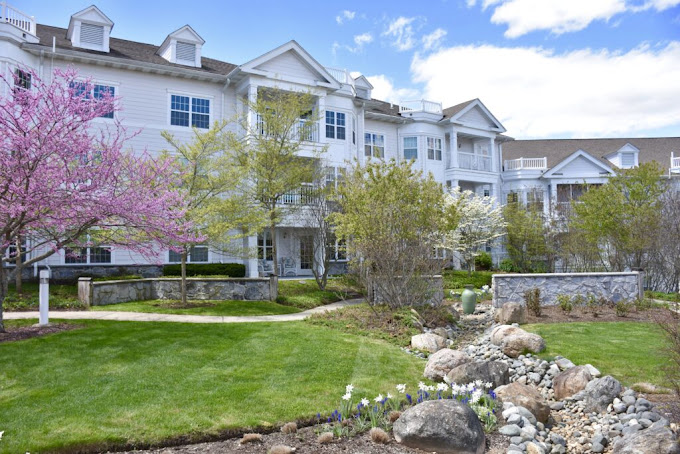
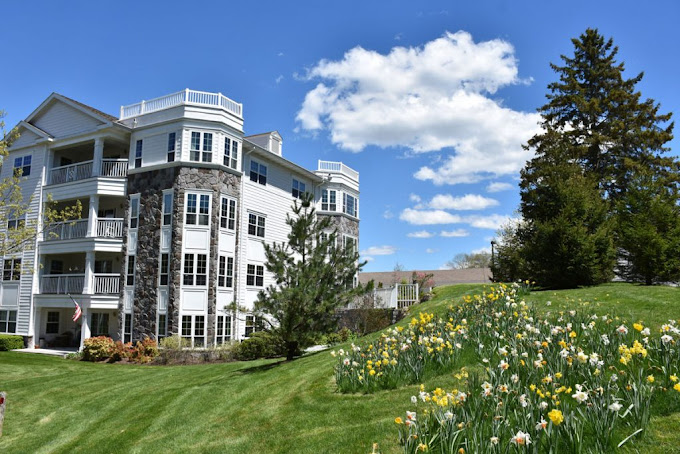
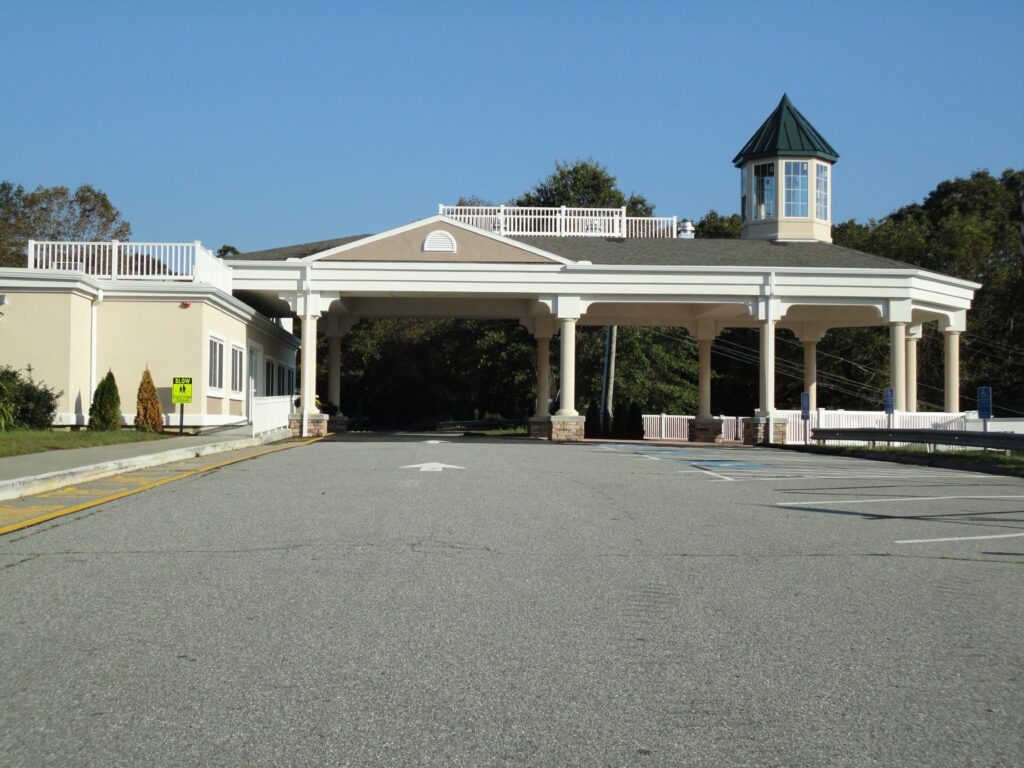
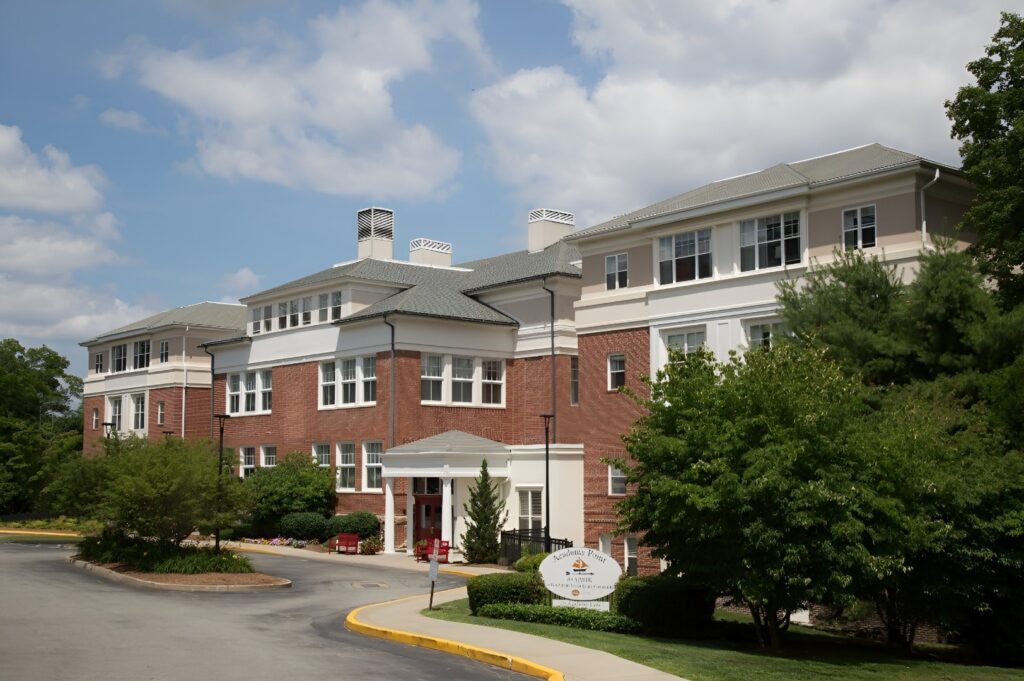
Tucked in the tranquil grounds of Jerry Browne Road, Mystic, CT, Stone Ridge Senior Living is a distinguished senior living community offering a wide array of care services including independent living, assisted living, memory care, skilled nursing, rehabilitation, respite care, and hospice care. As a Life Care Services community, Stone Ridge provides the highest quality of care and assistance to ensure seniors live their lives to the fullest. The community was also awarded the Best Nursing Home for Short-Term Rehabilitation by U.S. News from 2022 to 2023, proving its exceptional quality.

The community promotes a bright and friendly environment, conducting a variety of enriching activities and engaging programs for residents to thrive and gain meaningful experiences. Here, residents enjoy hassle-free dining with diverse dining options that cater to dietary needs and preferences. With its community surrounded by lush trees and scenic nature, seniors can rest assured of having a relaxed and quiet retirement.

(860) 572-5600

Quality ratings

Measured by Centers for Medicare & Medicaid Services (CMS)

Overall rating Info The Overall CMS Rating combines results from health inspections, staffing levels and quality measures. Health inspections carry the most weight. Staffing and quality scores can increase or decrease the final rating based on performance compared to state and national standards.
5/5
Connecticut average: 3.0/5
Health Inspection Info Based on the results of the facility's three most recent standard inspections and any complaint investigations. CMS reviews the number, scope, and severity of deficiencies, with more recent findings weighted more heavily.
5/5
Connecticut average: 2.8/5
Staffing Info Measures average nursing staff hours per resident per day, including Registered Nurses (RNs) and total nursing staff. Ratings are adjusted based on the level of care residents require and are compared to state and national benchmarks.
5/5
Connecticut average: 3.2/5
Quality Measures Info Based on clinical and physical health indicators reported to CMS, such as hospital readmissions, falls, pressure ulcers, and improvements in mobility. These measures reflect how well residents' health needs are being managed.
5/5
Connecticut average: 3.5/5

Nursing care per resident

Info This shows how many total hours of nursing staff time are available per resident each day. Higher numbers usually mean more staff support.
5h 41m per day

This home provides 43% more nursing time per resident than the Connecticut average.

Connecticut average: 3h 58m per day

Staffing hours breakdown

Info Hours of care per resident per day, broken down by staff type. Data from CMS Medicare.
Staff type Facility State avg National avg
Registered Nurse (RN) Info Registered nurse hours per resident per day. 2h 11m per day 42m per day 41m per day
Nurse Aide Info Nurse aide hours per resident per day. 2h 40m per day 2h 17m per day 2h 21m per day
Total Nursing (Weekend) Info Total number of nurse staff hours per resident per day on weekends. 4h 29m per day 3h 25m per day 3h 26m per day
Physical Therapist Info Physical therapist staff hours per resident per day. 2m per day 5m per day 4m per day
RN (Weekend) Info Registered nurse hours per resident per day on weekends. 1h 33m per day 28m per day 29m per day

Capacity and availability

Smaller home

May offer a more intimate, personalized care environment.

Total beds 58

This home usually has availability

Lower occupancy suggests more openings may be available.

Lower demand than the Connecticut average
Occupancy rate 70.4%
Residents per day (avg) 34
Occupancy rate
70.4%
Residents per day (avg)
34

Who this home usually serves

TYPE OF STAY

Mostly short-term rehab stays

Most residents typically stay for a few weeks or months before returning home or moving on.

Might be optimal for
Short stays Recovery Medicare-covered care

Breakdown by payment type

Medicare

52% of new residents, usually for short-term rehab.

Typical stay 22 days

Private pay

48% of new residents, often for short stays.

Typical stay 4 - 5 months

Finances and operations

Privately-owned community
Operated by a partnership between two or more business owners.
Home revenue
$29.8M
Operating loss
-$7.0M
Privately-owned community Operated by a partnership between two or more business owners.
Home revenue
$29,783,334.00
Operating loss
$-7,026,778.00
Payroll costs Info The portion of the home's budget spent on staff, including nurses, caregivers, and other employees who support care and operations.
$9.5M
31.9% of revenue
Other operating costs Info All remaining costs needed to run the home, such as food, utilities, building maintenance, supplies and administrative expenses.
$27.3M
Total costs $36.8M

What does this home offer?

Pets allowed icon
Pets allowed icon

Pets Allowed: Yes, Pets Allowed

Housing options icon

Housing Options: Studio / 1 Bed / 2 Bed

Building type icon
Building type icon

Building Type: Mid-rise

Transportation services icon

Transportation Services

Fitness and recreation icon

Fitness and Recreation

Types of Care at StoneRidge Senior Living

Independent Living Assisted Living Memory Care
Contact StoneRidge Senior Living

Health Inspection History

Inspections
Total health inspections 3

Connecticut average 5.7


Last Health inspection on Sep 2024

Total health citations 5

Connecticut average 32

Citations per inspection
1.67

Connecticut average 5.82


Health citations are formal notices following inspections when they fail to comply with safety and care standards.

All 5 citations resulted from standard inspections.

Breakdown of citation severity (last 3 years)
Critical Health citations More info 0
100% better than Connecticut average

Connecticut average: 0.3


Serious Health citations More info 1
43% worse than Connecticut average

Connecticut average: 0.7

0 critical citations More info Connecticut average: 0.3

1 serious citation More info Connecticut average: 0.7

4 moderate citations More info Connecticut average: 28.8

0 minor citations More info Connecticut average: 2.3
Citations history (last 3 years)
Quality of Care serious citation Info Issues related to how well residents receive appropriate treatment and support for their medical and daily care needs. Sep 27, 2024
Corrected

Care Planning moderate citation Info Issues related to creating and updating personalized care plans for residents based on their needs and conditions. Sep 27, 2024
Corrected

Care Planning moderate citation Info Issues related to creating and updating personalized care plans for residents based on their needs and conditions. Sep 27, 2024
Corrected

Quality of Care moderate citation Info Issues related to how well residents receive appropriate treatment and support for their medical and daily care needs. Jun 23, 2022
Corrected

Compare Memory Care around Mystic The information below is reported by the Connecticut Department of Public Health, Facility Licensing and Investigations Section.

Mystic Healthcare
AL

Assisted Living A licensed, long-term care setting for seniors or individuals with disabilities who need help with daily activities — like bathing, dressing, and medication management — but not 24-hour skilled nursing. Offers housing, meals, and around-the-clock support while aiming to maximize resident independence.

IL

Independent Living Lifestyle-focused communities for older adults offering dining, activities, and transportation with minimal personal care. Best for active, independent seniors who want community without medical support.

MC

Memory Care Secured, specialized care for people living with Alzheimer's or dementia. Staff trained in cognitive impairment, with higher staff-to-resident ratios and an environment designed to reduce confusion and wandering risk.

NH

Nursing Home Licensed facility providing 24/7 skilled nursing care for residents with complex, ongoing medical needs. Staffed by RNs, LPNs, and CNAs. Inspected and star-rated annually by CMS. Accepts Medicare (short-term rehab) and Medicaid (long-term care).

Mystic (Mystic)
100
No
-
18
Studio / 1 Bed / 2 Bed
StoneRidge Senior Living
AL

Assisted Living A licensed, long-term care setting for seniors or individuals with disabilities who need help with daily activities — like bathing, dressing, and medication management — but not 24-hour skilled nursing. Offers housing, meals, and around-the-clock support while aiming to maximize resident independence.

IL

Independent Living Lifestyle-focused communities for older adults offering dining, activities, and transportation with minimal personal care. Best for active, independent seniors who want community without medical support.

MC

Memory Care Secured, specialized care for people living with Alzheimer's or dementia. Staff trained in cognitive impairment, with higher staff-to-resident ratios and an environment designed to reduce confusion and wandering risk.

NH

Nursing Home Licensed facility providing 24/7 skilled nursing care for residents with complex, ongoing medical needs. Staffed by RNs, LPNs, and CNAs. Inspected and star-rated annually by CMS. Accepts Medicare (short-term rehab) and Medicaid (long-term care).

Mystic (Mystic)
58
Yes
-
24
Studio / 1 Bed / 2 Bed
Academy Point at Mystic
AL

Assisted Living A licensed, long-term care setting for seniors or individuals with disabilities who need help with daily activities — like bathing, dressing, and medication management — but not 24-hour skilled nursing. Offers housing, meals, and around-the-clock support while aiming to maximize resident independence.

MC

Memory Care Secured, specialized care for people living with Alzheimer's or dementia. Staff trained in cognitive impairment, with higher staff-to-resident ratios and an environment designed to reduce confusion and wandering risk.

RC

Respite Care Short-term temporary care — days to weeks — to give family caregivers a break. Full care provided during the stay. Often used after hospitalization or to trial a facility before a permanent placement decision.

Mystic (Mystic)
-
Yes
F
64
Studio / 1 Bed / 2 Bed

Living Spaces & Floor Plans

Stoneridge Senior Living6
Stoneridge Senior Living9
Stoneridge Senior Living8
Stoneridge Senior Living7

Places of interest near StoneRidge Senior Living

Address 2.2 miles from city center

Address 186 Jerry Browne Rd Building #1, Mystic, CT 06355

Calculate Travel Distance to StoneRidge Senior Living

Add your location

Address

Staffing Data (Q2 2025)

This data corresponds to Q2 2025 and is based on CMS Payroll-Based Journal.

Total staff 83
Employees 70
Contractors 13
Staff to resident ratio 2.13:1
13% better than Connecticut average

Connecticut average ratio: 1.88:1

Avg staff/day 35
Average shift 6.8 hours
9% worse than Connecticut average

Connecticut average: 7.5 hours

Total staff hours (quarter) 21,726
Nursing staff breakdown
Registered Nurse

Manages medical care and health needs.

Total count 21
Average shift length Info Average shift length. Calculated as total hours divided by days worked and average staff per day. 7.3 hours

No contractors work on this role.

Licensed Practical Nurse

Assists with medical care and medications.

Total count 4
Average shift length Info Average shift length. Calculated as total hours divided by days worked and average staff per day. 8 hours

No contractors work on this role.

Certified Nursing Assistant

Helps with daily care and mobility.

Total count 27
Average shift length Info Average shift length. Calculated as total hours divided by days worked and average staff per day. 7 hours

No contractors work on this role.

Contractor staffing

Total hours from contractors

9.3%

2,019 contractor hours this quarter

Medical Director: 3 Speech Language Pathologist: 2 Respiratory Therapy Technician: 2 Qualified Social Worker: 1 Physical Therapy Assistant: 1 Feeding Assistant: 1 Occupational Therapy Aide: 1 Physical Therapy Aide: 1 Occupational Therapy Assistant: 1
Staff by category
Certified Nursing Assistant270278,43991100%7
Registered Nurse210215,07791100%7.3
Other Dietary Services Staff6061,48191100%6.7
Clinical Nurse Specialist7071,3117785%8
Licensed Practical Nurse4041,2988897%8
Dental Services Staff3031,1747380%7.8
Speech Language Pathologist0227726976%6.2
Nurse Practitioner1014966268%8
Administrator1014325459%8
Physical Therapy Aide0114095864%7
Qualified Social Worker0112125055%4.2
Physical Therapy Assistant0111975864%3.4
Medical Director0331303943%3.3
Occupational Therapy Aide0111002629%3.8
Respiratory Therapy Technician022995662%1.7
Feeding Assistant011782629%3
Occupational Therapy Assistant011243336%0.7
27 Certified Nursing Assistant
% of Days 100%
21 Registered Nurse
% of Days 100%
6 Other Dietary Services Staff
% of Days 100%
7 Clinical Nurse Specialist
% of Days 85%
4 Licensed Practical Nurse
% of Days 97%
3 Dental Services Staff
% of Days 80%
2 Speech Language Pathologist
% of Days 76%
1 Nurse Practitioner
% of Days 68%
1 Administrator
% of Days 59%
1 Physical Therapy Aide
% of Days 64%
1 Qualified Social Worker
% of Days 55%
1 Physical Therapy Assistant
% of Days 64%
3 Medical Director
% of Days 43%
1 Occupational Therapy Aide
% of Days 29%
2 Respiratory Therapy Technician
% of Days 62%
1 Feeding Assistant
% of Days 29%
1 Occupational Therapy Assistant
% of Days 36%

Facility Characteristics

Source: CMS Long-Term Care Facility Characteristics (Data as of Jan 2026)

Total census
39 residents
Residents by payment source
Medicare
11 residents (28.2%)
Private pay or other
28 residents (71.8%)
Programs & Services
Residents' Group

Residents meet regularly to discuss policies, care quality, and activities

CCRC

Part of a Continuing Care Retirement Community offering multiple care levels

Active Resident Council

Organized group of residents that meets regularly to discuss facility policies, quality of life, and activities.

Quality of care over time

These measures show how residents usually do over time at this home, based on health outcomes and preventive care.

High-risk clinical events score Info A composite score based on pressure ulcers, falls with injury, weight loss, walking ability decline, and activities of daily living decline. 10.2
In line with Connecticut average

Connecticut average: 10.4

Functional decline score Info A composite score based on activities of daily living decline, walking ability decline, and incontinence. 24.8
18% worse than Connecticut average

Connecticut average: 21.1

Long-stay resident measures
Above average Connecticut avg: 3.2 Info CMS star rating based on long-stay quality measure performance. 5 stars = significantly above average, 1 star = significantly below average.
Need for Help with Daily Activities Increased Info Percent of long-stay residents whose need for help with daily activities has increased 18.8%
In line with Connecticut average

Connecticut average: 18.9%

Walking Ability Worsened Info Percent of long-stay residents whose ability to move independently worsened 24.1%
26% worse than Connecticut average

Connecticut average: 19.2%

Low Risk Residents with Bowel/Bladder Incontinence Info Percent of low risk long-stay residents who lose control of their bowels or bladder 31.5%
26% worse than Connecticut average

Connecticut average: 24.9%

Falls with Major Injury Info Percent of long-stay residents experiencing one or more falls with major injury 2.7%
23% better than Connecticut average

Connecticut average: 3.5%

High Risk Residents with Pressure Ulcers Info Percent of long-stay high risk residents with pressure ulcers 2.9%
37% better than Connecticut average

Connecticut average: 4.6%

Urinary Tract Infection Info Percent of long-stay residents with a urinary tract infection 2.7%
62% worse than Connecticut average

Connecticut average: 1.7%

Lost Too Much Weight Info Percent of long-stay residents who lose too much weight 2.6%
59% better than Connecticut average

Connecticut average: 6.3%

Depressive Symptoms Info Percent of long-stay residents who have depressive symptoms 0.0%
100% better than Connecticut average

Connecticut average: 15.2%

Antipsychotic Use Info Percent of long-stay residents who received an antipsychotic medication 15.0%
12% better than Connecticut average

Connecticut average: 17.2%

Pneumococcal Vaccine Info Percent of long-stay residents assessed and appropriately given the pneumococcal vaccine 100.0%
14% better than Connecticut average

Connecticut average: 87.5%

Influenza Vaccine Info Percent of long-stay residents assessed and appropriately given the seasonal influenza vaccine 100.0%
7% better than Connecticut average

Connecticut average: 93.5%

Hospitalizations per 1,000 days Info Number of hospitalizations per 1,000 long-stay resident days. 1.42
32% better than Connecticut average

Connecticut average: 2.10

ED visits per 1,000 days Info Number of outpatient emergency department visits per 1,000 long-stay resident days. 0.92
40% better than Connecticut average

Connecticut average: 1.53

Short-stay resident measures
Significantly above average Connecticut avg: 3.3 Info CMS star rating based on short-stay quality measure performance. 5 stars = much above average, 1 star = much below average.
Pneumococcal Vaccine Info Percent of short-stay residents assessed and appropriately given the pneumococcal vaccine 89.4%
28% better than Connecticut average

Connecticut average: 70.1%

Antipsychotic medication increase Info Percent of short-stay residents who newly received an antipsychotic medication 0.0%
100% better than Connecticut average

Connecticut average: 1.5%

Influenza Vaccine Info Percent of short-stay residents assessed and appropriately given the seasonal influenza vaccine 96.6%
38% better than Connecticut average

Connecticut average: 69.8%

Re-hospitalized after SNF stay Info Percentage of short-stay residents who were re-hospitalized after their nursing home admission. 11.9%
52% better than Connecticut average

Connecticut average: 25.0%

Emergency department visits Info Percentage of short-stay residents who had an outpatient emergency department visit. 15.7%
41% worse than Connecticut average

Connecticut average: 11.1%

Falls with major injury Info Percentage of SNF residents who experience falls with major injury during their stay. 0.0%
100% better than Connecticut average

Connecticut average: 0.8%

Ability to care for self at discharge Info Percentage of residents at or above expected ability to care for themselves at discharge. 52.8%
In line with Connecticut average

Connecticut average: 53.7%

Successful return to home or community Info Rate of successful return to home or community from a skilled nursing facility. 62.9%
24% better than Connecticut average

Connecticut average: 50.6%

Penalties and fines

Federal penalties imposed by CMS for regulatory violations, including civil money penalties (fines) and denials of payment for new Medicare/Medicaid admissions.

Source: CMS Penalties Database (Data as of Jan 2026)

Total fines amount $8K
82% lower than Connecticut average

Connecticut average: $44K

Number of fines 1
43% fewer fines than Connecticut average

Connecticut average: 1.7

Payment Denials Info Serious action where Medicare and/or Medicaid temporarily stops payments for new residents until issues are fixed. 0
100% fewer payment denials than Connecticut average

Connecticut average: 0.1

Fines amount comparison
This facility $8K
Connecticut average $44K
Penalty History

Penalties are imposed by CMS for violations of federal nursing home regulations.

Civil Money Penalty Info Fines imposed for noncompliance, which can be assessed per day or per instance of violation. Sep 27, 2024
$8K

Last updated: Jan 2026

Guides for Better Senior Living

Care Cost Calculator: See Prices in Your Area

Nursing Home Data Explorer

Don’t Wait Too Long: 7 Red Flag Signs Your Parent Needs Assisted Living Now

The True Cost of Assisted Living in 2025 – And How Families Are Paying For It

Understanding Senior Living Costs: Pricing Models, Discounts & Financial Assistance

Financial Aid for Connecticut Seniors

Get financial aid guidance

Connecticut Home Care Program for Elders

CHCPE

Age 65+, Connecticut resident, at risk of nursing home placement.

State-funded: ~$1,600/month; Medicaid: ~$2,829/month (300% FBR).

$1,600 (state), $2,000 (Medicaid, individual).

Two tiers (state and Medicaid); waitlists possible.

Statewide Respite Care Program

CT Respite Care

Caregiver of senior with dementia, Connecticut resident.

~$2,500/month (individual, varies).

$40,000 (individual).

Limited to dementia caregivers; capped funding.

Congregate Housing Services Program (CHSP)

Connecticut Congregate Housing Services Program

Age 62+, Connecticut resident, frail but not needing 24/7 care, resides in CHSP-eligible housing.

~$41,000/year (individual, adjusted annually).

Not specified; focus is income-based.

Limited to 14 state-subsidized sites; participants pay 10% of service costs.

Medicare Savings Program (MSP)

Connecticut Medicare Savings Program

Age 65+ or disabled, Connecticut resident, enrolled in Medicare Part A/B.

~$2,510/month (individual, QMB); ~$3,380/month (SLMB); ~$3,598/month (ALMB)—adjusted annually.

None since 2023 policy change.

Three tiers (Qualified Medicare Beneficiary, Specified Low-Income, Additional Low-Income); no asset test.

Senior Community Service Employment Program (SCSEP)

Connecticut SCSEP (federally funded, state-administered)

Age 55+, unemployed, low-income, Connecticut resident.

~$1,983/month (125% FPL, individual).

Not specified; income-focused.

Priority for veterans, rural residents; limited slots (~500/year).

Tour Icon
Planning a tour? Check our touring checklist.
Chat Icon
Thinking of living here? We can help you speak to a current resident