StoneRidge Senior Living
Nursing Home, Assisted Living, Independent Living & Memory Care · Connecticut, CT
CMS overall rating Info CMS (the Centers for Medicare & Medicaid Services) is the federal agency that rates nursing home quality. Its Overall Rating runs from 1 to 5 stars, combining health inspections, staffing, and quality measures, with inspections weighted most heavily.

StoneRidge Senior Living

Nursing Home, Assisted Living, Independent Living & Memory Care · Connecticut, CT
CMS overall rating Info CMS (the Centers for Medicare & Medicaid Services) is the federal agency that rates nursing home quality. Its Overall Rating runs from 1 to 5 stars, combining health inspections, staffing, and quality measures, with inspections weighted most heavily.
Calculator: See prices in your area
StoneRidge Senior Living accepts Medicare and private pay.

Overview of Stoneridge Senior Living

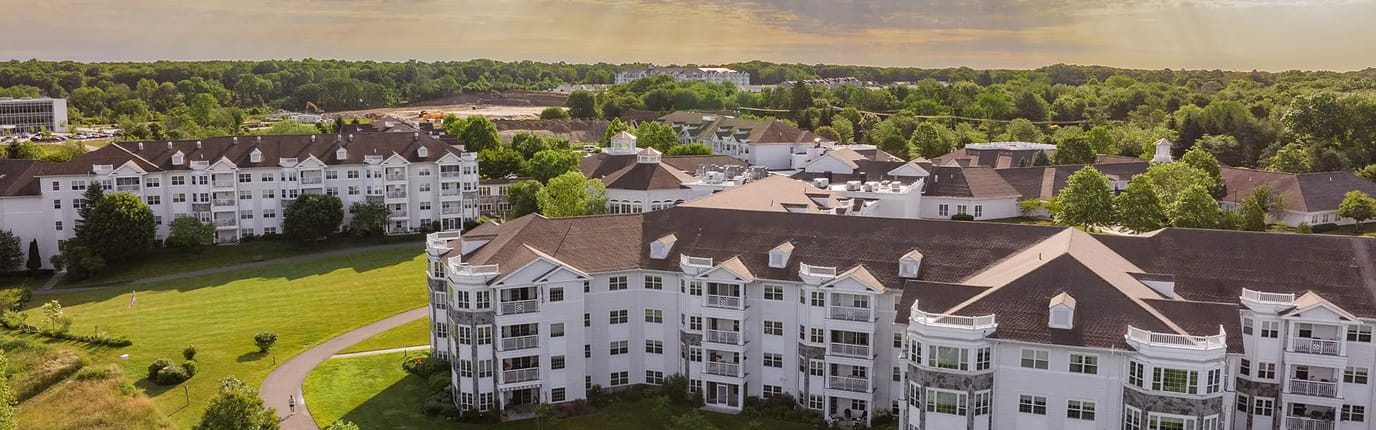
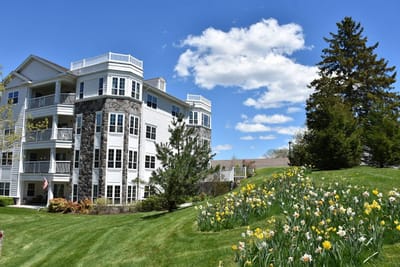
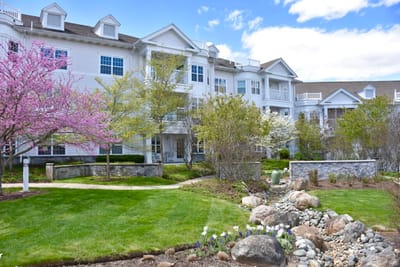
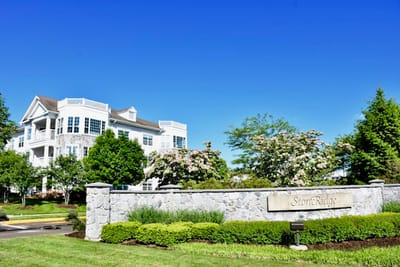
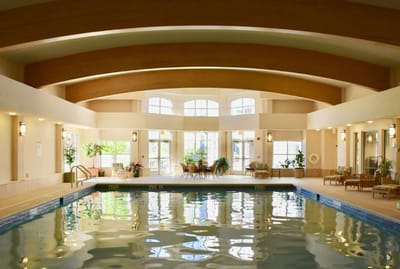
Tucked in the tranquil grounds of Jerry Browne Road, Mystic, CT, Stone Ridge Senior Living is a distinguished senior living community offering a wide array of care services including independent living, assisted living, memory care, skilled nursing, rehabilitation, respite care, and hospice care. As a Life Care Services community, Stone Ridge provides the highest quality of care and assistance to ensure seniors live their lives to the fullest. The community was also awarded the Best Nursing Home for Short-Term Rehabilitation by U.S. News from 2022 to 2023, proving its exceptional quality.

The community promotes a bright and friendly environment, conducting a variety of enriching activities and engaging programs for residents to thrive and gain meaningful experiences. Here, residents enjoy hassle-free dining with diverse dining options that cater to dietary needs and preferences. With its community surrounded by lush trees and scenic nature, seniors can rest assured of having a relaxed and quiet retirement.

(860) 572-5600

Quality ratings

Measured by Centers for Medicare & Medicaid Services (CMS)

Overall rating Info The Overall CMS Rating combines results from health inspections, staffing levels and quality measures. Health inspections carry the most weight. Staffing and quality scores can increase or decrease the final rating based on performance compared to state and national standards.
▲ 64.4% Above CT avg. ▲ 64.4% Above CT avg.CT average: 3.0Click the badge to see the full State ranking.Click here to see the full State ranking.
Health Inspection Info Based on the results of the facility's three most recent standard inspections and any complaint investigations. CMS reviews the number, scope, and severity of deficiencies, with more recent findings weighted more heavily.
▲ 78.8% Above CT avg. ▲ 78.8% Above CT avg.CT average: 2.8Click the badge to see the full State ranking.Click here to see the full State ranking.
Staffing Info Measures average nursing staff hours per resident per day, including Registered Nurses (RNs) and total nursing staff. Ratings are adjusted based on the level of care residents require and are compared to state and national benchmarks.
▲ 54.1% Above CT avg. ▲ 54.1% Above CT avg.CT average: 3.2Click the badge to see the full State ranking.Click here to see the full State ranking.
Quality Measures Info Based on clinical and physical health indicators reported to CMS, such as hospital readmissions, falls, pressure ulcers, and improvements in mobility. These measures reflect how well residents' health needs are being managed.
▲ 42.1% Above CT avg. ▲ 42.1% Above CT avg.CT average: 3.5Click the badge to see the full State ranking.Click here to see the full State ranking.

Staffing hours breakdown

Info Daily nursing hours per resident by staff type, reported to CMS. Higher is generally better — compare this facility to state and national averages to see where staffing stands.

Hours per resident per day — compared to Connecticut state averages

Total nursing care / resident Info This home is ranked 3rd out of 67 homes in Connecticut for nurse hours. Total adjusted nursing hours per resident per day, combining RN, LPN, and aide time. CMS adjusts this for case-mix so facilities can be fairly compared.
5h 41m per day
Rank #3 / 67Nurse hours — State benchmarkedThis home is ranked 3rd out of 67 homes in Connecticut. Shows adjusted nurse hours per resident per day benchmarked to the Connecticut average, with a ranking across 67 Connecticut facilities. More hours mean more direct care. The national average is about 3.5 hrs; below 3.0 is a red flag.Rankings are based only on facilities in Connecticut that report data for that category. Facilities without available data are excluded from the ranking.Click the rank badge to see the full State ranking.Click here to see the full State ranking.
This facility Connecticut avg (3h 58m per day)
vs Connecticut avg
+43%

2 of 6 metrics below state avg

Standout metric Weekend RN is +227% above state avg
Staff typeHours / Day / Residentvs state avg
Registered Nurse (RN) Info RNs hold the highest nursing license and can assess residents, interpret test results, and direct care plans. More RN hours per day often signals stronger clinical oversight and faster response to health changes. 2h 5m per day ▲ 197% State avg: 42m per day · National avg: 41m per day
LPN / LVN Info Licensed Practical Nurses (LPNs) or Licensed Vocational Nurses (LVNs) deliver routine hands-on care — medication administration, wound dressing, and monitoring vital signs. They work under RN supervision and make up a large share of daily bedside care. 22m per day ▼ 56% State avg: 50m per day · National avg: 52m per day
Nurse Aide Info Certified Nurse Aides (CNAs) provide the most direct day-to-day assistance: bathing, dressing, feeding, and mobility. Nurse aide hours are typically the largest staffing category and directly affect residents' quality of life. 2h 40m per day ▲ 17% State avg: 2h 17m per day · National avg: 2h 21m per day
Weekend Total Nursing Info Combined nursing hours (RN + LPN + Nurse Aide) per resident per day on weekends. Staffing often drops on weekends — this figure reveals whether the facility maintains adequate coverage outside of weekday hours. 4h 27m per day ▲ 30% State avg: 3h 25m per day · National avg: 3h 26m per day
Physical Therapist Info Hours per resident per day provided by licensed Physical Therapists (PTs) or PT Assistants. PT services help residents recover mobility after injury or illness and are especially important for post-acute (short-stay) rehabilitation. 3m per day ▼ 37% State avg: 5m per day · National avg: 4m per day
Weekend RN Info Registered nurse hours specifically on weekends. Facilities sometimes reduce RN presence on Saturdays and Sundays — a low weekend RN figure compared to weekday hours can indicate reduced clinical oversight when most administrative staff are absent. 1h 32m per day ▲ 227% State avg: 28m per day · National avg: 29m per day

Capacity and availability

This home usually has availability

Lower occupancy than the Connecticut average: 84%
Occupancy rate
70.4% Rank #64 / 72Occupancy rate — State benchmarkedThis home is ranked 64th out of 72 homes in Connecticut. Shows this facility's occupancy rate versus the Connecticut average, with its Statewide rank out of 72. Higher occupancy signals strong local demand and financial stability.Rankings are based only on facilities in Connecticut that report data for that category. Facilities without available data are excluded from the ranking.Click the rank badge to see the full State ranking.Click here to see the full State ranking.
Avg. Length of Stay
63 days
Bed community size
40-bed community Rank #105 / 123Bed count — State benchmarkedThis home is ranked 105th out of 123 homes in Connecticut. Shows this facility's certified or reported bed count compared to other Connecticut facilities. Larger communities may offer more amenities, programs, and on-site services for residents and families.Rankings are based only on facilities in Connecticut that report data for that category. Facilities without available data are excluded from the ranking.Click the rank badge to see the full State ranking.Click here to see the full State ranking.
A moderately sized community that may balance personal attention with shared amenities and social activities.
Walk Score
Walk Score: 24 / 100 Rank #199 / 264Walk Score — State benchmarkedThis home is ranked 199th out of 264 homes in Connecticut. Shows how walkable this facility's neighborhood is compared to the average Walk Score across Connecticut facilities. Higher scores benefit residents, families, and staff.Rankings are based only on facilities in Connecticut that report data for that category. Facilities without available data are excluded from the ranking.Click the rank badge to see the full State ranking.Click here to see the full State ranking.
Car-dependent. Most errands require a car, with limited nearby walkable options.

Contact StoneRidge Senior Living

Staffing Data

Reporting period: October 1 – December 31, 2025 (Q4 2025). Source: CMS Payroll-Based Journal report.

Total staff 82
Employees 65
Contractors 17
Staff to resident ratio 2.10 : 1
13% more staff per resident than Connecticut average
Connecticut average ratio: 1.86 : 1 Connecticut average ratio: 1.86 : 1See full Connecticut ranking
Avg staff/day 35
Average shift 6.8 hours
9% worse than Connecticut average
Connecticut average: 7.5 hours Connecticut average shift: 7.5 hoursSee full Connecticut ranking
Total staff hours (quarter) 21,786

Nursing staff breakdown

Q4 2025 · Oct 1 – Dec 31 More info This data comes from the CMS Payroll-Based Journal report covering October 1 – December 31, 2025.
Registered Nurse

Manages medical care and health needs.

RN Staff Info All 21 RN Staff are full-time employees. No contractors work on this role. 21
Average shift length Info Average shift length. Calculated as total hours divided by days worked and average staff per day. 7.1 hours
Licensed Practical Nurse

Assists with medical care and medications.

LPN Staff Info All 3 LPN Staff are full-time employees. No contractors work on this role. 3
Average shift length Info Average shift length. Calculated as total hours divided by days worked and average staff per day. 8.2 hours
Certified Nursing Assistant

Helps with daily care and mobility.

CNA Staff Info All 26 CNA Staff are full-time employees. No contractors work on this role. 26
Average shift length Info Average shift length. Calculated as total hours divided by days worked and average staff per day. 7 hours

Contractor staffing

Q4 2025 · Oct 1 – Dec 31 More info This data comes from the CMS Payroll-Based Journal report covering October 1 – December 31, 2025.

Total hours from contractors

9.9%

2,158 contractor hours this quarter

Medical Director: 3 Physical Therapy Assistant: 3 Speech Language Pathologist: 3 Physical Therapy Aide: 2 Respiratory Therapy Technician: 2 Qualified Social Worker: 1 Feeding Assistant: 1 Occupational Therapy Assistant: 1 Occupational Therapy Aide: 1

Staff by category

Q4 2025 · Oct 1 – Dec 31 More info This data comes from the CMS Payroll-Based Journal report covering October 1 – December 31, 2025.
Certified Nursing Assistant260268,52992100%7
Registered Nurse210214,96592100%7.1
Clinical Nurse Specialist3031,1966672%8.1
Licensed Practical Nurse3031,1818693%8.2
Dental Services Staff3031,1487379%7.6
Other Dietary Services Staff5051,1448997%6.4
Speech Language Pathologist0337257683%5.4
Administrator2025046368%8
Dietitian1014886166%8
Nurse Practitioner1014725964%8
Physical Therapy Aide0224295964%7.1
Physical Therapy Assistant0333386166%5.2
Qualified Social Worker0111844852%3.8
Respiratory Therapy Technician0221675661%3
Medical Director0331324043%3.3
Occupational Therapy Aide011902628%3.4
Feeding Assistant011742527%3
Occupational Therapy Assistant011212729%0.8
26 Certified Nursing Assistant
% of Days 100%
21 Registered Nurse
% of Days 100%
3 Clinical Nurse Specialist
% of Days 72%
3 Licensed Practical Nurse
% of Days 93%
3 Dental Services Staff
% of Days 79%
5 Other Dietary Services Staff
% of Days 97%
3 Speech Language Pathologist
% of Days 83%
2 Administrator
% of Days 68%
1 Dietitian
% of Days 66%
1 Nurse Practitioner
% of Days 64%
2 Physical Therapy Aide
% of Days 64%
3 Physical Therapy Assistant
% of Days 66%
1 Qualified Social Worker
% of Days 52%
2 Respiratory Therapy Technician
% of Days 61%
3 Medical Director
% of Days 43%
1 Occupational Therapy Aide
% of Days 28%
1 Feeding Assistant
% of Days 27%
1 Occupational Therapy Assistant
% of Days 29%

Penalties and fines

Includes penalties issued in 2024

Federal penalties imposed by CMS for regulatory violations, including civil money penalties (fines) and denials of payment for new Medicare/Medicaid admissions.

Source: CMS Penalties Database (Data as of Jan 2026)

Total fines amount $8K Rank #37 / 69Federal fines — State benchmarkedThis home is ranked 37th out of 69 homes in Connecticut. Shows this facility's cumulative CMS federal fine dollars versus the Connecticut average among facilities with fines, and where it ranks among 69 facilities in the pool. Lower total dollars mean a better rank.Rankings are based only on facilities in Connecticut that report data for that category. Facilities without available data are excluded from the ranking.Click the rank badge to see the full State ranking.Click here to see the full State ranking.
82% lower than Connecticut average

Connecticut average: $44K

Number of fines 1
43% fewer fines than Connecticut average

Connecticut average: 1.7

Payment Denials Info Serious action where Medicare and/or Medicaid temporarily stops payments for new residents until issues are fixed. 0
100% fewer payment denials than Connecticut average

Connecticut average: 0.1

Fines amount comparison
This facility $8K
Connecticut average $44K
Penalty History

Penalties are imposed by CMS for violations of federal nursing home regulations.

1 penalty in the past 3 years

Sep 27, 2024 · $8K

Civil Money Penalty Info Fines imposed for noncompliance, which can be assessed per day or per instance of violation. Sep 27, 2024
$8K

Last updated: Jan 2026

Quality of care over time

These measures show how residents usually do over time at this home, based on health outcomes and preventive care.

High-risk clinical events score Info A composite score based on pressure ulcers, falls with injury, weight loss, walking ability decline, and activities of daily living decline. 10.2
In line with Connecticut average

Connecticut average: 10.4

Functional decline score Info A composite score based on activities of daily living decline, walking ability decline, and incontinence. 24.8
18% worse than Connecticut average

Connecticut average: 21.1

Long-stay resident measures
Above average Connecticut avg: 3.4 Info CMS star rating based on long-stay quality measure performance. 5 stars = significantly above average, 1 star = significantly below average.
Need for Help with Daily Activities Increased Info Percent of long-stay residents whose need for help with daily activities has increased 18.8%
In line with Connecticut average

Connecticut average: 18.9%

Walking Ability Worsened Info Percent of long-stay residents whose ability to move independently worsened 24.1%
26% worse than Connecticut average

Connecticut average: 19.2%

Low Risk Residents with Bowel/Bladder Incontinence Info Percent of low risk long-stay residents who lose control of their bowels or bladder 31.5%
26% worse than Connecticut average

Connecticut average: 24.9%

Falls with Major Injury Info Percent of long-stay residents experiencing one or more falls with major injury 2.7%
23% better than Connecticut average

Connecticut average: 3.5%

High Risk Residents with Pressure Ulcers Info Percent of long-stay high risk residents with pressure ulcers 2.9%
37% better than Connecticut average

Connecticut average: 4.6%

Urinary Tract Infection Info Percent of long-stay residents with a urinary tract infection 2.7%
62% worse than Connecticut average

Connecticut average: 1.7%

Lost Too Much Weight Info Percent of long-stay residents who lose too much weight 2.6%
59% better than Connecticut average

Connecticut average: 6.3%

Depressive Symptoms Info Percent of long-stay residents who have depressive symptoms 0.0%
100% better than Connecticut average

Connecticut average: 15.2%

Antipsychotic Use Info Percent of long-stay residents who received an antipsychotic medication 15.0%
12% better than Connecticut average

Connecticut average: 17.2%

Pneumococcal Vaccine Info Percent of long-stay residents assessed and appropriately given the pneumococcal vaccine 100.0%
14% better than Connecticut average

Connecticut average: 87.5%

Influenza Vaccine Info Percent of long-stay residents assessed and appropriately given the seasonal influenza vaccine 100.0%
7% better than Connecticut average

Connecticut average: 93.5%

Hospitalizations per 1,000 days Info Number of hospitalizations per 1,000 long-stay resident days. 1.42
32% better than Connecticut average

Connecticut average: 2.10

ED visits per 1,000 days Info Number of outpatient emergency department visits per 1,000 long-stay resident days. 0.92
40% better than Connecticut average

Connecticut average: 1.53

Short-stay resident measures
Significantly above average Connecticut avg: 3.4 Info CMS star rating based on short-stay quality measure performance. 5 stars = much above average, 1 star = much below average.
Pneumococcal Vaccine Info Percent of short-stay residents assessed and appropriately given the pneumococcal vaccine 89.4%
28% better than Connecticut average

Connecticut average: 70.1%

Antipsychotic medication increase Info Percent of short-stay residents who newly received an antipsychotic medication 0.0%
100% better than Connecticut average

Connecticut average: 1.5%

Influenza Vaccine Info Percent of short-stay residents assessed and appropriately given the seasonal influenza vaccine 96.6%
38% better than Connecticut average

Connecticut average: 69.8%

Re-hospitalized after SNF stay Info Percentage of short-stay residents who were re-hospitalized after their nursing home admission. 11.9%
52% better than Connecticut average

Connecticut average: 25.0%

Emergency department visits Info Percentage of short-stay residents who had an outpatient emergency department visit. 15.7%
41% worse than Connecticut average

Connecticut average: 11.1%

Falls with major injury Info Percentage of SNF residents who experience falls with major injury during their stay. 0.0%
100% better than Connecticut average

Connecticut average: 0.8%

Ability to care for self at discharge Info Percentage of residents at or above expected ability to care for themselves at discharge. 52.8%
In line with Connecticut average

Connecticut average: 53.7%

Successful return to home or community Info Rate of successful return to home or community from a skilled nursing facility. 62.9%
24% better than Connecticut average

Connecticut average: 50.6%

Breakdown by payment type

Medicare

52% of new residents, usually for short-term rehab.

Typical stay 22 days

Private pay

48% of new residents, often for short stays.

Typical stay 4 - 5 months

Facility Characteristics

Source: CMS Long-Term Care Facility Characteristics (Data as of Jan 2026)

Total residents 39
Medicare
11
28.2% of residents
Private pay or other
28
71.8% of residents
Programs & Services
Residents Group

Residents meet regularly to discuss policies, care quality, and activities

CCRC

Part of a Continuing Care Retirement Community offering multiple care levels

Active Resident Council

Organized group of residents that meets regularly to discuss facility policies, quality of life, and activities.

Finances and operations

Based on CMS SNF Cost Report for fiscal year ending in 12/2023.

Privately-owned community
Operated by a single business entity.
Net patient revenue Info Net patient revenue — what the home actually collects for resident care, after contractual allowances, bad debt and discounts are subtracted from its gross charges (CMS cost report, Worksheet G-3). It covers resident care only; money the home earns from other sources is shown separately as "Other income."
$8.6M
Net patient income Info Net patient income: net patient revenue minus the home's total operating expenses. A positive figure means it earns more from resident care than it spends to deliver it; a negative figure means the opposite. It excludes non-operating "other income."
-$26.2M
Privately-owned community Operated by a single business entity.
Net patient revenue Info Net patient revenue — what the home actually collects for resident care, after contractual allowances, bad debt and discounts are subtracted from its gross charges (CMS cost report, Worksheet G-3). It covers resident care only; money the home earns from other sources is shown separately as "Other income."
$8.6M Rank #22 / 73Revenue — State benchmarkedThis home is ranked 22nd out of 73 homes in Connecticut. Shows this facility's annual revenue compared to the Connecticut average. Higher revenue generally means more resources for staffing and capital — read alongside Payroll %.Rankings are based only on facilities in Connecticut that report data for that category. Facilities without available data are excluded from the ranking.Click the rank badge to see the full State ranking.Click here to see the full State ranking.
Net patient income Info Net patient income: net patient revenue minus the home's total operating expenses. A positive figure means it earns more from resident care than it spends to deliver it; a negative figure means the opposite. It excludes non-operating "other income."
-$26.2M
Other income Info Money the home earns outside of resident care — such as investments, grants, rentals and other non-operating sources (CMS cost report, Worksheet G-3). It is tracked separately from net patient revenue: it is not part of that figure, and it is not included in net patient income.
$19.2M
Payroll costs Info Staff salaries plus wage-related costs — benefits such as payroll taxes, health insurance and retirement — from the home's own accounting records (CMS cost report, Worksheet A). Contract or agency labor is counted separately, under other operating costs. Rank #25 / 73Payroll — State benchmarkedThis home is ranked 25th out of 73 homes in Connecticut. Shows total annual staff payroll benchmarked to the Connecticut average. Higher payroll investment relative to peers often signals better staffing and less reliance on cheaper contract labor.Rankings are based only on facilities in Connecticut that report data for that category. Facilities without available data are excluded from the ranking.Click the rank badge to see the full State ranking.Click here to see the full State ranking.
$11.2M 131.4% of net patient revenue Info Payroll as a share of revenue: staff salaries and wage-related benefits divided by net patient revenue. A higher figure means more of each revenue dollar goes to staff pay. Rank #56 / 73Payroll % — State benchmarkedThis home is ranked 56th out of 73 homes in Connecticut. Shows payroll as a percentage of revenue versus the Connecticut average. Well-run Connecticut facilities typically land around 51–66% — the top third Statewide. Below 25% may signal understaffing or heavy agency use — read with Staffing ratings.Rankings are based only on facilities in Connecticut that report data for that category. Facilities without available data are excluded from the ranking.Click the rank badge to see the full State ranking.Click here to see the full State ranking.
Other operating costs Info Everything it costs to run the home apart from payroll — food, utilities, supplies, maintenance, contract labor and administration. Calculated as total operating expense minus payroll (staff salaries and wage-related benefits).
$23.5M
Total costs Info The home's total operating expense for the year — all the costs of running it, salaries included (CMS cost report, Worksheet G-3).
$34.7M

What does this home offer?

Pets allowed icon
Pets allowed icon

Pets Allowed

Housing options icon

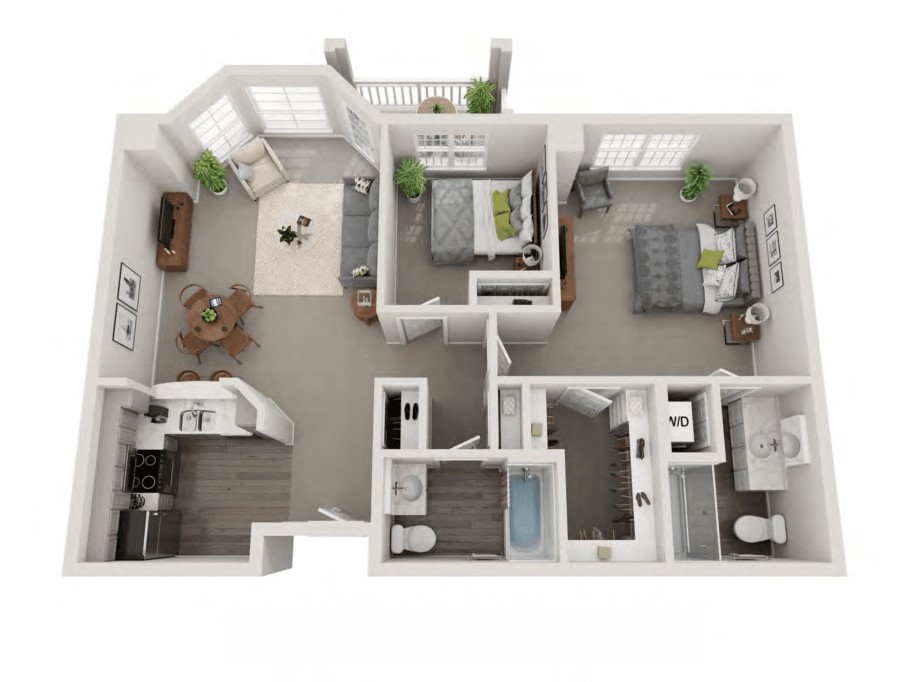
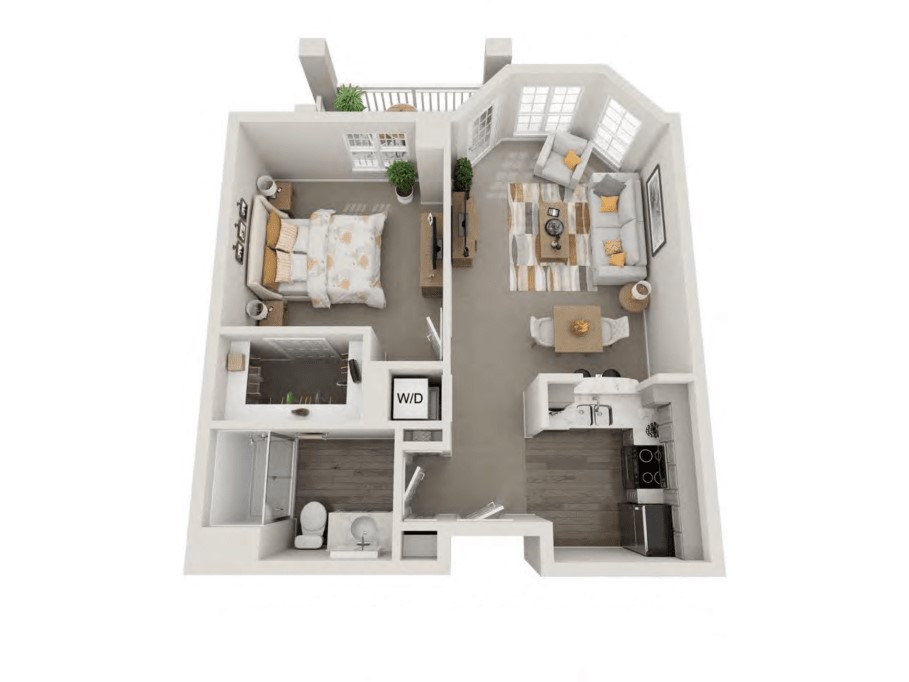
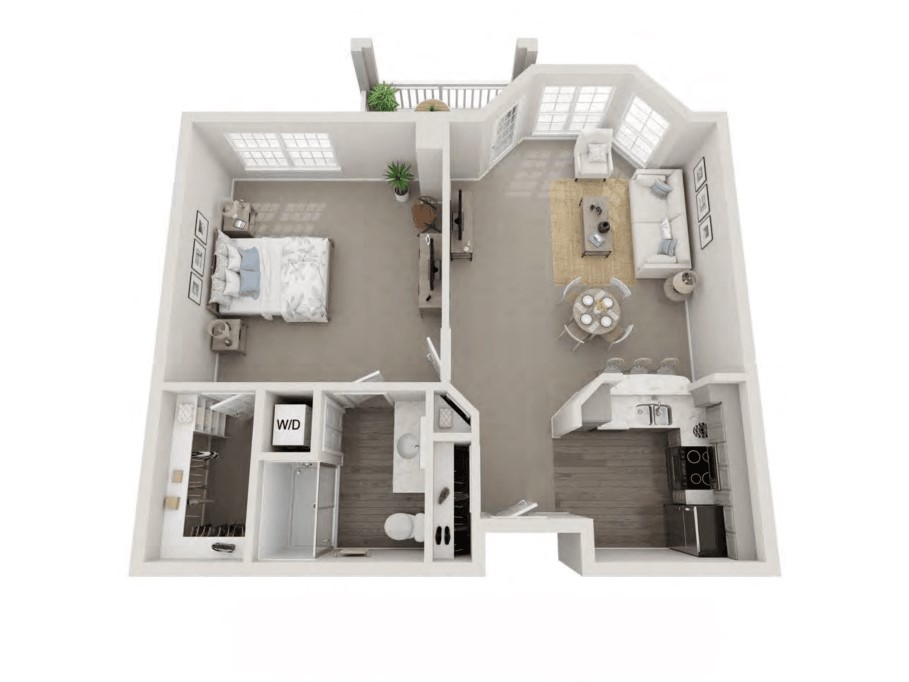
Housing Options: Studio / 1 Bed / 2 Bed

Building type icon
Building type icon

Building Type: Mid-rise

Transportation services icon

Transportation Services

Fitness and recreation icon

Fitness and Recreation

Who this home usually serves

TYPE OF STAY

Mostly short-term rehab stays

Most residents typically stay for a few weeks or months before returning home or moving on.

Most new residents arrive under Medicare (52% of admissions), and a typical Medicare stay runs around 22 days.

Admissions
205 total

Coverage residents most often arrive under.

Medicare 52%
Private pay 48%
Discharges
220 total

Coverage residents most often leave under.

Medicare 39%
Private pay 61%

Living Spaces & Floor Plans for StoneRidge Senior Living

Stoneridge Senior Living6
Stoneridge Senior Living9
Stoneridge Senior Living8
Stoneridge Senior Living7

Places of interest near StoneRidge Senior Living

Address 2.2 miles from city center Info Estimated distance in miles from Mystic's city center to StoneRidge Senior Living's address, calculated via Google Maps.

Calculate Travel Distance to StoneRidge Senior Living

Add your location

Address

Compare Nursing Homes around Connecticut

The information below is reported by the Connecticut Department of Public Health, Facility Licensing and Investigations Section.

5 facilities compared · CMS & CT Dept. of Health data

StoneRidge Senior Living
NH
AL
IL
MC
Mystic
40
Facility 40
CT AVG 111
Rank #105 / 123
70.4%
Facility 70.4%
CT AVG 84%
Rank #64 / 72
-16%
5.68
Facility 5.68
CT AVG 3.97
Rank #3 / 67
+138%+43%
$8.0k
Facility $8.0k
CT AVG $43.8k
Rank #37 / 69
5
Facility 5
CT AVG 32.0
Rank #2 / 69
1.7
Facility 1.7
CT AVG 5.8
Rank #2 / 69
135-
24
Facility 24
CT AVG 47
Rank #199 / 264
Mystic Ct Senior Holdings, LLC
$8.6M
Facility $8.6M
CT AVG $19.0M
Rank #22 / 73
$11.2M
Facility $11.2M
CT AVG $7.2M
Rank #25 / 73
131.4%
Facility 131.4%
CT AVG 42.4%
Rank #56 / 73
75437
Edgehill
NH
AL
IL
MC
Stamford (West Side)
46
Facility 46
CT AVG 111
Rank #102 / 123
77.3%
Facility 77.3%
CT AVG 84%
Rank #61 / 72
-8%
4.86
Facility 4.86
CT AVG 3.97
Rank #13 / 67
+75%+22%
$0
Facility $0
CT AVG $43.8k
Rank #1 / 69
2
Facility 2
CT AVG 32.0
Rank #1 / 69
1.0
Facility 1.0
CT AVG 5.8
Rank #1 / 69
-41C
25
Facility 25
CT AVG 47
Rank #197 / 264
B-Ix Edgehill LLC
$42.8M
Facility $42.8M
CT AVG $19.0M
Rank #6 / 73
$14.9M
Facility $14.9M
CT AVG $7.2M
Rank #12 / 73
34.8%
Facility 34.8%
CT AVG 42.4%
Rank #69 / 73
75421
Regency House Of Wallingford I
NH
HC
MC
PC
RC
Wallingford (Wallingford Center)
130
Facility 130
CT AVG 111
Rank #39 / 123
93.8%
Facility 93.8%
CT AVG 84%
Rank #18 / 72
+12%
3.47
Facility 3.47
CT AVG 3.97
Rank #49 / 67
-1%-13%
$0
Facility $0
CT AVG $43.8k
Rank #1 / 69
13
Facility 13
CT AVG 32.0
Rank #7 / 69
4.3
Facility 4.3
CT AVG 5.8
Rank #17 / 69
-125-
39
Facility 39
CT AVG 47
Rank #161 / 264
Barry Bokow 2012 Family Trust
$19.4M
Facility $19.4M
CT AVG $19.0M
Rank #23 / 73
$10.3M
Facility $10.3M
CT AVG $7.2M
Rank #26 / 73
53%
Facility 53%
CT AVG 42.4%
Rank #57 / 73
75261
River Glen Health Care Center
NH
Southbury (South Britain Road)
120
Facility 120
CT AVG 111
Rank #46 / 123
89.2%
Facility 89.2%
CT AVG 84%
Rank #36 / 72
+6%
3.60
Facility 3.60
CT AVG 3.97
Rank #44 / 67
-41%-9%
$0
Facility $0
CT AVG $43.8k
Rank #1 / 69
19
Facility 19
CT AVG 32.0
Rank #17 / 69
6.3
Facility 6.3
CT AVG 5.8
Rank #47 / 69
1108-
35
Facility 35
CT AVG 47
Rank #175 / 264
Thci Company, LLC
$17.9M
Facility $17.9M
CT AVG $19.0M
Rank #24 / 73
$11.2M
Facility $11.2M
CT AVG $7.2M
Rank #38 / 73
62.8%
Facility 62.8%
CT AVG 42.4%
Rank #65 / 73
75241
Lutheran Home Of Southbury Inc
NH
AL
PC
RC
Southbury
120
Facility 120
CT AVG 111
Rank #46 / 123
99.2%
Facility 99.2%
CT AVG 84%
Rank #2 / 72
+18%
4.81
Facility 4.81
CT AVG 3.97
Rank #14 / 67
+23%+21%
$0
Facility $0
CT AVG $43.8k
Rank #1 / 69
20
Facility 20
CT AVG 32.0
Rank #18 / 69
5.0
Facility 5.0
CT AVG 5.8
Rank #28 / 69
-115-
3
Facility 3
CT AVG 47
Rank #260 / 264
Ascentria Care Alliance Inc
$16.8M
Facility $16.8M
CT AVG $19.0M
Rank #38 / 73
$10.8M
Facility $10.8M
CT AVG $7.2M
Rank #37 / 73
64.3%
Facility 64.3%
CT AVG 42.4%
Rank #31 / 73
75371

Financial Assistance for
Nursing Home in Connecticut

StoneRidge Senior Living is located in Mystic, Connecticut.
Here are the financial assistance programs available to residents in Connecticut.

Get Financial aid guidance

Connecticut Home Care Program for Elders

CHCPE

Age 65+
General Connecticut resident, at risk of nursing home placement.
Income Limits State-funded: ~$1,600/month; Medicaid: ~$2,829/month 300% FBR
Asset Limits $1,600 (state), $2,000 (Medicaid, individual).
CT

Two tiers (state and Medicaid); waitlists possible.

Benefits
In-home care (4-6 hours/day) Adult day care (~$70/day) Meals Respite (up to 14 days/year)

Statewide Respite Care Program

CT Respite Care

Age
General Caregiver of senior with dementia, Connecticut resident.
Income Limits ~$2,500/month individual, varies
Asset Limits $40,000 individual
CT

Limited to dementia caregivers; capped funding.

Benefits
In-home respite (up to 30 days/year) Adult day care (~$70/day)

Congregate Housing Services Program (CHSP)

Connecticut Congregate Housing Services Program

Age 62+
General Connecticut resident, frail but not needing 24/7 care, resides in CHSP-eligible housing.
Income Limits (2025) ~$41,000/year individual, adjusted annually
Asset Limits Not specified; focus is income-based.
CT

Limited to 14 state-subsidized sites; participants pay 10% of service costs.

Benefits
Personal care (3-5 hours/day) Meals ($5-$7/meal) Housekeeping Transportation (~5 trips/month)

Medicare Savings Program (MSP)

Connecticut Medicare Savings Program

Age 65+ or disabled
General Connecticut resident, enrolled in Medicare Part A/B.
Income Limits (2025) ~$2,510/month (individual, QMB); ~$3,380/month (SLMB); ~$3,598/month (ALMB)—adjusted annually.
Asset Limits None since 2023 policy change.
CT

Three tiers (Qualified Medicare Beneficiary, Specified Low-Income, Additional Low-Income); no asset test.

Benefits
Covers Medicare Part B premiums ($174.70/month) Deductibles ($240/year) Copays (~20% of services)

Frequently Asked Questions about StoneRidge Senior Living

What neighborhood is StoneRidge Senior Living in?

StoneRidge Senior Living is in the Mystic neighborhood.

Is StoneRidge Senior Living in a walkable area?

StoneRidge Senior Living has a walk score of 24. Car-dependent. Most errands require a car, with limited nearby walkable options.

What is the occupancy rate at StoneRidge Senior Living?

StoneRidge Senior Living's occupancy is 70.4%.

Are there photos of StoneRidge Senior Living?

Yes — there are 6 photos of StoneRidge Senior Living in the photo gallery on this page.

What is the address of StoneRidge Senior Living?

StoneRidge Senior Living is located at 186 Jerry Browne Rd Building #1, Mystic, CT 06355.

What is the phone number of StoneRidge Senior Living?

(860) 572-5600 will put you in contact with the team at StoneRidge Senior Living.

Is StoneRidge Senior Living Medicare or Medicaid certified?

Yes — StoneRidge Senior Living is a CMS-certified provider of Medicare and Medicaid.

Guides for Better Senior Living

Care Cost Calculator: See Prices in Your Area

Nursing Home Data Explorer

Don’t Wait Too Long: 7 Red Flag Signs Your Parent Needs Assisted Living Now

The True Cost of Assisted Living in 2025 – And How Families Are Paying For It

Understanding Senior Living Costs: Pricing Models, Discounts & Financial Assistance