Explore Open Rooms

1 Contact details
2 What type of senior care service are you looking for?
3 What budget do you have in mind for senior care?
4 How soon do you need to find care?
5 Additional details

Thank you for your interest!

Our team will be in touch shortly to help with next steps.

Memory Care Home

Sun Valley Rehabilitation and Healthcare Center

Memory Care Home

Sun Valley Rehabilitation and Healthcare Center

2902 S 77 Sunshine Strip, Harlingen, TX 78550 View map
Overview of Sun Valley Rehabilitation and Healthcare Center

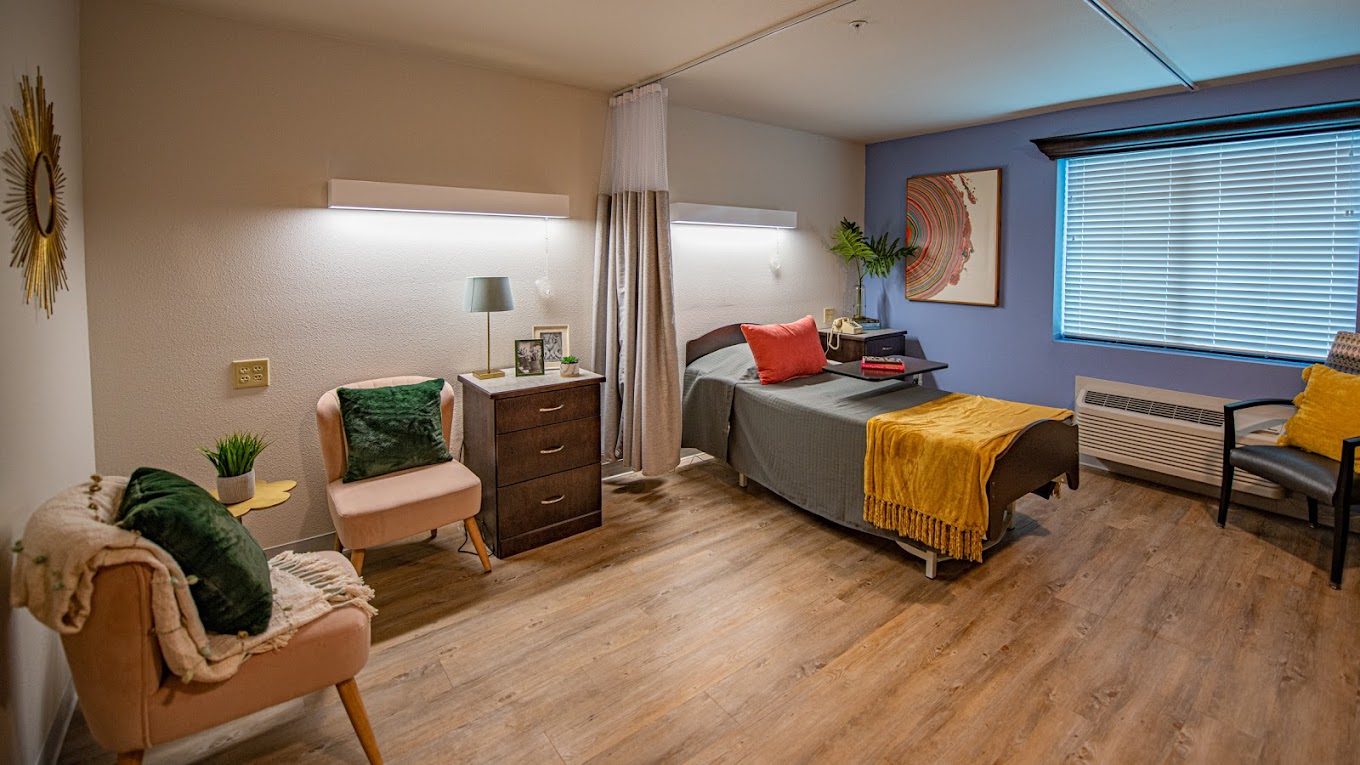
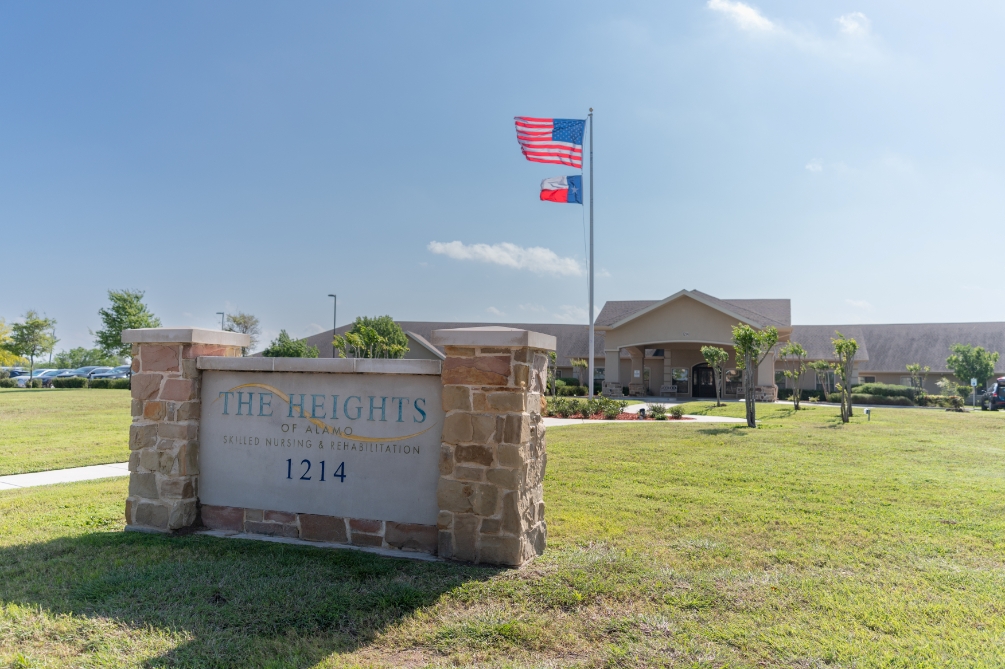
Situated in the welcoming neighborhood of Harlingen, TX, Sun Valley Rehabilitation and Healthcare Center is a dedicated community providing skilled nursing, memory care, long-term care, respiratory, and rehabilitation services. Large and cozy accommodations such as suites are available for its residents. With an expert and empathetic team, the community offers individualized treatment plans and daily specialized activities to help stimulate brain therapy for those with cognitive conditions like Alzheimer’s disease and dementia.

Experience its top-quality amenities and services wherein residents can enjoy delightful chef-prepared meals based on dietary needs, medication management, wound care and management, and a beauty and barber shop. Explore its beautiful spaces such as the courtyard and gazebo. Have fun with interactive daily activities and create meaningful memories with new friends. With Sun Valley Rehabilitation and Healthcare Center, seniors can enjoy the utmost care and support.

(956) 428-2800

Quality ratings

Measured by Centers for Medicare & Medicaid Services (CMS)

Overall rating Info The Overall CMS Rating combines results from health inspections, staffing levels and quality measures. Health inspections carry the most weight. Staffing and quality scores can increase or decrease the final rating based on performance compared to state and national standards.
5/5
Texas average: 3.0/5
Health Inspection Info Based on the results of the facility's three most recent standard inspections and any complaint investigations. CMS reviews the number, scope, and severity of deficiencies, with more recent findings weighted more heavily.
5/5
Texas average: 2.9/5
Staffing Info Measures average nursing staff hours per resident per day, including Registered Nurses (RNs) and total nursing staff. Ratings are adjusted based on the level of care residents require and are compared to state and national benchmarks.
2/5
Texas average: 2.4/5
Quality Measures Info Based on clinical and physical health indicators reported to CMS, such as hospital readmissions, falls, pressure ulcers, and improvements in mobility. These measures reflect how well residents' health needs are being managed.
5/5
Texas average: 4.0/5

Nursing care per resident

Info This shows how many total hours of nursing staff time are available per resident each day. Higher numbers usually mean more staff support.
3h 47m per day

This home provides 0% more nursing time per resident than the Texas average.

Texas average: 3h 46m per day

Staffing hours breakdown

Info Hours of care per resident per day, broken down by staff type. Data from CMS Medicare.
Staff type Facility State avg National avg
Registered Nurse (RN) Info Registered nurse hours per resident per day. 15m per day 26m per day 41m per day
Nurse Aide Info Nurse aide hours per resident per day. 2h 22m per day 2h 1m per day 2h 21m per day
Total Nursing (Weekend) Info Total number of nurse staff hours per resident per day on weekends. 2h 55m per day 2h 59m per day 3h 26m per day
Physical Therapist Info Physical therapist staff hours per resident per day. 4m per day 4m per day 4m per day
RN (Weekend) Info Registered nurse hours per resident per day on weekends. 8m per day 21m per day 29m per day

Capacity and availability

Medium-capacity home

Offers a balance of services and community atmosphere.

Total beds 124

This home usually has availability

Lower occupancy suggests more openings may be available.

Lower demand than the Texas average
Occupancy rate 76.4%
Residents per day (avg) 96
Occupancy rate
76.4%
Residents per day (avg)
96

Who this home usually serves

TYPE OF STAY

Mix of rehab and long-term care

This home supports both short-term rehab and long-term care, with residents staying for a wide range of durations.

Breakdown by payment type

Medicare

46% of new residents, usually for short-term rehab.

Typical stay 1 - 2 months

Private pay

51% of new residents, often for short stays.

Typical stay 2 - 3 months

Medicaid

3% of new residents, often for long-term daily care.

Typical stay 8 years

Finances and operations

Governmental community
Operated by state authorities.
Home revenue
$10.2M
Surplus of revenue
$423.2K
Governmental community Operated by state authorities.
Home revenue
$10,195,796.00
Surplus of revenue
$423,213.00
Payroll costs Info The portion of the home's budget spent on staff, including nurses, caregivers, and other employees who support care and operations.
$4.5M
43.8% of revenue
Other operating costs Info All remaining costs needed to run the home, such as food, utilities, building maintenance, supplies and administrative expenses.
$5.3M
Total costs $9.8M
Bed community size
124-bed community
A larger shared setting that may offer more common spaces and organized community services.
Years in operation
5 years in operation
An established community with some operational experience and growing routines.
Walk Score
Walk Score: 37 / 100
Somewhat walkable. A few nearby services may be reachable on foot, but most trips require transportation.

Services

Medicare/medicaid

About this community

License details

Facility type
Nursing
Status Active
Issuance January 5, 2025
Expiration January 5, 2028
County: CAMERON

Additional licensing details

License number: 308632
Year opened: 10/22/2020

Ownership & operating entity

Sun Valley Rehabilitation and Healthcare Center is administrated by JOHN CARMONA.

Management company: AV REHAB, LLC
Owner: WEST WHARTON COUNTY HOSPITAL DISTRICT
Ownership type: HOSPITAL DISTRICT/AUTHORITY

Type Of Units

Medicare
4 units
Medicaid and Medicare
120 units
Total beds
124 units

Staffing

Key information about the people who lead and staff this community.

Leadership

Administrator email: [email protected]

What does this home offer?

Accepts Medicaid icon

Accept Medicaid: Yes

Total residents icon

Total Residents: 124

Housing options icon

Housing Options: Suite

Building type icon
Building type icon

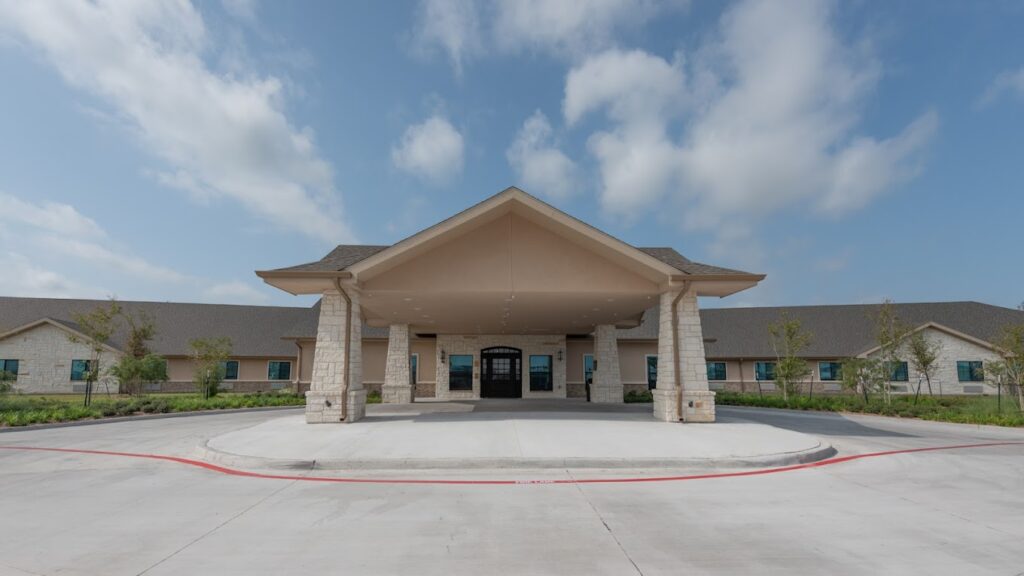
Building Type: Single-story

Fitness and recreation icon

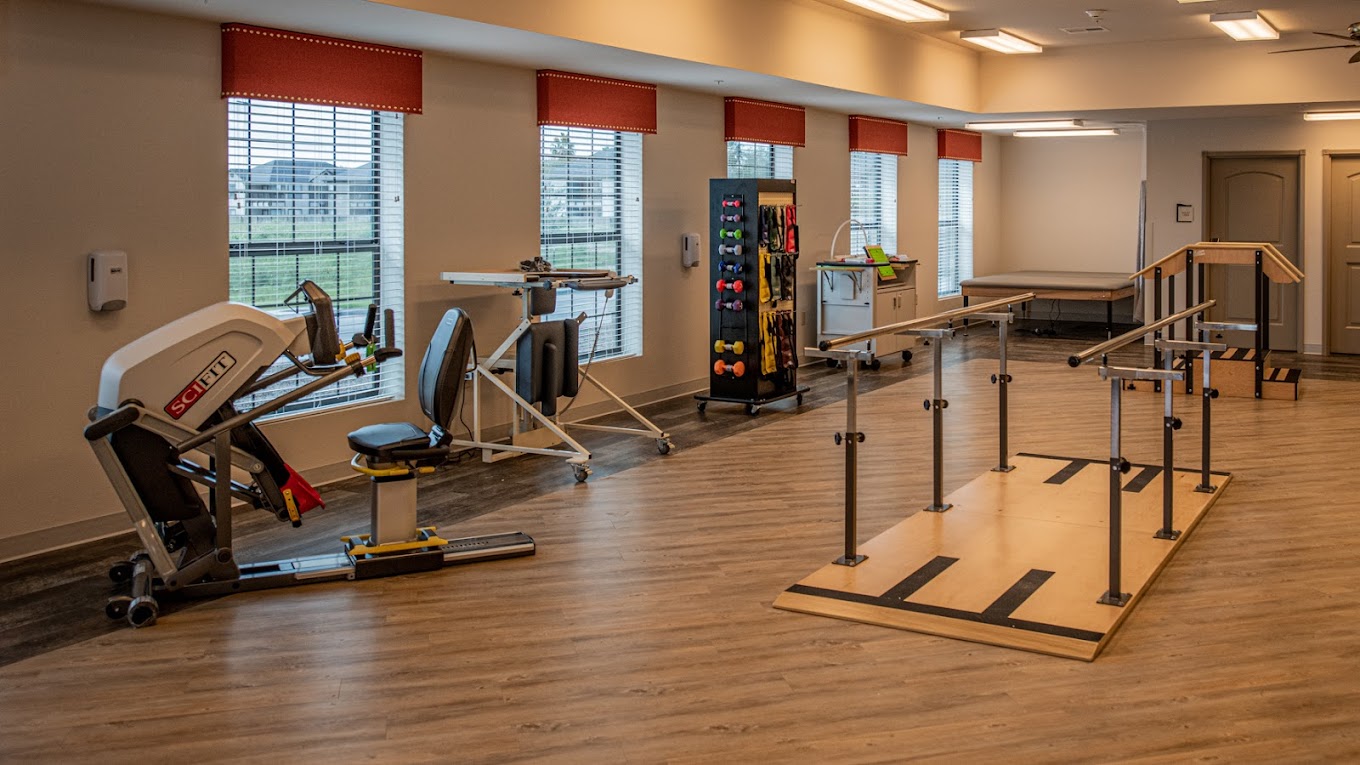
Fitness and Recreation

Types of Care at Sun Valley Rehabilitation and Healthcare Center

Memory Care
Contact Sun Valley Rehabilitation and Healthcare Center

Inspection History

In Texas, the Health and Human Services Commission (HHSC) is the primary regulatory body that conducts unannounced inspections and publishes quality reports for all long-term care homes.

3 visits/inspections

1 routine inspections

Results

2 with issues

1 without issues

Latest inspection

Date:July 9, 2025
Type:Routine

6 deficiencies

Deficiencies indicate regulatory issues. A higher number implies the facility had several areas requiring improvement.

Health Inspection History

Inspections
Total health inspections 2

Texas average 7.4


Last Health inspection on Jul 2025

Total health citations 5

Texas average 25.9

Citations per inspection
2.5

Texas average 3.67


Health citations are formal notices following inspections when they fail to comply with safety and care standards.

All 5 citations resulted from standard inspections.

Breakdown of citation severity (last 3 years)
Critical Health citations More info 0
100% better than Texas average

Texas average: 2


Serious Health citations More info 0
100% better than Texas average

Texas average: 0.4

0 critical citations More info Texas average: 2

0 serious citations More info Texas average: 0.4

5 moderate citations More info Texas average: 23

0 minor citations More info Texas average: 0.4
Citations history (last 3 years)
Infection Control moderate citation Info Issues related to preventing and controlling infections, including hygiene practices and safety protocols. Jul 09, 2025
Corrected

Pharmacy moderate citation Info Issues related to medication management, including how drugs are stored, administered, and monitored. Jul 09, 2025
Corrected

Care Planning moderate citation Info Issues related to creating and updating personalized care plans for residents based on their needs and conditions. Jul 09, 2025
Corrected

Care Planning moderate citation Info Issues related to creating and updating personalized care plans for residents based on their needs and conditions. Jul 09, 2025
Corrected

Compare Memory Care around Cameron County The information below is reported by the Texas Health and Human Services Commission.

The Heights of Alamo
NH

Nursing Home Licensed facility providing 24/7 skilled nursing care for residents with complex, ongoing medical needs. Staffed by RNs, LPNs, and CNAs. Inspected and star-rated annually by CMS. Accepts Medicare (short-term rehab) and Medicaid (long-term care).

MC

Memory Care Secured, specialized care for people living with Alzheimer's or dementia. Staff trained in cognitive impairment, with higher staff-to-resident ratios and an environment designed to reduce confusion and wandering risk.

Alamo
130
-
19
7
-
-
-
-
Suite
Sun Valley Rehabilitation and Healthcare Center
NH

Nursing Home Licensed facility providing 24/7 skilled nursing care for residents with complex, ongoing medical needs. Staffed by RNs, LPNs, and CNAs. Inspected and star-rated annually by CMS. Accepts Medicare (short-term rehab) and Medicaid (long-term care).

MC

Memory Care Secured, specialized care for people living with Alzheimer's or dementia. Staff trained in cognitive impairment, with higher staff-to-resident ratios and an environment designed to reduce confusion and wandering risk.

Harlingen
124
-
37
5
-
-
-
-
Suite
Harlingen Nursing and Rehabilitation Center
NH

Nursing Home Licensed facility providing 24/7 skilled nursing care for residents with complex, ongoing medical needs. Staffed by RNs, LPNs, and CNAs. Inspected and star-rated annually by CMS. Accepts Medicare (short-term rehab) and Medicaid (long-term care).

MC

Memory Care Secured, specialized care for people living with Alzheimer's or dementia. Staff trained in cognitive impairment, with higher staff-to-resident ratios and an environment designed to reduce confusion and wandering risk.

Harlingen
120
-
49
29
-
-
-
-
Suite
Windsor Atrium
NH

Nursing Home Licensed facility providing 24/7 skilled nursing care for residents with complex, ongoing medical needs. Staffed by RNs, LPNs, and CNAs. Inspected and star-rated annually by CMS. Accepts Medicare (short-term rehab) and Medicaid (long-term care).

MC

Memory Care Secured, specialized care for people living with Alzheimer's or dementia. Staff trained in cognitive impairment, with higher staff-to-resident ratios and an environment designed to reduce confusion and wandering risk.

Harlingen
120
-
14
50
-
-
-
-
Suite

Places of interest near Sun Valley Rehabilitation and Healthcare Center

Address 2.9 miles from city center

Address 2902 S 77 Sunshine Strip, Harlingen, TX 78550

Calculate Travel Distance to Sun Valley Rehabilitation and Healthcare Center

Add your location

Address

Staffing Data (Q2 2025)

This data corresponds to Q2 2025 and is based on CMS Payroll-Based Journal.

Total staff 121
Employees 118
Contractors 3
Staff to resident ratio 1.30:1
14% worse than Texas average

Texas average ratio: 1.51:1

Avg staff/day 54
Average shift 7.4 hours
9% worse than Texas average

Texas average: 8.1 hours

Total staff hours (quarter) 36,380
Nursing staff breakdown
Registered Nurse

Manages medical care and health needs.

Total count 4
Average shift length Info Average shift length. Calculated as total hours divided by days worked and average staff per day. 8.5 hours

No contractors work on this role.

Licensed Practical Nurse

Assists with medical care and medications.

Total count 27
Average shift length Info Average shift length. Calculated as total hours divided by days worked and average staff per day. 9.2 hours

No contractors work on this role.

Certified Nursing Assistant

Helps with daily care and mobility.

Total count 54
Average shift length Info Average shift length. Calculated as total hours divided by days worked and average staff per day. 7.3 hours

No contractors work on this role.

Contractor staffing

Total hours from contractors

0.9%

312 contractor hours this quarter

Medical Director: 1 Occupational Therapy Aide: 1 Diagnostic X-ray Services Staff: 1
Staff by category
Certified Nursing Assistant5405418,13891100%7.3
Licensed Practical Nurse270278,07591100%9.2
Medication Aide/Technician9093,31591100%7.5
Physical Therapy Aide3039417178%6.6
Registered Nurse4048578492%8.5
Qualified Social Worker3037306774%6.2
Respiratory Therapy Technician3037127987%5.7
Speech Language Pathologist7076957582%5.2
Physical Therapy Assistant3036037987%4.8
RN Director of Nursing1015146268%8.3
Administrator2025046369%8
Mental Health Service Worker1015046369%8
Nurse Practitioner1014806066%8
Diagnostic X-ray Services Staff0111562629%6
Occupational Therapy Aide0111041314%8
Medical Director011522629%2
54 Certified Nursing Assistant
% of Days 100%
27 Licensed Practical Nurse
% of Days 100%
9 Medication Aide/Technician
% of Days 100%
3 Physical Therapy Aide
% of Days 78%
4 Registered Nurse
% of Days 92%
3 Qualified Social Worker
% of Days 74%
3 Respiratory Therapy Technician
% of Days 87%
7 Speech Language Pathologist
% of Days 82%
3 Physical Therapy Assistant
% of Days 87%
1 RN Director of Nursing
% of Days 68%
2 Administrator
% of Days 69%
1 Mental Health Service Worker
% of Days 69%
1 Nurse Practitioner
% of Days 66%
1 Diagnostic X-ray Services Staff
% of Days 29%
1 Occupational Therapy Aide
% of Days 14%
1 Medical Director
% of Days 29%

Facility Characteristics

Source: CMS Long-Term Care Facility Characteristics (Data as of Jan 2026)

Total census
93 residents
Residents by payment source
Medicare
7 residents (7.5%)
Medicaid
58 residents (62.4%)
Private pay or other
28 residents (30.1%)
Programs & Services
Residents' Group

Residents meet regularly to discuss policies, care quality, and activities

Nurse Aide Training

State-approved Nurse Aide Training and Competency Evaluation Program on-site

Active Resident Council

Organized group of residents that meets regularly to discuss facility policies, quality of life, and activities.

Quality of care over time

These measures show how residents usually do over time at this home, based on health outcomes and preventive care.

High-risk clinical events score Info A composite score based on pressure ulcers, falls with injury, weight loss, walking ability decline, and activities of daily living decline. 8.3
In line with Texas average

Texas average: 8.6

Functional decline score Info A composite score based on activities of daily living decline, walking ability decline, and incontinence. 16.2
In line with Texas average

Texas average: 16.0

Long-stay resident measures
Significantly above average Texas avg: 4.2 Info CMS star rating based on long-stay quality measure performance. 5 stars = significantly above average, 1 star = significantly below average.
Need for Help with Daily Activities Increased Info Percent of long-stay residents whose need for help with daily activities has increased 14.5%
11% better than Texas average

Texas average: 16.2%

Walking Ability Worsened Info Percent of long-stay residents whose ability to move independently worsened 18.6%
15% worse than Texas average

Texas average: 16.2%

Low Risk Residents with Bowel/Bladder Incontinence Info Percent of low risk long-stay residents who lose control of their bowels or bladder 15.5%
In line with Texas average

Texas average: 15.7%

Falls with Major Injury Info Percent of long-stay residents experiencing one or more falls with major injury 5.0%
55% worse than Texas average

Texas average: 3.2%

High Risk Residents with Pressure Ulcers Info Percent of long-stay high risk residents with pressure ulcers 0.9%
79% better than Texas average

Texas average: 4.4%

Urinary Tract Infection Info Percent of long-stay residents with a urinary tract infection 0.0%
100% better than Texas average

Texas average: 0.8%

Lost Too Much Weight Info Percent of long-stay residents who lose too much weight 2.4%
30% better than Texas average

Texas average: 3.5%

Depressive Symptoms Info Percent of long-stay residents who have depressive symptoms 3.4%
18% worse than Texas average

Texas average: 2.9%

Antipsychotic Use Info Percent of long-stay residents who received an antipsychotic medication 3.3%
58% better than Texas average

Texas average: 7.9%

Pneumococcal Vaccine Info Percent of long-stay residents assessed and appropriately given the pneumococcal vaccine 100.0%
In line with Texas average

Texas average: 97.3%

Influenza Vaccine Info Percent of long-stay residents assessed and appropriately given the seasonal influenza vaccine 100.0%
In line with Texas average

Texas average: 97.9%

Hospitalizations per 1,000 days Info Number of hospitalizations per 1,000 long-stay resident days. 2.73
28% worse than Texas average

Texas average: 2.13

ED visits per 1,000 days Info Number of outpatient emergency department visits per 1,000 long-stay resident days. 1.38
33% better than Texas average

Texas average: 2.07

Short-stay resident measures
Significantly above average Texas avg: 2.9 Info CMS star rating based on short-stay quality measure performance. 5 stars = much above average, 1 star = much below average.
Pneumococcal Vaccine Info Percent of short-stay residents assessed and appropriately given the pneumococcal vaccine 100.0%
11% better than Texas average

Texas average: 90.4%

Antipsychotic medication increase Info Percent of short-stay residents who newly received an antipsychotic medication 0.0%
100% better than Texas average

Texas average: 1.4%

Influenza Vaccine Info Percent of short-stay residents assessed and appropriately given the seasonal influenza vaccine 100.0%
14% better than Texas average

Texas average: 88.0%

Re-hospitalized after SNF stay Info Percentage of short-stay residents who were re-hospitalized after their nursing home admission. 27.6%
7% worse than Texas average

Texas average: 25.9%

Emergency department visits Info Percentage of short-stay residents who had an outpatient emergency department visit. 5.6%
53% better than Texas average

Texas average: 12.0%

Falls with major injury Info Percentage of SNF residents who experience falls with major injury during their stay. 0.0%
100% better than Texas average

Texas average: 0.8%

Ability to care for self at discharge Info Percentage of residents at or above expected ability to care for themselves at discharge. 61.5%
15% better than Texas average

Texas average: 53.7%

Successful return to home or community Info Rate of successful return to home or community from a skilled nursing facility. 58.7%
16% better than Texas average

Texas average: 50.6%

Guides for Better Senior Living

Care Cost Calculator: See Prices in Your Area

Nursing Home Data Explorer

Don’t Wait Too Long: 7 Red Flag Signs Your Parent Needs Assisted Living Now

The True Cost of Assisted Living in 2025 – And How Families Are Paying For It

Understanding Senior Living Costs: Pricing Models, Discounts & Financial Assistance

Financial Aid for Texas Seniors

Get financial aid guidance

Community Care for the Aged and Disabled (CCAD)

TX Medicaid CCAD

Age 65+ or disabled, Texas resident, Medicaid-eligible, care need (not always nursing home level).

~$2,829/month (300% FBR, individual).

$2,000 (individual), $3,000 (couple).

Large state; rural access challenges.

Texas Community Care Services

TX CCS

Age 60+, Texas resident, at risk of decline.

~$2,000/month (individual, varies).

$5,000 (individual).

Limited funding; high demand in urban areas.

Area Agency on Aging (AAA) Services

Texas AAA Services

Age 60+, TX resident; no income/asset limits.

None; donations encouraged.

Not assessed.

28 AAAs; includes Meals on Wheels in some areas.

Medicare Savings Program (MSP)

Texas Medicare Savings Program

Age 65+ or disabled, TX resident, Medicare Part A/B.

~$2,510/month (QMB), ~$3,380/month (SLMB), ~$3,598/month (QI)—individual.

$9,430 (individual), $14,130 (couple).

Includes Extra Help for Part D; no waitlist.

Low-Income Home Energy Assistance Program (LIHEAP)

Texas Comprehensive Energy Assistance Program (CEAP)

Age 60+ prioritized, TX resident, low-income.

~$3,970/month (185% FPL).

Not assessed.

Priority for elderly/disabled; covers gas, electric, propane.

Family Caregiver Support Program (FCSP)

Texas Family Caregiver Support Program

Caregivers of 60+ needing care or 55+ caregivers of others; TX resident; 2+ ADLs.

No strict cap; prioritizes low-income (~$24,980/year).

Not assessed.

High rural demand; includes grandparent caregivers.

Senior Community Service Employment Program (SCSEP)

Texas SCSEP

Age 55+, unemployed, low-income, TX resident.

~$1,983/month (125% FPL).

Not specified.

Priority for veterans, rural residents; AARP partnership.

VA Aid and Attendance (A&A) and Housebound Benefits

Texas VA Aid and Attendance/Housebound

Age 65+ or disabled veteran/spouse, TX resident, wartime service, ADL help (A&A) or homebound.

Net income < ~$1,984/month (veteran with dependent, A&A); pension offsets income.

~$155,356 (net worth).

High veteran population; supports rural/urban needs.

Property Tax Exemption for Seniors

Texas Senior Property Tax Exemption

Age 65+, TX resident, homeowner (homestead).

None; tax-based eligibility.

Not assessed.

$25,000+ exemption; optional freeze in some counties; saves ~$500-$1,000/year.

Senior Farmers’ Market Nutrition Program (SFMNP)

Texas SFMNP

Age 60+, TX resident, low-income.

~$2,322/month (185% FPL).

Not assessed.

Vouchers (~$50/season); serves ~20,000 via 28 AAAs.