Symphony Bronzeville
CMS overall rating Info CMS (the Centers for Medicare & Medicaid Services) is the federal agency that rates nursing home quality. Its Overall Rating runs from 1 to 5 stars, combining health inspections, staffing, and quality measures, with inspections weighted most heavily.

Symphony Bronzeville

CMS overall rating Info CMS (the Centers for Medicare & Medicaid Services) is the federal agency that rates nursing home quality. Its Overall Rating runs from 1 to 5 stars, combining health inspections, staffing, and quality measures, with inspections weighted most heavily.
Calculator: See prices in your area
Symphony Bronzeville accepts Medicare, Medicaid, and private pay.

Overview of Symphony Bronzeville

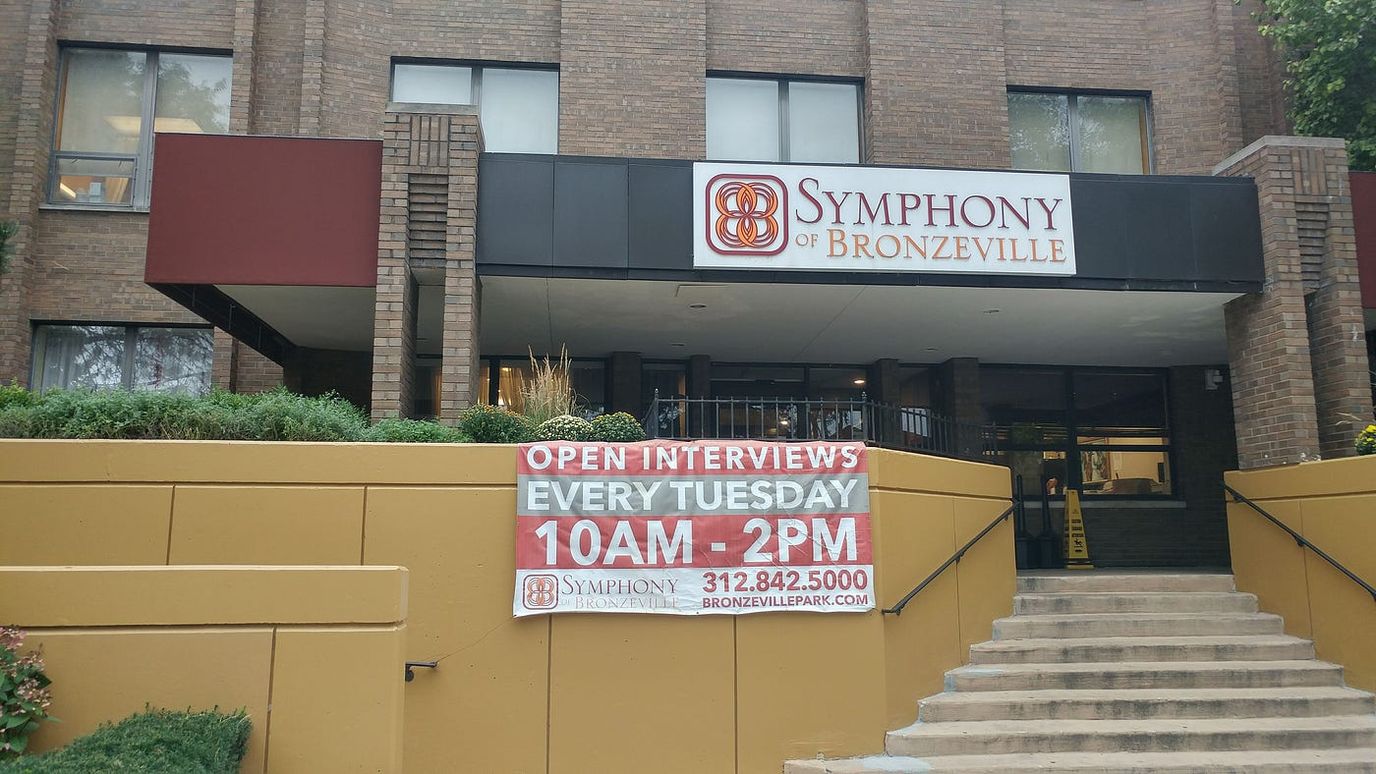
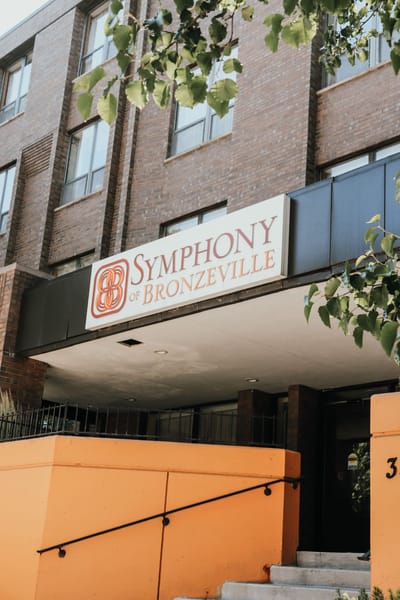
Symphony of Bronzeville, located in Chicago, IL, formerly known as Bronzeville Nursing and Rehab, is a large senior living community and nursing home providing post-acute care to its residents. This nursing home provides its residents 24 hour supervision, medication management, and round-the-clock nursing assistance. The residents are also provided assistance with daily living activities including bathing and toileting, as well as assistance with dining and transferring as needed.

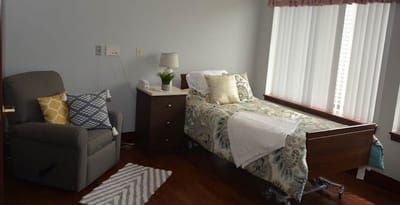
Symphony of Bronzeville’s amenities are specifically designed to enhance their residents’ life and provide a comfortable and relaxing stay. These amenities include meal provisions that are carefully prepared with consideration to the residents dietary needs, housekeeping services, and regularly scheduled activities, providing resident with engagement opportunities where their bodies and minds stay active.

(312) 842-5000

Quality ratings

Measured by Centers for Medicare & Medicaid Services (CMS)

Overall rating Info The Overall CMS Rating combines results from health inspections, staffing levels and quality measures. Health inspections carry the most weight. Staffing and quality scores can increase or decrease the final rating based on performance compared to state and national standards.
▼ 60.3% Below IL avg. ▼ 60.3% Below IL avg.IL average: 2.5Click the badge to see the full State ranking.Click here to see the full State ranking.
Health Inspection Info Based on the results of the facility's three most recent standard inspections and any complaint investigations. CMS reviews the number, scope, and severity of deficiencies, with more recent findings weighted more heavily.
▼ 64.0% Below IL avg. ▼ 64.0% Below IL avg.IL average: 2.8Click the badge to see the full State ranking.Click here to see the full State ranking.
Staffing Info Measures average nursing staff hours per resident per day, including Registered Nurses (RNs) and total nursing staff. Ratings are adjusted based on the level of care residents require and are compared to state and national benchmarks.
▼ 53.2% Below IL avg. ▼ 53.2% Below IL avg.IL average: 2.1Click the badge to see the full State ranking.Click here to see the full State ranking.
Quality Measures Info Based on clinical and physical health indicators reported to CMS, such as hospital readmissions, falls, pressure ulcers, and improvements in mobility. These measures reflect how well residents' health needs are being managed.
▼ 29.0% Below IL avg. ▼ 29.0% Below IL avg.IL average: 2.8Click the badge to see the full State ranking.Click here to see the full State ranking.

Staffing hours breakdown

Info Daily nursing hours per resident by staff type, reported to CMS. Higher is generally better — compare this facility to state and national averages to see where staffing stands.

Hours per resident per day — compared to Illinois state averages

Total nursing care / resident Info This home is ranked 163rd out of 172 homes in Illinois for nurse hours. Total adjusted nursing hours per resident per day, combining RN, LPN, and aide time. CMS adjusts this for case-mix so facilities can be fairly compared.
1h 51m per day
Rank #163 / 172Nurse hours — State benchmarkedThis home is ranked 163rd out of 172 homes in Illinois. Shows adjusted nurse hours per resident per day benchmarked to the Illinois average, with a ranking across 172 Illinois facilities. More hours mean more direct care. The national average is about 3.5 hrs; below 3.0 is a red flag.Ranking totals vary by category as each rank only includes facilities that report data for that metric. Homes missing that data point aren't included in the ranking.Click the rank badge to see the full State ranking.Click here to see the full State ranking.
This facility Illinois avg (3h 6m per day)
vs Illinois avg
-40%

6 of 6 metrics below state avg

Staff type Hours / Day / Resident vs state avg
Registered Nurse (RN) Info RNs hold the highest nursing license and can assess residents, interpret test results, and direct care plans. More RN hours per day often signals stronger clinical oversight and faster response to health changes. 23m per day ▼ 47% State avg: 44m per day · National avg: 41m per day
LPN / LVN Info Licensed Practical Nurses (LPNs) or Licensed Vocational Nurses (LVNs) deliver routine hands-on care — medication administration, wound dressing, and monitoring vital signs. They work under RN supervision and make up a large share of daily bedside care. 35m per day ▼ 7% State avg: 38m per day · National avg: 52m per day
Nurse Aide Info Certified Nurse Aides (CNAs) provide the most direct day-to-day assistance: bathing, dressing, feeding, and mobility. Nurse aide hours are typically the largest staffing category and directly affect residents' quality of life. 1h 32m per day ▼ 28% State avg: 2h 8m per day · National avg: 2h 21m per day
Weekend Total Nursing Info Combined nursing hours (RN + LPN + Nurse Aide) per resident per day on weekends. Staffing often drops on weekends — this figure reveals whether the facility maintains adequate coverage outside of weekday hours. 2h 25m per day ▼ 21% State avg: 3h 5m per day · National avg: 3h 26m per day
Physical Therapist Info Hours per resident per day provided by licensed Physical Therapists (PTs) or PT Assistants. PT services help residents recover mobility after injury or illness and are especially important for post-acute (short-stay) rehabilitation. 1m per day ▼ 67% State avg: 3m per day · National avg: 4m per day
Weekend RN Info Registered nurse hours specifically on weekends. Facilities sometimes reduce RN presence on Saturdays and Sundays — a low weekend RN figure compared to weekday hours can indicate reduced clinical oversight when most administrative staff are absent. 27m per day ▼ 21% State avg: 34m per day · National avg: 29m per day

Capacity and availability

Avg. Length of Stay
237 days
Bed community size
302-bed community Rank #2 / 426Bed count — State benchmarkedThis home is ranked 2nd out of 426 homes in Illinois. Shows this facility's certified or reported bed count compared to other Illinois facilities. Larger communities may offer more amenities, programs, and on-site services for residents and families.Ranking totals vary by category as each rank only includes facilities that report data for that metric. Homes missing that data point aren't included in the ranking.Click the rank badge to see the full State ranking.Click here to see the full State ranking.
A large-scale community that may provide a wide range of amenities, services, and structured programs.
Walk Score
Walk Score: 86 / 100 Rank #66 / 648Walk Score — State benchmarkedThis home is ranked 66th out of 648 homes in Illinois. Shows how walkable this facility's neighborhood is compared to the average Walk Score across Illinois facilities. Higher scores benefit residents, families, and staff.Ranking totals vary by category as each rank only includes facilities that report data for that metric. Homes missing that data point aren't included in the ranking.Click the rank badge to see the full State ranking.Click here to see the full State ranking.
Very walkable. Most errands can be accomplished on foot, and many essentials are within a short walk.
BBB Rating
BBB Rating: C+ (Not Accredited)
An independent rating from the Better Business Bureau based on factors such as complaint history, transparency, and business practices.
How BBB ratings work

About this community

License Details

CMS Certification Number145337

Contact Symphony Bronzeville

Inspection History

In Illinois, the Department of Public Health, Office of Health Care Regulation conducts annual unannounced surveys to assess compliance with state and federal healthcare facility standards.

Since 2022 · 4 years of data 93 deficiencies

Inspection Scorecard Info This scorecard compares key inspection, citation, and complaint metrics at this facility against the Illinois state average. Metrics rated ≥15% worse than average are highlighted in red; those ≥15% better are highlighted in green.

Since 2022 vs. Illinois state average
Overall vs. IL average 2 Worse Metrics worse than Illinois average:
• Total deficiencies (1229% above)
• Deficiencies per year (1194% above)
0 Better No metrics in this bucket.
Latest Inspection November 18, 2025 Other An inspection that falls outside standard annual surveys and formal complaint investigations. May include administrative compliance checks, documentation reviews, focused surveys on specific concerns, or revisit surveys to verify prior corrections.

Deficiencies Info Deficiencies are formal regulatory issues recorded during state inspections.

This Facility IL Average vs. IL Avg
Total deficiencies Info Formal regulatory issues recorded by inspectors across all inspection types. 93 7 This facility has 1229% more total deficiencies than a typical Illinois nursing home (93 vs. IL avg 7).↑ 1229% worse
Deficiencies per year Info Average deficiencies per year since 2022. 23.3 1.8 This facility has 1194% more deficiencies per year than a typical Illinois nursing home (23.3 vs. IL avg 1.8).↑ 1194% worse

Inspection Reports Summary Info An editor-reviewed summary of the themes and findings across this facility's recent inspection reports.

  • November 18, 2025 inspection found one deficiency for missing ceiling tiles in hallways and resident rooms affecting 36 residents, linked to leaks and ongoing repairs.
  • Multiple complaint investigations from 2023 to 2025 documented repeated failures to prevent resident-to-resident physical abuse causing actual harm and inadequate pressure ulcer care resulting in hospitalizations.
  • August 27, 2025 complaint investigation substantiated failures in blood glucose monitoring and pressure ulcer care for three residents, including one requiring surgical intervention.

Health Inspection History

Inspections since 2024
Total health inspections 32

Illinois average 10.4


Last Health inspection on Aug 2025

Total health citations
88 Rank #168 / 172Health citations — State benchmarkedThis home is ranked 168th out of 172 homes in Illinois. Shows this facility's total health deficiency citations benchmarked to the Illinois State average, with a ranking across all 172 IL facilities. Lower citation counts earn a better rank.Ranking totals vary by category as each rank only includes facilities that report data for that metric. Homes missing that data point aren't included in the ranking.Click the rank badge to see the full State ranking.Click here to see the full State ranking.

Illinois average 36.8

Citations per inspection
2.75 Rank #37 / 172Citations per inspection — State benchmarkedThis home is ranked 37th out of 172 homes in Illinois. Shows average deficiency citations per CMS inspection for this facility versus the Illinois mean across 172 facilities with citation data. Lower is better.Ranking totals vary by category as each rank only includes facilities that report data for that metric. Homes missing that data point aren't included in the ranking.Click the rank badge to see the full State ranking.Click here to see the full State ranking.

Illinois average 3.68


Health citations are formal notices following inspections when they fail to comply with safety and care standards.

32 of 88 citations resulted from standard inspections; and 56 of 88 resulted from complaint investigations.

Breakdown of citation severity (last 2 years)
Critical health citations
0
100% better than Illinois average

Illinois average: 0.7


Serious health citations
12
233% worse than Illinois average

Illinois average: 3.6

0 critical citations Illinois average: 0.7

12 serious citations Illinois average: 3.6

75 moderate citations Illinois average: 32

1 minor citation Illinois average: 0.5
Citations history (last 2 years)
Quality of Care serious citation Aug 27, 2025
Corrected

Care Planning moderate citation Aug 27, 2025
Corrected

Pharmacy moderate citation Aug 14, 2025
Corrected

Resident Rights moderate citation Aug 06, 2025
Corrected

Staffing Data

Reporting period: October 1 – December 31, 2025 (Q4 2025). Source: CMS Payroll-Based Journal report.

Total staff 262
Employees 229
Contractors 33
Staff to resident ratio 1.17 : 1
35% fewer staff per resident than Illinois average
Illinois average ratio: 1.80 : 1 Illinois average ratio: 1.80 : 1See full Illinois ranking
Avg staff/day 97
Average shift 7.3 hours
0% compared with Illinois average
Illinois average: 7.6 hours Illinois average shift: 7.6 hoursSee full Illinois ranking
Total staff hours (quarter) 65,106

Nursing staff breakdown

Q4 2025 · Oct 1 – Dec 31 More info This data comes from the CMS Payroll-Based Journal report covering October 1 – December 31, 2025.
Registered Nurse

Manages medical care and health needs.

RN Staff Info 32 total: 19 full-time employees and 13 contractors. 32
Average shift length Info Average shift length. Calculated as total hours divided by days worked and average staff per day. 9.4 hours
Licensed Practical Nurse

Assists with medical care and medications.

LPN Staff Info All 44 LPN Staff are full-time employees. No contractors work on this role. 44
Average shift length Info Average shift length. Calculated as total hours divided by days worked and average staff per day. 8 hours
Certified Nursing Assistant

Helps with daily care and mobility.

CNA Staff Info 154 total: 146 full-time employees and 8 contractors. 154
Average shift length Info Average shift length. Calculated as total hours divided by days worked and average staff per day. 6.7 hours

Contractor staffing

Q4 2025 · Oct 1 – Dec 31 More info This data comes from the CMS Payroll-Based Journal report covering October 1 – December 31, 2025.

Total hours from contractors

5.1%

3,301 contractor hours this quarter

Registered Nurse: 13 Certified Nursing Assistant: 8 Speech Language Pathologist: 4 Respiratory Therapy Technician: 3 Physical Therapy Aide: 3 Physical Therapy Assistant: 1 Qualified Social Worker: 1

Staff by category

Q4 2025 · Oct 1 – Dec 31 More info This data comes from the CMS Payroll-Based Journal report covering October 1 – December 31, 2025.
Certified Nursing Assistant 146 8 154 35,612 92 100% 6.7
Licensed Practical Nurse 44 0 44 12,308 92 100% 8
Registered Nurse 19 13 32 7,412 92 100% 9.4
Other Dietary Services Staff 7 0 7 2,260 92 100% 7.5
RN Director of Nursing 4 0 4 1,432 74 80% 7.9
Dental Services Staff 3 0 3 1,296 64 70% 8
Clinical Nurse Specialist 2 0 2 1,016 76 83% 8
Nurse Practitioner 2 0 2 656 68 74% 8
Physical Therapy Aide 0 3 3 546 66 72% 7.8
Administrator 1 0 1 512 64 70% 8
Dietitian 1 0 1 496 62 67% 8
Physical Therapy Assistant 0 1 1 461 62 67% 7.4
Speech Language Pathologist 0 4 4 417 58 63% 6.8
Respiratory Therapy Technician 0 3 3 390 54 59% 7.2
Qualified Social Worker 0 1 1 294 41 45% 7.2
154 Certified Nursing Assistant
% of Days 100%
44 Licensed Practical Nurse
% of Days 100%
32 Registered Nurse
% of Days 100%
7 Other Dietary Services Staff
% of Days 100%
4 RN Director of Nursing
% of Days 80%
3 Dental Services Staff
% of Days 70%
2 Clinical Nurse Specialist
% of Days 83%
2 Nurse Practitioner
% of Days 74%
3 Physical Therapy Aide
% of Days 72%
1 Administrator
% of Days 70%
1 Dietitian
% of Days 67%
1 Physical Therapy Assistant
% of Days 67%
4 Speech Language Pathologist
% of Days 63%
3 Respiratory Therapy Technician
% of Days 59%
1 Qualified Social Worker
% of Days 45%

Penalties and fines

Includes penalties issued in 2023-2025

Federal penalties imposed by CMS for regulatory violations, including civil money penalties (fines) and denials of payment for new Medicare/Medicaid admissions.

Source: CMS Penalties Database (Data as of Jan 2026)

Total fines amount $224K Rank #158 / 173Federal fines — State benchmarkedThis home is ranked 158th out of 173 homes in Illinois. Shows this facility's cumulative CMS federal fine dollars versus the Illinois average among facilities with fines, and where it ranks among 173 facilities in the pool. Lower total dollars mean a better rank.Ranking totals vary by category as each rank only includes facilities that report data for that metric. Homes missing that data point aren't included in the ranking.Click the rank badge to see the full State ranking.Click here to see the full State ranking.
57% higher than Illinois average

Illinois average: $143K

Number of fines 10
237% more fines than Illinois average

Illinois average: 3.0

Payment Denials Info Serious action where Medicare and/or Medicaid temporarily stops payments for new residents until issues are fixed. 3
183% more payment denials than Illinois average

Illinois average: 1.1

Fines amount comparison
This facility $224K
Illinois average $143K
Penalty History

Penalties are imposed by CMS for violations of federal nursing home regulations.

12 penalties in the past 3 years

Multiple penalties were reported in the last 3 years.

Payment Denial Info Serious action where Medicare and/or Medicaid temporarily stops payments for new residents until issues are fixed. Jun 18, 2025
14 days
Payment Denial Info Serious action where Medicare and/or Medicaid temporarily stops payments for new residents until issues are fixed. Mar 25, 2025
29 days
Civil Money Penalty Info Fines imposed for noncompliance, which can be assessed per day or per instance of violation. Feb 20, 2024
$5K
Civil Money Penalty Info Fines imposed for noncompliance, which can be assessed per day or per instance of violation. Feb 12, 2024
$5K

Last updated: Jan 2026

Quality of care over time

These measures show how residents usually do over time at this home, based on health outcomes and preventive care.

High-risk clinical events score Info A composite score based on pressure ulcers, falls with injury, weight loss, walking ability decline, and activities of daily living decline. 4.0
58% better than Illinois average

Illinois average: 9.7

Functional decline score Info A composite score based on activities of daily living decline, walking ability decline, and incontinence. 10.0
46% better than Illinois average

Illinois average: 18.6

Long-stay resident measures
Above average Illinois avg: 3.6 Info CMS star rating based on long-stay quality measure performance. 5 stars = significantly above average, 1 star = significantly below average.
Need for Help with Daily Activities Increased Info Percent of long-stay residents whose need for help with daily activities has increased 2.9%
81% better than Illinois average

Illinois average: 15.5%

Walking Ability Worsened Info Percent of long-stay residents whose ability to move independently worsened 5.0%
73% better than Illinois average

Illinois average: 18.4%

Low Risk Residents with Bowel/Bladder Incontinence Info Percent of low risk long-stay residents who lose control of their bowels or bladder 22.2%
In line with Illinois average

Illinois average: 21.6%

Falls with Major Injury Info Percent of long-stay residents experiencing one or more falls with major injury 1.2%
63% better than Illinois average

Illinois average: 3.4%

High Risk Residents with Pressure Ulcers Info Percent of long-stay high risk residents with pressure ulcers 6.5%
23% worse than Illinois average

Illinois average: 5.3%

Urinary Tract Infection Info Percent of long-stay residents with a urinary tract infection 0.0%
100% better than Illinois average

Illinois average: 1.8%

Lost Too Much Weight Info Percent of long-stay residents who lose too much weight 4.6%
30% better than Illinois average

Illinois average: 6.5%

Depressive Symptoms Info Percent of long-stay residents who have depressive symptoms 96.8%
101% worse than Illinois average

Illinois average: 48.1%

Antipsychotic Use Info Percent of long-stay residents who received an antipsychotic medication 13.8%
32% better than Illinois average

Illinois average: 20.2%

Pneumococcal Vaccine Info Percent of long-stay residents assessed and appropriately given the pneumococcal vaccine 91.1%
In line with Illinois average

Illinois average: 89.2%

Influenza Vaccine Info Percent of long-stay residents assessed and appropriately given the seasonal influenza vaccine 74.7%
18% worse than Illinois average

Illinois average: 91.6%

Hospitalizations per 1,000 days Info Number of hospitalizations per 1,000 long-stay resident days. 2.88
40% worse than Illinois average

Illinois average: 2.05

ED visits per 1,000 days Info Number of outpatient emergency department visits per 1,000 long-stay resident days. 2.81
25% worse than Illinois average

Illinois average: 2.25

Short-stay resident measures
Significantly below average Illinois avg: 2.3 Info CMS star rating based on short-stay quality measure performance. 5 stars = much above average, 1 star = much below average.
Pneumococcal Vaccine Info Percent of short-stay residents assessed and appropriately given the pneumococcal vaccine 70.3%
In line with Illinois average

Illinois average: 68.3%

Antipsychotic medication increase Info Percent of short-stay residents who newly received an antipsychotic medication 0.9%
63% better than Illinois average

Illinois average: 2.3%

Influenza Vaccine Info Percent of short-stay residents assessed and appropriately given the seasonal influenza vaccine 36.3%
42% worse than Illinois average

Illinois average: 63.0%

Re-hospitalized after SNF stay Info Percentage of short-stay residents who were re-hospitalized after their nursing home admission. 31.5%
20% worse than Illinois average

Illinois average: 26.2%

Emergency department visits Info Percentage of short-stay residents who had an outpatient emergency department visit. 16.8%
20% worse than Illinois average

Illinois average: 14.0%

Falls with major injury Info Percentage of SNF residents who experience falls with major injury during their stay. 6.3%
712% worse than Illinois average

Illinois average: 0.8%

Ability to care for self at discharge Info Percentage of residents at or above expected ability to care for themselves at discharge. 48.0%
11% worse than Illinois average

Illinois average: 53.7%

Successful return to home or community Info Rate of successful return to home or community from a skilled nursing facility. 43.9%
13% worse than Illinois average

Illinois average: 50.6%

Breakdown by payment type

Medicare

16% of new residents, usually for short-term rehab.

Typical stay 30 days

Private pay

19% of new residents, often for short stays.

Typical stay 4 - 5 months

Medicaid

65% of new residents, often for long-term daily care.

Typical stay 9 - 10 months

Facility Characteristics

Source: CMS Long-Term Care Facility Characteristics (Data as of Jan 2026)

Total residents 223
Medicare
6
2.7% of residents
Medicaid
203
91% of residents
Private pay or other
14
6.3% of residents
Programs & Services
Residents Group

Residents meet regularly to discuss policies, care quality, and activities

Family Member Group

Family members meet regularly to discuss policies, care quality, and activities

Active Family Council

Organized group of family members that meets regularly to discuss facility policies, resident care, and activities.

Active Resident Council

Organized group of residents that meets regularly to discuss facility policies, quality of life, and activities.

Finances and operations

Based on CMS SNF Cost Report for fiscal year ending in 12/2023.

Voluntary non-profit community
Operated by a church.
Net patient revenue Info Net patient revenue — what the home actually collects for resident care, after contractual allowances, bad debt and discounts are subtracted from its gross charges (CMS cost report, Worksheet G-3). It covers resident care only; money the home earns from other sources is shown separately as "Other income."
$8.7M
Net patient income Info Net patient income: net patient revenue minus the home's total operating expenses. A positive figure means it earns more from resident care than it spends to deliver it; a negative figure means the opposite. It excludes non-operating "other income."
-$1.8M
Voluntary non-profit community Operated by a church.
Net patient revenue Info Net patient revenue — what the home actually collects for resident care, after contractual allowances, bad debt and discounts are subtracted from its gross charges (CMS cost report, Worksheet G-3). It covers resident care only; money the home earns from other sources is shown separately as "Other income."
$8.7M Rank #139 / 171Revenue — State benchmarkedThis home is ranked 139th out of 171 homes in Illinois. Shows this facility's annual revenue compared to the Illinois average. Higher revenue generally means more resources for staffing and capital — read alongside Payroll %.Ranking totals vary by category as each rank only includes facilities that report data for that metric. Homes missing that data point aren't included in the ranking.Click the rank badge to see the full State ranking.Click here to see the full State ranking.
Net patient income Info Net patient income: net patient revenue minus the home's total operating expenses. A positive figure means it earns more from resident care than it spends to deliver it; a negative figure means the opposite. It excludes non-operating "other income."
-$1.8M
Other income Info Money the home earns outside of resident care — such as investments, grants, rentals and other non-operating sources (CMS cost report, Worksheet G-3). It is tracked separately from net patient revenue: it is not part of that figure, and it is not included in net patient income.
$294.8K
Payroll costs Info Staff salaries plus wage-related costs — benefits such as payroll taxes, health insurance and retirement — from the home's own accounting records (CMS cost report, Worksheet A). Contract or agency labor is counted separately, under other operating costs. Rank #116 / 171Payroll — State benchmarkedThis home is ranked 116th out of 171 homes in Illinois. Shows total annual staff payroll benchmarked to the Illinois average. Higher payroll investment relative to peers often signals better staffing and less reliance on cheaper contract labor.Ranking totals vary by category as each rank only includes facilities that report data for that metric. Homes missing that data point aren't included in the ranking.Click the rank badge to see the full State ranking.Click here to see the full State ranking.
$5.8M 66% of net patient revenue Info Payroll as a share of revenue: staff salaries and wage-related benefits divided by net patient revenue. A higher figure means more of each revenue dollar goes to staff pay. Rank #28 / 171Payroll % — State benchmarkedThis home is ranked 28th out of 171 homes in Illinois. Shows payroll as a percentage of revenue versus the Illinois average. Well-run Illinois facilities typically land around 54–67% — the top third Statewide. Below 25% may signal understaffing or heavy agency use — read with Staffing ratings.Ranking totals vary by category as each rank only includes facilities that report data for that metric. Homes missing that data point aren't included in the ranking.Click the rank badge to see the full State ranking.Click here to see the full State ranking.
Other operating costs Info Everything it costs to run the home apart from payroll — food, utilities, supplies, maintenance, contract labor and administration. Calculated as total operating expense minus payroll (staff salaries and wage-related benefits).
$4.7M
Total costs Info The home's total operating expense for the year — all the costs of running it, salaries included (CMS cost report, Worksheet G-3).
$10.5M

Who this home usually serves

TYPE OF STAY

Mostly long-term care residents

Most residents stay for extended periods and receive ongoing daily care.

Most new residents arrive under Medicaid (65% of admissions), and a typical Medicaid stay runs around 9 - 10 months.

Admissions
161 total

Coverage residents most often arrive under.

Medicare 16%
Private pay 19%
Medicaid 65%
Discharges
151 total

Coverage residents most often leave under.

Medicare 12%
Private pay 17%
Medicaid 72%

Places of interest near Symphony Bronzeville

Address 4.0 miles from city center Info Estimated distance in miles from Chicago's city center to Symphony Bronzeville's address, calculated via Google Maps. — 0.72 miles to nearest hospital (Apogee Health Partners)

Calculate Travel Distance to Symphony Bronzeville

Add your location

Address

Compare Nursing Home around Chicago

The information below is reported by the Illinois Department of Public Health, Office of Health Care Regulation.

5 facilities compared · CMS & IL Dept. of Health data

The Selfhelp Home Senior Living Community
NH
AL
IL
RC
Chicago (Uptown)
72
Facility 72
IL AVG 86
Rank #209 / 426
81.9%
Facility 81.9%
IL AVG 69.3%
Rank #74 / 204
+18%
5.56
Facility 5.56
IL AVG 3.10
Rank #8 / 172
+44% +79%
$0
Facility $0
IL AVG $151.3k
Rank #1 / 173
21
Facility 21
IL AVG 36.8
Rank #45 / 172
5.3
Facility 5.3
IL AVG 3.7
Rank #154 / 172
1 55 A+
92
Facility 92
IL AVG 51
Rank #28 / 648
Marvin Rubin
$9.3M
Facility $9.3M
IL AVG $12.2M
Rank #78 / 171
$7.0M
Facility $7.0M
IL AVG $4.8M
Rank #73 / 171
75.3%
Facility 75.3%
IL AVG 44.3%
Rank #70 / 171
146009
Encore Village of Schaumburg
NH
AL
IL
MC
Schaumburg
109
Facility 109
IL AVG 86
Rank #108 / 426
55.4%
Facility 55.4%
IL AVG 69.3%
Rank #169 / 204
-20%
3.46
Facility 3.46
IL AVG 3.10
Rank #54 / 172
+8% +12%
$25.5k
Facility $25.5k
IL AVG $151.3k
Rank #94 / 173
28
Facility 28
IL AVG 36.8
Rank #69 / 172
2.6
Facility 2.6
IL AVG 3.7
Rank #28 / 172
2 105 A+
58
Facility 58
IL AVG 51
Rank #253 / 648
Il Ccrc, LLC
$16.2M
Facility $16.2M
IL AVG $12.2M
Rank #1 / 171
$15.9M
Facility $15.9M
IL AVG $4.8M
Rank #4 / 171
98.3%
Facility 98.3%
IL AVG 44.3%
Rank #171 / 171
145341
Smith Village
NH
AL
IL
MC
Chicago (South Side)
82
Facility 82
IL AVG 86
Rank #171 / 426
85.4%
Facility 85.4%
IL AVG 69.3%
Rank #57 / 204
+23%
5.28
Facility 5.28
IL AVG 3.10
Rank #10 / 172
+4% +70%
$0
Facility $0
IL AVG $151.3k
Rank #1 / 173
20
Facility 20
IL AVG 36.8
Rank #42 / 172
3.3
Facility 3.3
IL AVG 3.7
Rank #69 / 172
4 66 A+
71
Facility 71
IL AVG 51
Rank #147 / 648
The Washington And Jane Smith Home
$11.0M
Facility $11.0M
IL AVG $12.2M
Rank #31 / 171
$8.0M
Facility $8.0M
IL AVG $4.8M
Rank #24 / 171
72.5%
Facility 72.5%
IL AVG 44.3%
Rank #108 / 171
145904
Montgomery Place
NH
AL
IL
MC
Chicago (East Hyde Park)
40
Facility 40
IL AVG 86
Rank #350 / 426
35.0%
Facility 35.0%
IL AVG 69.3%
Rank #189 / 204
-49%
4.00
Facility 4.00
IL AVG 3.10
Rank #42 / 172
+31% +29%
$51.6k
Facility $51.6k
IL AVG $151.3k
Rank #107 / 173
30
Facility 30
IL AVG 36.8
Rank #79 / 172
4.3
Facility 4.3
IL AVG 3.7
Rank #132 / 172
1 14 A+
82
Facility 82
IL AVG 51
Rank #98 / 648
Margo Brooks Pugh
$13.8M
Facility $13.8M
IL AVG $12.2M
Rank #70 / 171
$6.9M
Facility $6.9M
IL AVG $4.8M
Rank #69 / 171
49.7%
Facility 49.7%
IL AVG 44.3%
Rank #86 / 171
145748
Symphony Bronzeville
NH
Chicago (Douglas)
302
Facility 302
IL AVG 86
Rank #2 / 426
- -
1.85
Facility 1.85
IL AVG 3.10
Rank #163 / 172
-14% -40%
$239.1k
Facility $239.1k
IL AVG $151.3k
Rank #158 / 173
88
Facility 88
IL AVG 36.8
Rank #168 / 172
2.8
Facility 2.8
IL AVG 3.7
Rank #37 / 172
12 3 C+
86
Facility 86
IL AVG 51
Rank #66 / 648
Aliya Gb Holdings LLC
$8.7M
Facility $8.7M
IL AVG $12.2M
Rank #139 / 171
$5.8M
Facility $5.8M
IL AVG $4.8M
Rank #116 / 171
66%
Facility 66%
IL AVG 44.3%
Rank #28 / 171
145337

Financial Assistance for
Nursing Home in Illinois

Symphony Bronzeville is located in Chicago, Illinois.
Here are the financial assistance programs available to residents in Illinois.

Get Financial aid guidance

Community Care Program

Illinois CCP

Age 60+
General Illinois resident, at risk of nursing home placement.
Income Limits (2025) ~$1,215/month individual
Asset Limits $17,500 individual, excludes home, car
IL

High demand in urban areas; waitlists possible.

Benefits
In-home care (3-5 hours/day) Adult day services ($65/day) Emergency home response systems ($30/month)

Illinois Respite Program

IL Respite (via NFCSP)

Age Caregiver of someone 60+ (or with dementia)
General Illinois resident.
Income Limits No strict limit; prioritizes low-income.
Asset Limits Not applicable.
IL

Limited slots; urban/rural balance.

Benefits
In-home respite (4-6 hours/day) Adult day care (~$65/day) Short-term facility care (up to 5 days)

Supportive Living Program (SLP)

Illinois Medicaid Supportive Living Program

Age 65+ or 22-64 with disability
General Illinois resident, Medicaid-eligible, needs moderate assistance (not nursing home-level).
Income Limits (2025) ~$2,829/month (300% FBR, individual); QIT allowed.
Asset Limits $2,000 (individual), $3,000 (couple) (excludes home, car).
IL

~200 SLP sites statewide; room/board not covered.

Benefits
Personal care (5-7 hours/day, e.g., bathing, mobility) Meals Housekeeping Medication management Respite (~240 hours/year)

Persons Who Are Elderly Waiver

Illinois Medicaid Elderly Waiver

Age 65+
General Illinois resident, Medicaid-eligible, nursing home-level care need.
Income Limits (2025) ~$2,829/month 300% FBR, individual
Asset Limits $2,000 (individual), $3,000 (couple).
IL

Part of HealthChoice Illinois; consumer-directed options available.

Benefits
Personal care (5-7 hours/day, e.g., dressing, eating) Homemaker Adult day care (~$60/day) Respite (240 hours/year) Home mods ($1,000 avg.)

Medicare Savings Program (MSP)

Illinois Medicare Savings Program

Age 65+ or disabled
General Illinois resident, Medicare Part A/B.
Income Limits (2025) ~$2,510/month (QMB), ~$3,380/month (SLMB), ~$3,598/month (QI)—individual.
Asset Limits $9,430 (individual), $14,130 (couple).
IL

Three tiers; no waitlist.

Benefits
Covers Part B premiums ($174.70/month) Deductibles ($240/year) Copays (~20%)

Optional State Supplementation (OSS)

Illinois Optional State Supplementation

Age 65+ or disabled
General Illinois resident, in approved facility, SSI recipient or low-income.
Income Limits (2025) ~$1,004/month including SSI
Asset Limits $2,000 (individual), $3,000 (couple).
IL

~$50-$500/month based on facility type.

Benefits
Cash (~$50-$500/month) for room/board in personal care homes or SLFs

VA Aid and Attendance (A&A) and Housebound Benefits

Illinois VA Aid and Attendance/Housebound

Age 65+ or disabled veteran/spouse
General Illinois resident, wartime service, need for ADL help (A&A) or homebound.
Income Limits (2025) Net income < ~$1,984/month (veteran with dependent, A&A); pension offsets income.
Asset Limits ~$155,356 net worth limit
IL

High veteran demand in urban/rural areas.

Benefits
Cash (~$1,433-$2,642/month veteran, ~$951-$1,318 spouse) for care costs (e.g., in-home, assisted living)

Frequently Asked Questions about Symphony Bronzeville

What neighborhood is Symphony Bronzeville in?

Symphony Bronzeville is in the Douglas neighborhood of Chicago.

Is Symphony Bronzeville in a walkable area?

Symphony Bronzeville has a walk score of 86. Very walkable. Most errands can be accomplished on foot, and many essentials are within a short walk.

What is the occupancy rate at Symphony Bronzeville?

Symphony Bronzeville's occupancy is 55.5%.

Are there photos of Symphony Bronzeville?

Yes — there are 3 photos of Symphony Bronzeville in the photo gallery on this page.

What is the phone number of Symphony Bronzeville?

(312) 842-5000 will put you in contact with the team at Symphony Bronzeville.

Is Symphony Bronzeville Medicare or Medicaid certified?

Yes — Symphony Bronzeville is a CMS-certified provider of Medicare and Medicaid.

Guides for Better Senior Living

Care Cost Calculator: See Prices in Your Area

Nursing Home Data Explorer

Don’t Wait Too Long: 7 Red Flag Signs Your Parent Needs Assisted Living Now

The True Cost of Assisted Living in 2025 – And How Families Are Paying For It

Understanding Senior Living Costs: Pricing Models, Discounts & Financial Assistance