Total health inspections
6
Florida average 4.3
Last Health inspection on Jan 2025

We arrange tours, appointments, and even moving support so you don’t have to
Thank you for your interest!
Our team will be in touch shortly to help with next steps.
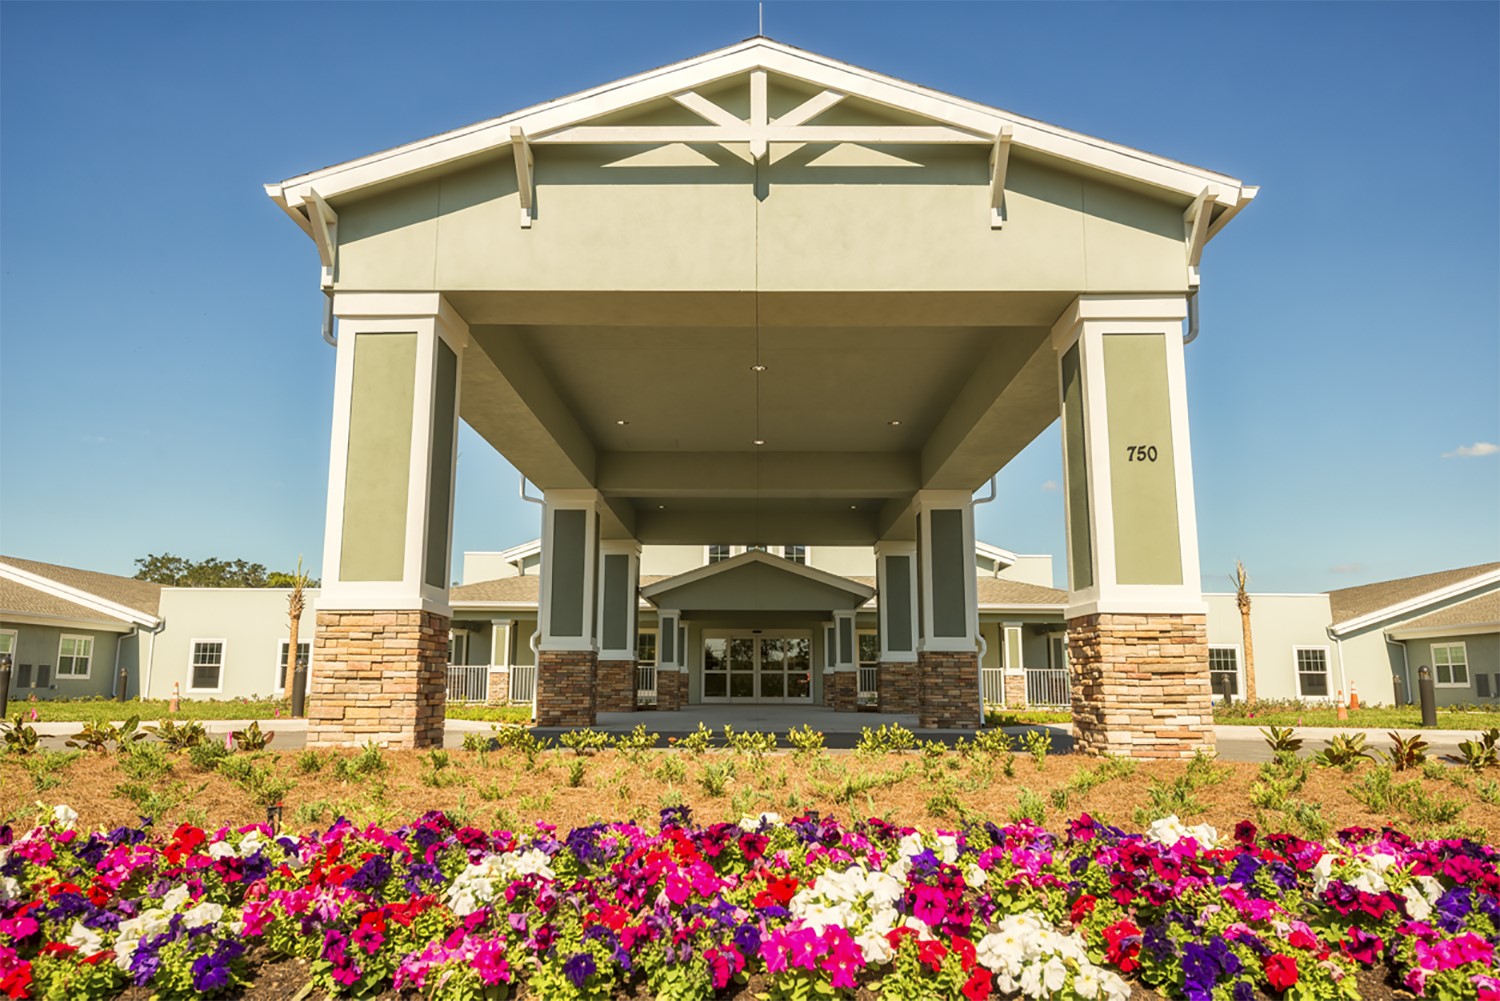


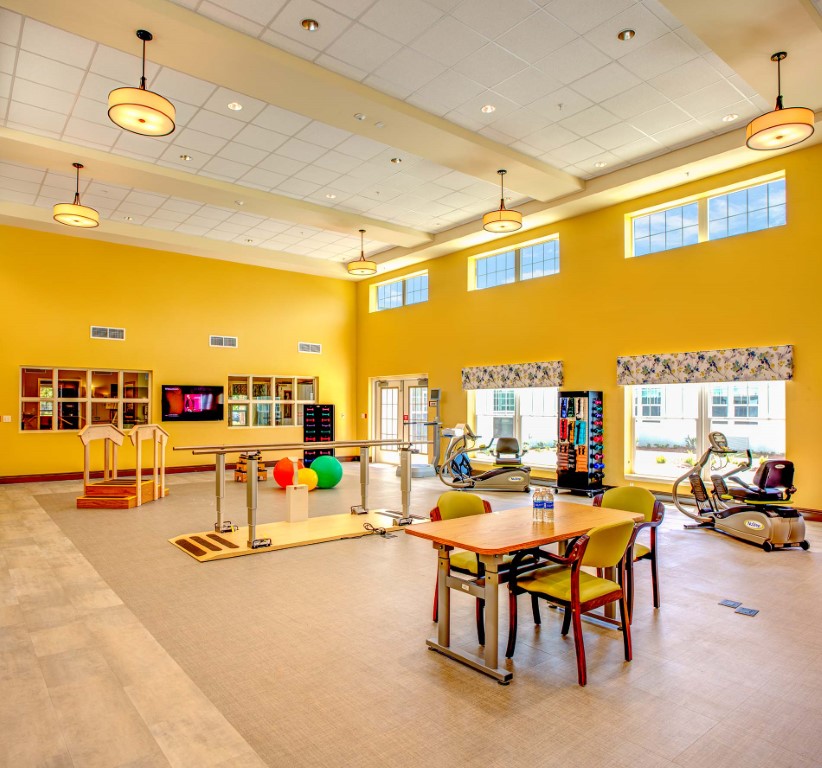
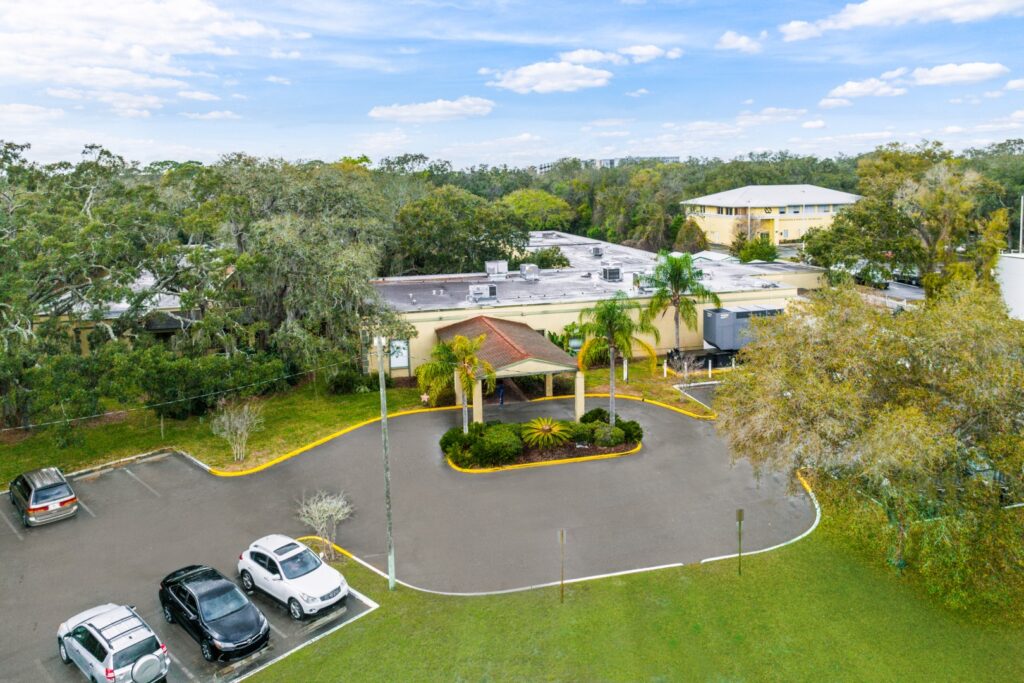
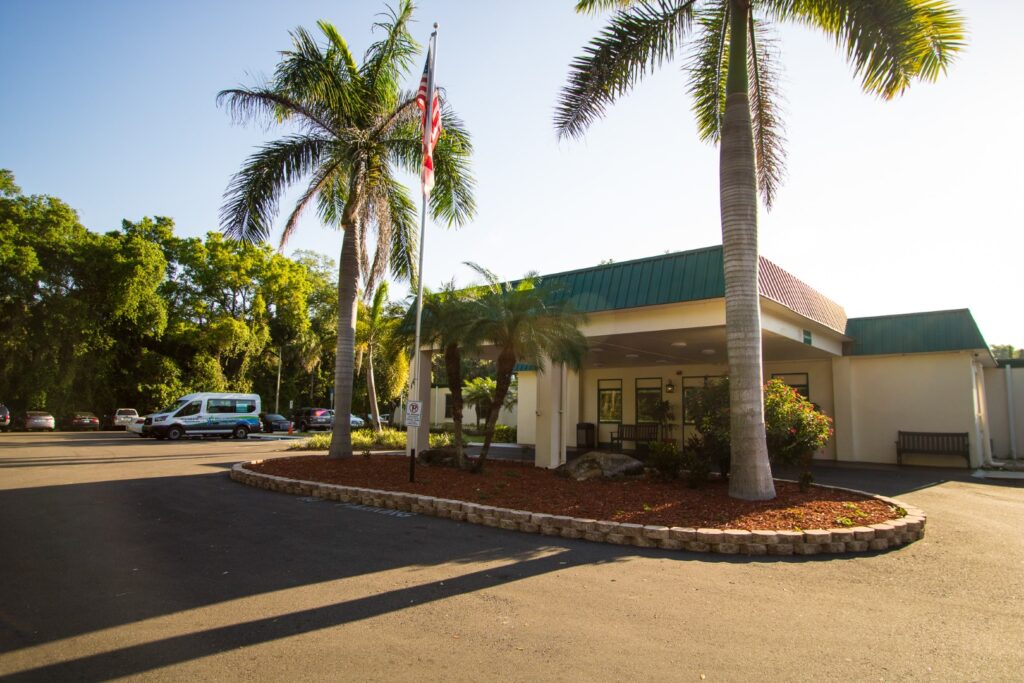
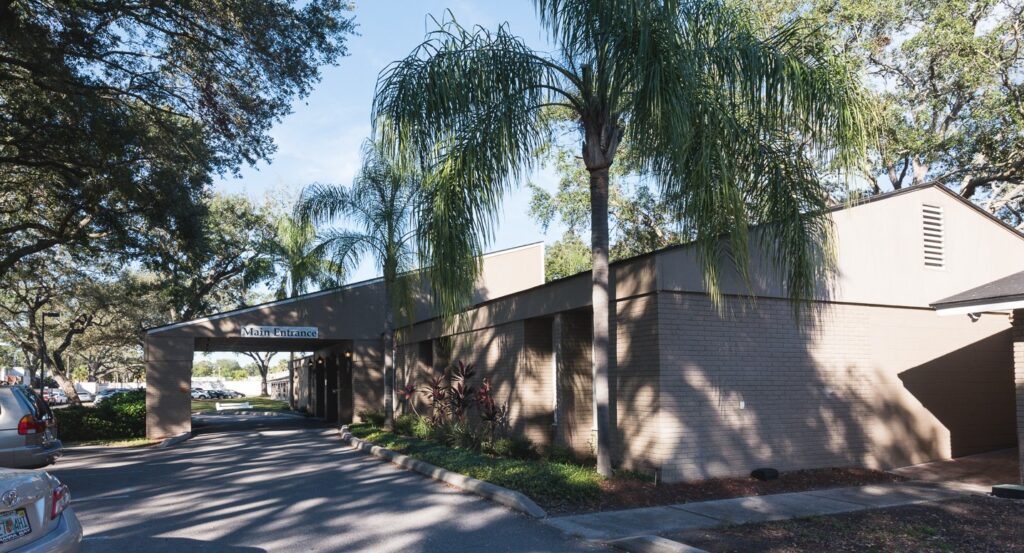
Surrounded by lush trees and green spaces in Lutz, FL, Tampa Lakes Health and Rehabilitation Center offers a safe and relaxing environment for those needing rehabilitation and skilled nursing care. Residents looking to recover their strengths and abilities have access to an excellent rehabilitation team that oversees their personalized treatment plans while utilizing therapeutic amenities, such as a state-of-the-art therapy gym, mobility therapy garden, and more. A 24/7 care team is also trained to offer residents an array of specialized healthcare services, including medication management, wound care, and wellness services like podiatry and dentistry.
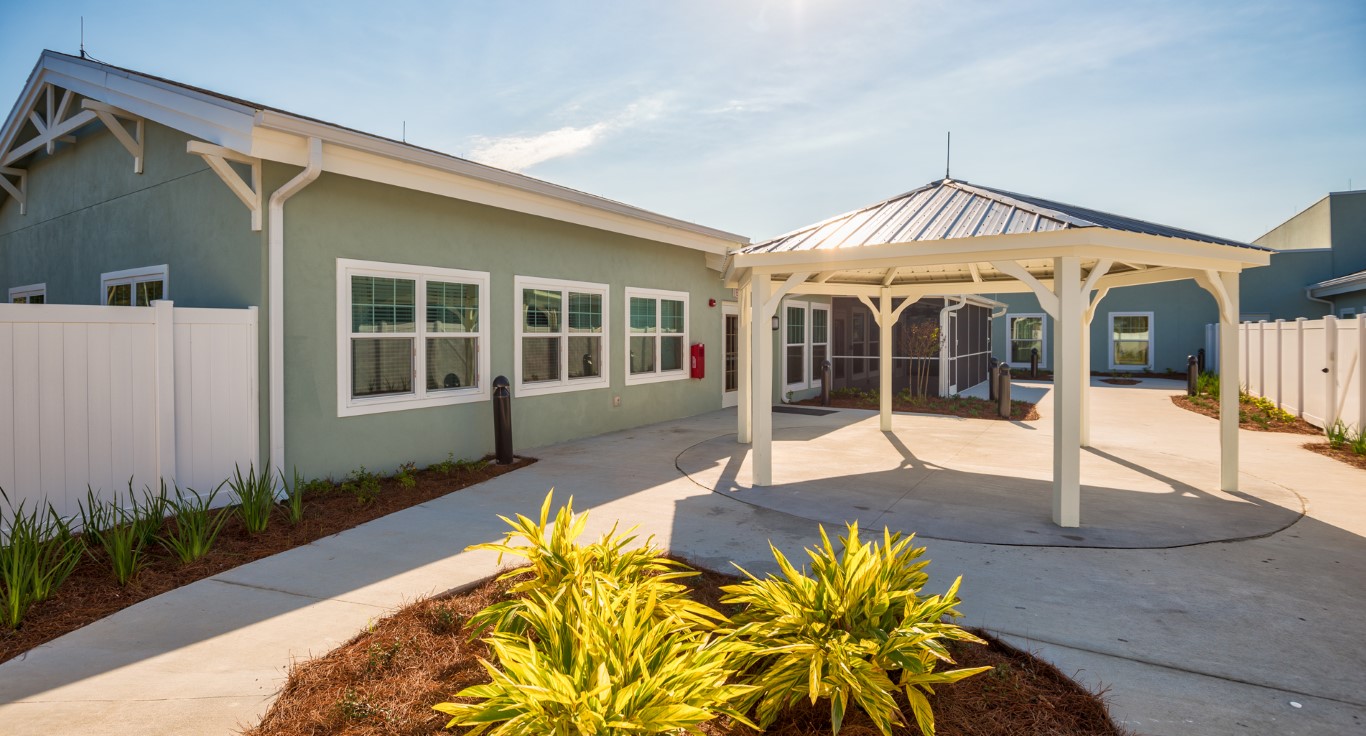
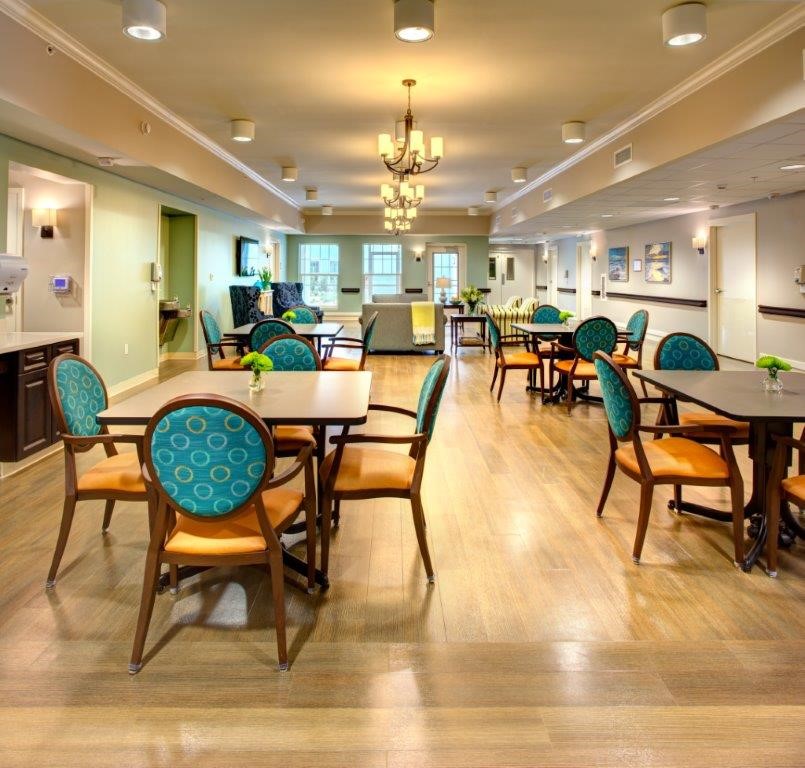
Their engaging activities, regular outings, and community events provide residents with opportunities to maintain their physical well-being while staying socially engaged to avoid isolation. Dietary services are offered to make sure residents are receiving proper nourishment and nutrition tailored to their unique preferences and needs. Amenities like a salon and cozy common areas are also available to make residents’ stay at Tampa Lakes Health and Rehabilitation Center as comfortable as possible.
Offers a balance of services and community atmosphere.
Lower occupancy suggests more openings may be available.
Most residents typically stay for a few weeks or months before returning home or moving on.
58% of new residents, usually for short-term rehab.
13% of new residents, often for short stays.
29% of new residents, often for long-term daily care.
Housing Options: Private / Semi-Private Rooms
Building Type: Single-story
Dining Services
Beauty Services
Transportation Services
Housekeeping Services
Recreational Activities
Exercise Programs
In Florida, the Agency for Health Care Administration (AHCA) is the primary authority that conducts unannounced inspections and completes official health quality reports for all healthcare facilities.
3 visits/inspections triggered by complaints
2 routine inspections
6 with issues
0 without issues
Deficiencies indicate regulatory issues. A higher number implies the facility had several areas requiring improvement.
Florida average: 19 deficiencies
Florida average: 5 fines
Florida average: $11,623.53
Florida average: 3 legal actions
Florida average 4.3
Last Health inspection on Jan 2025
Florida average 19.7
Florida average 4.48
Health citations are formal notices following inspections when they fail to comply with safety and care standards.
13 of 16 citations resulted from standard inspections; and 3 of 16 resulted from complaint investigations.
Florida average: 0.8
Florida average: 0.4
Data sourced from CMS Health Deficiencies reports. Citation severity codes range from A (least serious) to L (most serious). Immediate Jeopardy (J-L) citations indicate situations where the facility's noncompliance has placed residents at risk of death or serious harm.
Nursing Home Licensed facility providing 24/7 skilled nursing care for residents with complex, ongoing medical needs. Staffed by RNs, LPNs, and CNAs. Inspected and star-rated annually by CMS. Accepts Medicare (short-term rehab) and Medicaid (long-term care).
Nursing Home Licensed facility providing 24/7 skilled nursing care for residents with complex, ongoing medical needs. Staffed by RNs, LPNs, and CNAs. Inspected and star-rated annually by CMS. Accepts Medicare (short-term rehab) and Medicaid (long-term care).
Nursing Home Licensed facility providing 24/7 skilled nursing care for residents with complex, ongoing medical needs. Staffed by RNs, LPNs, and CNAs. Inspected and star-rated annually by CMS. Accepts Medicare (short-term rehab) and Medicaid (long-term care).
Nursing Home Licensed facility providing 24/7 skilled nursing care for residents with complex, ongoing medical needs. Staffed by RNs, LPNs, and CNAs. Inspected and star-rated annually by CMS. Accepts Medicare (short-term rehab) and Medicaid (long-term care).
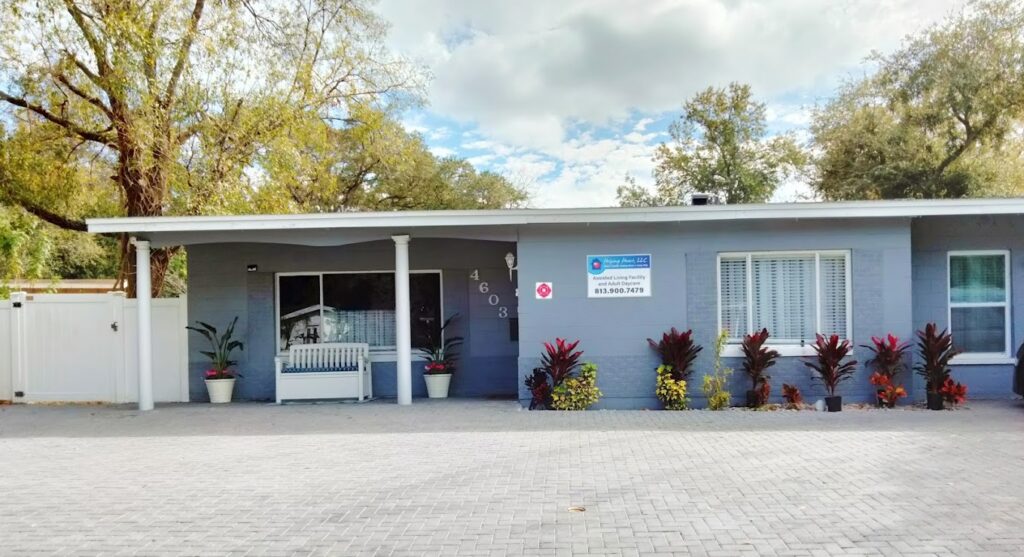
Assisted Living A licensed, long-term care setting for seniors or individuals with disabilities who need help with daily activities — like bathing, dressing, and medication management — but not 24-hour skilled nursing. Offers housing, meals, and around-the-clock support while aiming to maximize resident independence.
Independent Living Lifestyle-focused communities for older adults offering dining, activities, and transportation with minimal personal care. Best for active, independent seniors who want community without medical support.
Memory Care Secured, specialized care for people living with Alzheimer's or dementia. Staff trained in cognitive impairment, with higher staff-to-resident ratios and an environment designed to reduce confusion and wandering risk.
Nursing Home Licensed facility providing 24/7 skilled nursing care for residents with complex, ongoing medical needs. Staffed by RNs, LPNs, and CNAs. Inspected and star-rated annually by CMS. Accepts Medicare (short-term rehab) and Medicaid (long-term care).
![]() 4.1 miles from city center
4.1 miles from city center
![]() 750 Hayes Rd, Lutz, FL 33549
750 Hayes Rd, Lutz, FL 33549
Add your location
This data corresponds to Q2 2025 and is based on CMS Payroll-Based Journal.
Florida average ratio: 1.52:1
Florida average: 7.9 hours
Manages medical care and health needs.
No contractors work on this role.
Assists with medical care and medications.
No contractors work on this role.
Helps with daily care and mobility.
No contractors work on this role.
Total hours from contractors
9,248 contractor hours this quarter
| Certified Nursing Assistant | 126 | 0 | 126 | 36,549 | 91 | 100% | 7.7 |
| Licensed Practical Nurse | 35 | 0 | 35 | 11,871 | 91 | 100% | 8.4 |
| Registered Nurse | 27 | 0 | 27 | 8,711 | 91 | 100% | 7.7 |
| Physical Therapy Aide | 0 | 12 | 12 | 2,454 | 78 | 86% | 7.5 |
| Speech Language Pathologist | 0 | 16 | 16 | 2,448 | 77 | 85% | 7 |
| Clinical Nurse Specialist | 6 | 0 | 6 | 1,764 | 69 | 76% | 8 |
| Respiratory Therapy Technician | 0 | 8 | 8 | 1,623 | 77 | 85% | 8.2 |
| Dietitian | 3 | 3 | 6 | 1,448 | 89 | 98% | 7.6 |
| Physical Therapy Assistant | 0 | 8 | 8 | 1,395 | 73 | 80% | 7 |
| Qualified Social Worker | 0 | 7 | 7 | 1,206 | 68 | 75% | 6.2 |
| Dental Services Staff | 2 | 0 | 2 | 1,001 | 66 | 73% | 8 |
| RN Director of Nursing | 3 | 0 | 3 | 981 | 66 | 73% | 7.9 |
| Mental Health Service Worker | 1 | 0 | 1 | 504 | 63 | 69% | 8 |
| Administrator | 1 | 0 | 1 | 464 | 59 | 65% | 7.9 |
| Nurse Practitioner | 1 | 0 | 1 | 464 | 58 | 64% | 8 |
| Occupational Therapy Aide | 2 | 1 | 3 | 362 | 47 | 52% | 7.7 |
| Occupational Therapy Assistant | 0 | 1 | 1 | 75 | 9 | 10% | 8.3 |
| Medical Director | 0 | 2 | 2 | 21 | 10 | 11% | 1.2 |
| Other Dietary Services Staff | 0 | 3 | 3 | 4 | 4 | 4% | 1 |
Source: CMS Long-Term Care Facility Characteristics (Data as of Jan 2026)
Residents meet regularly to discuss policies, care quality, and activities
Family members meet regularly to discuss policies, care quality, and activities
Organized group of family members that meets regularly to discuss facility policies, resident care, and activities.
Organized group of residents that meets regularly to discuss facility policies, quality of life, and activities.
Data sourced from CMS Long-Term Care Facility Characteristics quarterly report. Payer mix reflects the current resident census by primary payment source.
These measures show how residents usually do over time at this home, based on health outcomes and preventive care.
Florida average: 7.4
Florida average: 12.4
Florida average: 10.5%
Florida average: 12.9%
Florida average: 13.5%
Florida average: 2.6%
Florida average: 5.4%
Florida average: 0.9%
Florida average: 6.0%
Florida average: 3.3%
Florida average: 8.0%
Florida average: 97.7%
Florida average: 99.2%
Florida average: 2.10
Florida average: 1.18
Florida average: 94.0%
Florida average: 1.5%
Florida average: 94.7%
Florida average: 26.2%
Florida average: 9.3%
Florida average: 0.8%
Florida average: 53.7%
Florida average: 50.6%
Quality measures are calculated from Minimum Data Set (MDS) assessments. For most measures, lower percentages indicate better care quality.
Historical financial and operational data for Tampa Lakes Health And Rehabilitation Center based on CMS SNF Cost Reports.
Loading trend charts...
Care Cost Calculator: See Prices in Your Area
Nursing Home Data Explorer
Don’t Wait Too Long: 7 Red Flag Signs Your Parent Needs Assisted Living Now
The True Cost of Assisted Living in 2025 – And How Families Are Paying For It
Understanding Senior Living Costs: Pricing Models, Discounts & Financial Assistance

Touring a community? Use this expert-backed checklist to stay organized, ask the right questions, and find the perfect fit.
We'll send you a PDF version of the touring checklist.