The Bristol at Tampa Rehabilitation & Nursing Center
Nursing Home · Tampa, FL

The Bristol at Tampa Rehabilitation & Nursing Center

Nursing Home · Tampa, FL
Calculator: See prices in your area
The Bristol at Tampa Rehabilitation & Nursing Center accepts Medicare, Medicaid, and private pay.

Overview of The Bristol at Tampa Rehabilitation & Nursing Center

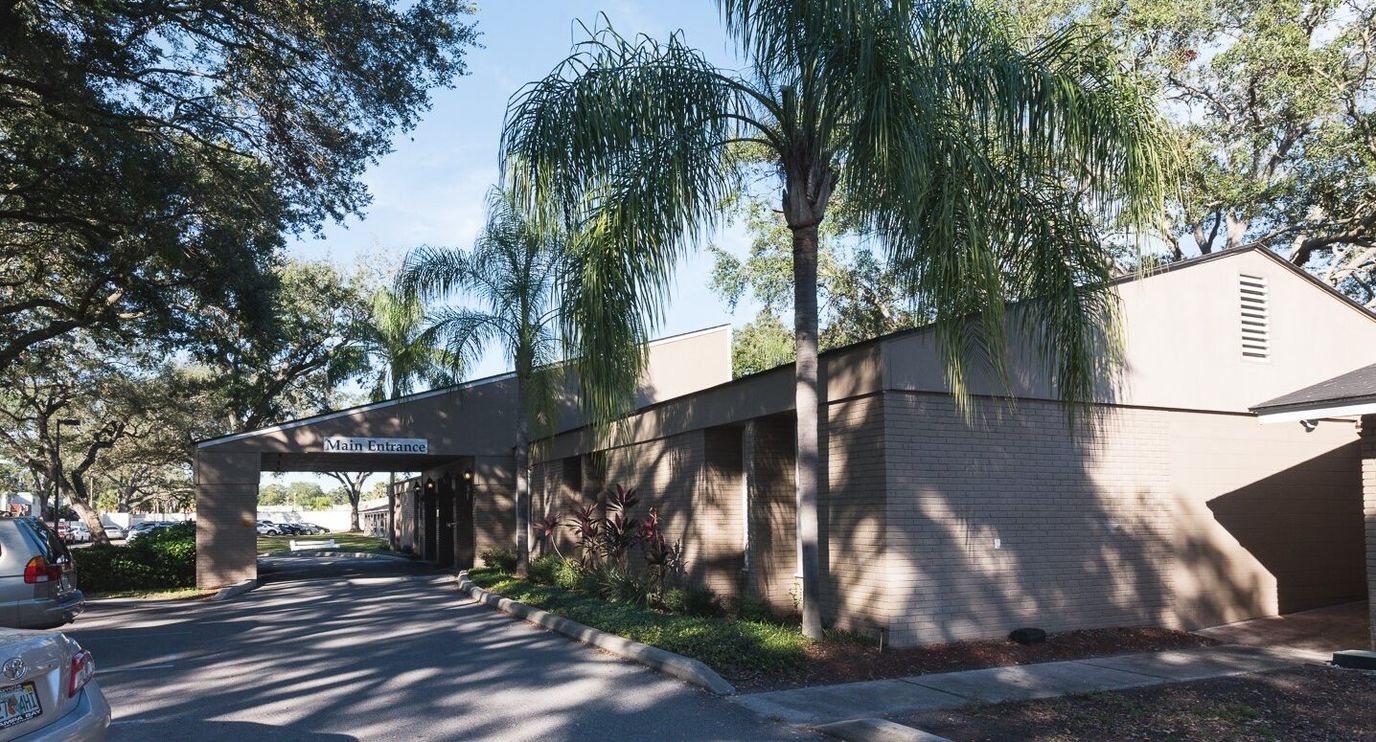
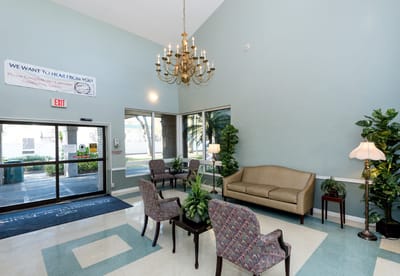
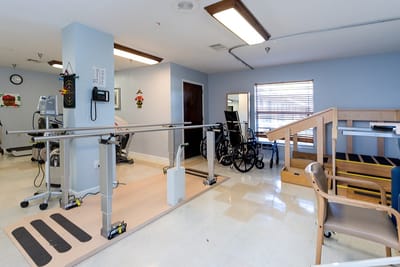
Enjoy an improved quality of life in your golden years with The Bristol at Tampa Rehabilitation & Nursing Center, a reliable community in Tampa, FL for short-term and long-term rehabilitation and skilled nursing care. Their excellent care team is well-trained in a wide range of specialties to ensure residents’ every need is met, including daily living assistance, rehabilitative services, and other complex medical management services. Residents also enjoy the comfort and privacy provided by their private and semi-private accommodations with housekeeping services for their convenience.

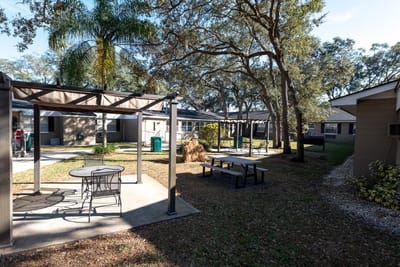
An array of social activities is also organized regularly to help residents maintain an active and well-connected lifestyle while going through their recovery or maintaining their well-being. Fresh, delicious meals are also served with flexible dining options to ensure residents are always nourished and energized. With conveniences like an on-site salon, telehealth consultations, and transportation services, residents’ lives are made more comfortable and convenient.

(813) 971-2383

Staffing hours breakdown

Info Daily nursing hours per resident by staff type, reported to CMS. Higher is generally better — compare this facility to state and national averages to see where staffing stands.

Hours per resident per day — compared to Florida state averages

Total nursing care / resident Info This home is ranked 124th out of 252 homes in Florida. Total adjusted nursing hours per resident per day, combining RN, LPN, and aide time. CMS adjusts this for case-mix so facilities can be fairly compared.
3h 55m per day
Rank #124 / 252Nurse hours — State benchmarkedThis home is ranked 124th out of 252 homes in Florida. Shows adjusted nurse hours per resident per day benchmarked to the Florida average, with a ranking across 252 Florida SNFs. More hours mean more direct care. The national average is about 3.5 hrs; below 3.0 is a red flag.Click the rank badge to see the full State ranking.Click here to see the full State ranking.
vs Florida avg

4 of 6 metrics below state avg

Standout metric LPN / LVN is +13% above state avg
Staff typeHours / Day / Residentvs state avg
Registered Nurse (RN) Info RNs hold the highest nursing license and can assess residents, interpret test results, and direct care plans. More RN hours per day often signals stronger clinical oversight and faster response to health changes. 36m per day ▼ 18% State avg: 44m per day · National avg: 41m per day
LPN / LVN Info Licensed Practical Nurses (LPNs) or Licensed Vocational Nurses (LVNs) deliver routine hands-on care — medication administration, wound dressing, and monitoring vital signs. They work under RN supervision and make up a large share of daily bedside care. 53m per day ▲ 13% State avg: 47m per day · National avg: 52m per day
Nurse Aide Info Certified Nurse Aides (CNAs) provide the most direct day-to-day assistance: bathing, dressing, feeding, and mobility. Nurse aide hours are typically the largest staffing category and directly affect residents' quality of life. 2h 15m per day ▼ 4% State avg: 2h 20m per day · National avg: 2h 21m per day
Weekend Total Nursing Info Combined nursing hours (RN + LPN + Nurse Aide) per resident per day on weekends. Staffing often drops on weekends — this figure reveals whether the facility maintains adequate coverage outside of weekday hours. 3h 14m per day ▼ 8% State avg: 3h 31m per day · National avg: 3h 26m per day
Physical Therapist Info Hours per resident per day provided by licensed Physical Therapists (PTs) or PT Assistants. PT services help residents recover mobility after injury or illness and are especially important for post-acute (short-stay) rehabilitation. 5m per day ■ Avg State avg: 5m per day · National avg: 4m per day
Weekend RN Info Registered nurse hours specifically on weekends. Facilities sometimes reduce RN presence on Saturdays and Sundays — a low weekend RN figure compared to weekday hours can indicate reduced clinical oversight when most administrative staff are absent. 28m per day ▼ 12% State avg: 32m per day · National avg: 29m per day

Types of Care at The Bristol at Tampa Rehabilitation & Nursing Center

Nursing Home

Capacity and availability

This home usually has limited availability

Occupancy between 85% and 95% suggests balanced demand.

Higher occupancy than the Florida average: 84.3%
Occupancy rate 88% Rank #143 / 255Occupancy rate — State benchmarkedThis home is ranked 143rd out of 255 homes in Florida. Shows this facility's occupancy rate versus the Florida average, with its Statewide rank out of 255. Higher occupancy signals strong local demand and financial stability.Click the rank badge to see the full State ranking.Click here to see the full State ranking.
Avg. Length of Stay 118 days
Occupancy rate
88% Rank #143 / 255Occupancy rate — State benchmarkedThis home is ranked 143rd out of 255 homes in Florida. Shows this facility's occupancy rate versus the Florida average, with its Statewide rank out of 255. Higher occupancy signals strong local demand and financial stability.Click the rank badge to see the full State ranking.Click here to see the full State ranking.
Avg. Length of Stay
118 days
Walk Score
Walk Score: 75 / 100 Rank #150 / 1486Walk Score — State benchmarkedThis home is ranked 150th out of 1486 homes in Florida. Shows how walkable this facility's neighborhood is compared to the average Walk Score across Florida SNFs. Higher scores benefit residents, families, and staff.Click the rank badge to see the full State ranking.Click here to see the full State ranking.
Very walkable. Most errands can be accomplished on foot, and many essentials are within a short walk.
BBB Rating
BBB Rating: A+ (Not Accredited)
An independent rating from the Better Business Bureau based on factors such as complaint history, transparency, and business practices.
How BBB ratings work

About this community

Therapy & Rehabilitation

2 services
Rehabilitation Services
Respite Care

Staffing & Medical

1 service
24-Hour Staffing

Amenities & Lifestyle

On-Site Salon Treatments
Family Room And Courtyard
Comfortable Shared Spaces
Fun Social Events
Reliable Transport Services
Fresh And Spotless
Specific ProgramsPalliative Care, Peritoneal Dialysis, IV Therapy / Infusion Skills, Dentist, Audiologist, Podiatrist, Optometrist, Infectious Disease Specialist, Bariatric Care, 24-Hour Skilled Nursing Services, CHF, Pulmonary Disease, and Pneumonia Rehabilitation, Diabetes Management

Contact The Bristol at Tampa Rehabilitation & Nursing Center

Inspection History

In Florida, the Agency for Health Care Administration (AHCA) is the primary authority that conducts unannounced inspections and completes official health quality reports for all healthcare facilities.

Since 2023 · 3 years of data 53 citations

Inspection Scorecard Info This scorecard compares key inspection, citation, and complaint metrics at this facility against the Florida state average. Metrics rated ≥15% worse than average are highlighted in red; those ≥15% better are highlighted in green.

Since 2023 vs. Florida state average
Overall vs. FL average 2 Worse Metrics worse than Florida average:
• Total citations (61% above)
• Citations per year (61% above)
0 Better No metrics in this bucket.
Latest Inspection June 26, 2025 Routine

Citations Info Citations are formal regulatory issues recorded during state inspections.

This FacilityFL Averagevs. FL Avg
Total citations Info Formal regulatory issues recorded by inspectors across all inspection types. 5333 This facility has 61% more total citations than a typical Florida nursing home (53 vs. FL avg 33).↑ 61% worse
Citations per year Info Average citations per year since 2023. 17.711 This facility has 61% more citations per year than a typical Florida nursing home (17.7 vs. FL avg 11).↑ 61% worse

Inspection Reports Summary Info An editor-reviewed summary of the themes and findings across this facility's recent inspection reports.

The most recent inspection on June 26, 2025, found multiple deficiencies related to resident dignity, communication, accommodation of needs, notification of condition changes, cleanliness, nutrition, infection control, documentation, and equipment maintenance. Earlier inspections showed a pattern of issues involving resident care, grievance handling, abuse investigations, medication administration, and safety practices, including a prior immediate jeopardy finding related to fire hazards and abuse in December 2023. Complaint investigations substantiated failures in timely resident assessments after falls, medication administration, and abuse reporting, with some staff terminations following abuse findings. Enforcement actions such as fines or license suspensions were not listed in the available reports. The facility’s inspection history indicates ongoing challenges with resident care and safety, with no clear improvement trend evident over time.

Read the full inspection reports for this facility, including detailed findings and corrective actions.

Show Inspection Reports

Health Inspection History

Inspections since 2023
Total health inspections 6

Florida average 4.3


Last Health inspection on Jun 2025

Total health citations
54 Rank #251 / 251Health citations — State benchmarkedThis home is ranked 251st out of 251 homes in Florida. Shows this facility's total health deficiency citations benchmarked to the Florida State average, with a ranking across all 251 FL SNFs. Lower citation counts earn a better rank.Click the rank badge to see the full State ranking.Click here to see the full State ranking.

Florida average 19.7

Citations per inspection
9 Rank #244 / 251Citations per inspection — State benchmarkedThis home is ranked 244th out of 251 homes in Florida. Shows average deficiency citations per CMS inspection for this facility versus the Florida mean across 251 SNFs with citation data. Lower is better.Click the rank badge to see the full State ranking.Click here to see the full State ranking.

Florida average 4.48


Health citations are formal notices following inspections when they fail to comply with safety and care standards.

34 of 54 citations resulted from standard inspections; 16 of 54 resulted from complaint investigations; and 4 of 54 came from combined inspections (standard and complaint).

Breakdown of citation severity (last 3 years)
Critical Health citations
4
400% worse than Florida average

Florida average: 0.8


Serious Health citations
2 Rank #33 / 56Serious citations (G–I) — State benchmarkedThis home is ranked 33rd out of 56 homes in Florida. Shows G–I scope serious health citations for this facility versus other Florida SNFs. Lower counts rank better.Click the rank badge to see the full State ranking.Click here to see the full State ranking.
400% worse than Florida average

Florida average: 0.4

4 critical citations Florida average: 0.8

2 serious citations Florida average: 0.4

48 moderate citations Florida average: 18.4

0 minor citations Florida average: 0.2
Citations history (last 3 years)
Environmental moderate citation Jun 26, 2025
Corrected

Infection Control moderate citation Jun 26, 2025
Corrected

Nursing Services moderate citation Jun 26, 2025
Corrected

Quality of Care moderate citation Jun 26, 2025
Corrected

Staffing Data

Reporting period: October 1 – December 31, 2025 (Q4 2025). Source: CMS Payroll-Based Journal report.

Total staff 265
Employees 263
Contractors 2
Staff to resident ratio 1.14:1
23% worse than Florida average
Florida average ratio: 1.47:1 Florida average ratio: 1.47:1See full Florida ranking
Avg staff/day 117
Average shift 7.6 hours
0% compared with Florida average
Florida average: 7.9 hours Florida average shift: 7.9 hoursSee full Florida ranking
Total staff hours (quarter) 81,310

Nursing staff breakdown

Q4 2025 · Oct 1 – Dec 31 More info This data comes from the CMS Payroll-Based Journal report covering October 1 – December 31, 2025.
Registered Nurse

Manages medical care and health needs.

RN Staff 23
Average shift length Info Average shift length. Calculated as total hours divided by days worked and average staff per day. 7.7 hours

No contractors work on this role.

Licensed Practical Nurse

Assists with medical care and medications.

LPN Staff 38
Average shift length Info Average shift length. Calculated as total hours divided by days worked and average staff per day. 8.5 hours

No contractors work on this role.

Certified Nursing Assistant

Helps with daily care and mobility.

CNA Staff 144
Average shift length Info Average shift length. Calculated as total hours divided by days worked and average staff per day. 7.2 hours

No contractors work on this role.

Contractor staffing

Q4 2025 · Oct 1 – Dec 31 More info This data comes from the CMS Payroll-Based Journal report covering October 1 – December 31, 2025.

Total hours from contractors

0.1%

104 contractor hours this quarter

Speech Language Pathologist: 2

Staff by category

Q4 2025 · Oct 1 – Dec 31 More info This data comes from the CMS Payroll-Based Journal report covering October 1 – December 31, 2025.
Certified Nursing Assistant144014442,56392100%7.2
Licensed Practical Nurse3803814,19592100%8.5
Registered Nurse230238,65792100%7.7
Clinical Nurse Specialist9093,5286874%8
RN Director of Nursing6062,1946773%8
Respiratory Therapy Technician6061,5349199%6.9
Speech Language Pathologist82101,5019098%7.3
Dietitian3031,2468390%8.2
Physical Therapy Assistant5051,0928390%7.5
Mental Health Service Worker2029766470%8
Physical Therapy Aide7079406975%6.6
Qualified Social Worker7078957885%7.2
Other Dietary Services Staff2025206368%7.9
Administrator1015126470%8
Dental Services Staff1015086571%7.8
Nurse Practitioner1014485661%8
144 Certified Nursing Assistant
% of Days 100%
38 Licensed Practical Nurse
% of Days 100%
23 Registered Nurse
% of Days 100%
9 Clinical Nurse Specialist
% of Days 74%
6 RN Director of Nursing
% of Days 73%
6 Respiratory Therapy Technician
% of Days 99%
10 Speech Language Pathologist
% of Days 98%
3 Dietitian
% of Days 90%
5 Physical Therapy Assistant
% of Days 90%
2 Mental Health Service Worker
% of Days 70%
7 Physical Therapy Aide
% of Days 75%
7 Qualified Social Worker
% of Days 85%
2 Other Dietary Services Staff
% of Days 68%
1 Administrator
% of Days 70%
1 Dental Services Staff
% of Days 71%
1 Nurse Practitioner
% of Days 61%

Penalties and fines

Includes penalties issued in 2023

Federal penalties imposed by CMS for regulatory violations, including civil money penalties (fines) and denials of payment for new Medicare/Medicaid admissions.

Source: CMS Penalties Database (Data as of Jan 2026)

Total fines amount $170K Rank #240 / 257Federal fines — State benchmarkedThis home is ranked 240th out of 257 homes in Florida. Shows this facility's cumulative CMS federal fine dollars versus the Florida average among facilities with fines, and where it ranks among 257 skilled nursing facilities in the pool. Lower total dollars mean a better rank.Click the rank badge to see the full State ranking.Click here to see the full State ranking.
136% higher than Florida average

Florida average: $72K

Number of fines 6
127% more fines than Florida average

Florida average: 2.6

Payment Denials Info Serious action where Medicare and/or Medicaid temporarily stops payments for new residents until issues are fixed. 0
100% fewer payment denials than Florida average

Florida average: 0.1

Fines amount comparison
This facility $170K
Florida average $72K
Penalty History

Penalties are imposed by CMS for violations of federal nursing home regulations.

1 penalty in the past 3 years

Dec 1, 2023 · $131K

Civil Money Penalty Info Fines imposed for noncompliance, which can be assessed per day or per instance of violation. Dec 1, 2023
$131K

Last updated: Jan 2026

Quality of care over time

These measures show how residents usually do over time at this home, based on health outcomes and preventive care.

High-risk clinical events score Info A composite score based on pressure ulcers, falls with injury, weight loss, walking ability decline, and activities of daily living decline. 4.3
42% better than Florida average

Florida average: 7.4

Functional decline score Info A composite score based on activities of daily living decline, walking ability decline, and incontinence. 4.6
63% better than Florida average

Florida average: 12.4

Long-stay resident measures
Significantly above average Florida avg: 4.5 Info CMS star rating based on long-stay quality measure performance. 5 stars = significantly above average, 1 star = significantly below average.
Need for Help with Daily Activities Increased Info Percent of long-stay residents whose need for help with daily activities has increased 4.4%
58% better than Florida average

Florida average: 10.5%

Walking Ability Worsened Info Percent of long-stay residents whose ability to move independently worsened 5.2%
60% better than Florida average

Florida average: 12.9%

Low Risk Residents with Bowel/Bladder Incontinence Info Percent of low risk long-stay residents who lose control of their bowels or bladder 4.1%
70% better than Florida average

Florida average: 13.5%

Falls with Major Injury Info Percent of long-stay residents experiencing one or more falls with major injury 1.8%
34% better than Florida average

Florida average: 2.6%

High Risk Residents with Pressure Ulcers Info Percent of long-stay high risk residents with pressure ulcers 4.3%
19% better than Florida average

Florida average: 5.4%

Urinary Tract Infection Info Percent of long-stay residents with a urinary tract infection 0.9%
In line with Florida average

Florida average: 0.9%

Lost Too Much Weight Info Percent of long-stay residents who lose too much weight 5.9%
In line with Florida average

Florida average: 6.0%

Depressive Symptoms Info Percent of long-stay residents who have depressive symptoms 1.6%
52% better than Florida average

Florida average: 3.3%

Pneumococcal Vaccine Info Percent of long-stay residents assessed and appropriately given the pneumococcal vaccine 93.0%
5% worse than Florida average

Florida average: 97.7%

Influenza Vaccine Info Percent of long-stay residents assessed and appropriately given the seasonal influenza vaccine 100.0%
In line with Florida average

Florida average: 99.2%

Hospitalizations per 1,000 days Info Number of hospitalizations per 1,000 long-stay resident days. 3.25
55% worse than Florida average

Florida average: 2.10

ED visits per 1,000 days Info Number of outpatient emergency department visits per 1,000 long-stay resident days. 1.77
50% worse than Florida average

Florida average: 1.18

Short-stay resident measures
Significantly below average Florida avg: 3.1 Info CMS star rating based on short-stay quality measure performance. 5 stars = much above average, 1 star = much below average.
Pneumococcal Vaccine Info Percent of short-stay residents assessed and appropriately given the pneumococcal vaccine 76.0%
19% worse than Florida average

Florida average: 94.0%

Antipsychotic medication increase Info Percent of short-stay residents who newly received an antipsychotic medication 2.0%
33% worse than Florida average

Florida average: 1.5%

Influenza Vaccine Info Percent of short-stay residents assessed and appropriately given the seasonal influenza vaccine 92.3%
In line with Florida average

Florida average: 94.7%

Re-hospitalized after SNF stay Info Percentage of short-stay residents who were re-hospitalized after their nursing home admission. 32.3%
23% worse than Florida average

Florida average: 26.2%

Emergency department visits Info Percentage of short-stay residents who had an outpatient emergency department visit. 13.2%
42% worse than Florida average

Florida average: 9.3%

Falls with major injury Info Percentage of SNF residents who experience falls with major injury during their stay. 1.6%
101% worse than Florida average

Florida average: 0.8%

Ability to care for self at discharge Info Percentage of residents at or above expected ability to care for themselves at discharge. 33.1%
38% worse than Florida average

Florida average: 53.7%

Successful return to home or community Info Rate of successful return to home or community from a skilled nursing facility. 26.2%
48% worse than Florida average

Florida average: 50.6%

Breakdown by payment type

Medicare

24% of new residents, usually for short-term rehab.

Typical stay 1 - 2 months

Private pay

54% of new residents, often for short stays.

Typical stay 29 days

Medicaid

21% of new residents, often for long-term daily care.

Typical stay 1 years

Facility Characteristics

Source: CMS Long-Term Care Facility Characteristics (Data as of Jan 2026)

Total residents 233
Medicare
22
9.4% of residents
Medicaid
155
66.5% of residents
Private pay or other
56
24% of residents
Programs & Services
Residents Group

Residents meet regularly to discuss policies, care quality, and activities

Nurse Aide Training

State-approved Nurse Aide Training and Competency Evaluation Program on-site

Active Resident Council

Organized group of residents that meets regularly to discuss facility policies, quality of life, and activities.

Finances and operations

Privately-owned community
Home revenue
$24.4M
Operating loss
-$266.2K
Privately-owned community
Home revenue
$24.4M Rank #70 / 256Revenue — State benchmarkedThis home is ranked 70th out of 256 homes in Florida. Shows this facility's annual revenue compared to the Florida SNF average. Higher revenue generally means more resources for staffing and capital — read alongside Payroll %.Click the rank badge to see the full State ranking.Click here to see the full State ranking.
Operating loss
-$266.2K
Payroll costs Info The portion of the home's budget spent on staff, including nurses, caregivers, and other employees who support care and operations. Rank #32 / 256Payroll — State benchmarkedThis home is ranked 32nd out of 256 homes in Florida. Shows total annual staff payroll benchmarked to the Florida average. Higher payroll investment relative to peers often signals better staffing and less reliance on cheaper contract labor.Click the rank badge to see the full State ranking.Click here to see the full State ranking.
$13.8M
56.3% of revenue Rank #25 / 256Payroll % — State benchmarkedThis home is ranked 25th out of 256 homes in Florida. Shows payroll as a percentage of revenue versus the Florida average. Well-run Florida SNFs typically land around 49–56% — the top third Statewide. Below 25% may signal understaffing or heavy agency use — read with Staffing ratings.Click the rank badge to see the full State ranking.Click here to see the full State ranking.
Other operating costs Info All remaining costs needed to run the home, such as food, utilities, building maintenance, supplies and administrative expenses.
$10.9M
Total costs $24.7M

What does this home offer?

Housing options icon

Housing Options: Private / Semi-Private Rooms

Building type icon
Building type icon

Building Type: Single-story

Dining services icon

Dining Services

Beauty services icon

Beauty Services

Transportation services icon

Transportation Services

Housekeeping icon
Housekeeping icon

Housekeeping Services

Recreational activities icon

Recreational Activities

Exercise program icon

Exercise Programs

Who this home usually serves

TYPE OF STAY

Mix of rehab and long-term care

This home supports both short-term rehab and long-term care, with residents staying for a wide range of durations.

Places of interest near The Bristol at Tampa Rehabilitation & Nursing Center

Address 9.8 miles from city center Info Estimated distance in miles from Tampa's city center to The Bristol at Tampa Rehabilitation & Nursing Center's address, calculated via Google Maps.

Calculate Travel Distance to The Bristol at Tampa Rehabilitation & Nursing Center

Add your location

Address

Financial Assistance for
Nursing Home in Florida

The Bristol at Tampa Rehabilitation & Nursing Center is located in Tampa, Florida.
Here are the financial assistance programs available to residents in Florida.

Get Financial aid guidance

Long-Term Care Waiver

Florida Medicaid LTC Waiver

Age 65+ or 21+ disabled
General Florida resident, Medicaid- eligible, nursing home-level care need.
Income Limits (2025) ~$2,829/month 300% FBR, individual
Asset Limits $2,000 (individual), $3,000 (couple).
FL

High demand; waitlists common.

Benefits
In-home care (6-8 hours/day) Assisted living Respite (240 hours/year) Case management

Community Care for the Elderly (CCE)

Florida CCE

Age 60+
General Florida resident, at risk of nursing home.
Income Limits ~$2,000/month varies
Asset Limits $5,000 individual
FL

Limited funding; regional variation.

Benefits
Homemaker services (3-5 hours/week) Adult day care (~$60/day) Respite (up to 10 days/year)

Home Care for the Elderly (HCE)

Florida Home Care for the Elderly

Age 60+
General Florida resident, at risk of nursing home placement; caregiver must be approved.
Income Limits (2025) ~$2,829/month individual, aligned with Medicaid thresholds
Asset Limits ~$2,000 (individual); varies by case manager discretion.
FL

Limited funding (~3,500 served annually); prioritizes low-income frail seniors.

Benefits
Basic subsidy (~$160/month) for housing/medical costs; special subsidies for supplies/services (e.g., incontinence supplies, ~$50-$200/month)

Program of All-Inclusive Care for the Elderly (PACE)

Florida Medicaid PACE

Age 55+
General Florida resident, nursing home-level care need, safe with PACE support.
Income Limits (2025) ~$2,829/month 300% FBR
Asset Limits $2,000 (individual), $3,000 (couple).
FL

Limited to specific counties (e.g., Hillsborough, Miami-Dade); ~10 sites statewide.

Benefits
Personal care (5-7 hours/day) Medical care Meals Transportation Therapy

Optional State Supplementation (OSS)

Florida Optional State Supplementation

Age 65+ or disabled
General Florida resident, living in approved facility, receiving SSI or low-income.
Income Limits (2025) ~$1,004/month individual, including SSI
Asset Limits $2,000 (individual), $3,000 (couple).
FL

Limited to specific facility types; ~$78.40/month max supplement.

Benefits
Cash payment (~$78.40/month) for room/board or personal needs in facilities

Compare Nursing Home around Hillsborough County

The information below is reported by the Florida Agency for Health Care Administration (AHCA).

4 facilities compared · CMS & FL Dept. of Health data

Filter by care type
Tampa Lakes Health And Rehabilitation Center
NH

Nursing Home Licensed facility providing 24/7 skilled nursing care for residents with complex, ongoing medical needs. Staffed by RNs, LPNs, and CNAs. Inspected and star-rated annually by CMS. Accepts Medicare (short-term rehab) and Medicaid (long-term care).

Lutz (North Tampa)179 92.1% +9%3.50 -19%-13%$0162.7-173A+ 19 -$29.3M$11.8M40.1%106112
Fairway Oaks Center
NH

Nursing Home Licensed facility providing 24/7 skilled nursing care for residents with complex, ongoing medical needs. Staffed by RNs, LPNs, and CNAs. Inspected and star-rated annually by CMS. Accepts Medicare (short-term rehab) and Medicaid (long-term care).

Tampa120 93.5% +11%3.28 -23%-19%$0268.7-108C+ 32 Dawn Debrunner$13.3M$7.2M54.1%105305
Woodbridge Care Center
NH

Nursing Home Licensed facility providing 24/7 skilled nursing care for residents with complex, ongoing medical needs. Staffed by RNs, LPNs, and CNAs. Inspected and star-rated annually by CMS. Accepts Medicare (short-term rehab) and Medicaid (long-term care).

Tampa (Town N County Park)120 100.8% +20%3.37 +43%-17%$4.9k217.0-112- 72 Woodbridge Nursing Holdco LLC$11.9M$2.8M23.5%105426
The Bristol at Tampa Rehabilitation & Nursing Center -
NH

Nursing Home Licensed facility providing 24/7 skilled nursing care for residents with complex, ongoing medical needs. Staffed by RNs, LPNs, and CNAs. Inspected and star-rated annually by CMS. Accepts Medicare (short-term rehab) and Medicaid (long-term care).

Tampa (Cross Fletcher)266 88.0% +4%3.91----28%-3%$173.4k549.06229A+ 75 Bristol Holdco LLC$24.4M$13.8M56.3%105140

Frequently Asked Questions about The Bristol at Tampa Rehabilitation & Nursing Center

What neighborhood is The Bristol at Tampa Rehabilitation & Nursing Center in?

The Bristol at Tampa Rehabilitation & Nursing Center is in the Cross Fletcher neighborhood of Tampa.

Is The Bristol at Tampa Rehabilitation & Nursing Center in a walkable area?

The Bristol at Tampa Rehabilitation & Nursing Center has a walk score of 75. Very walkable. Most errands can be accomplished on foot, and many essentials are within a short walk.

Are there photos of The Bristol at Tampa Rehabilitation & Nursing Center?

Yes — there are 2 photos of The Bristol at Tampa Rehabilitation & Nursing Center in the photo gallery on this page.

What is the address of The Bristol at Tampa Rehabilitation & Nursing Center?

The Bristol at Tampa Rehabilitation & Nursing Center is located at 1818 E Fletcher Ave, Tampa, FL 33612.

What is the phone number of The Bristol at Tampa Rehabilitation & Nursing Center?

(813) 971-2383 will put you in contact with the team at The Bristol at Tampa Rehabilitation & Nursing Center.

Is The Bristol at Tampa Rehabilitation & Nursing Center Medicare or Medicaid certified?

Yes — The Bristol at Tampa Rehabilitation & Nursing Center is a CMS-certified provider of Medicare and Medicaid.

Guides for Better Senior Living

Care Cost Calculator: See Prices in Your Area

Nursing Home Data Explorer

Don’t Wait Too Long: 7 Red Flag Signs Your Parent Needs Assisted Living Now

The True Cost of Assisted Living in 2025 – And How Families Are Paying For It

Understanding Senior Living Costs: Pricing Models, Discounts & Financial Assistance

Explore Open Rooms
1 Contact details
2 What type of senior care service are you looking for?
3 What budget do you have in mind for senior care?
4 How soon do you need to find care?
5 Additional details

Thank you for your interest!

Our team will be in touch shortly to help with next steps.