Tampa Lakes Health And Rehabilitation Center
CMS overall rating Info CMS (the Centers for Medicare & Medicaid Services) is the federal agency that rates nursing home quality. Its Overall Rating runs from 1 to 5 stars, combining health inspections, staffing, and quality measures, with inspections weighted most heavily.

Tampa Lakes Health And Rehabilitation Center

CMS overall rating Info CMS (the Centers for Medicare & Medicaid Services) is the federal agency that rates nursing home quality. Its Overall Rating runs from 1 to 5 stars, combining health inspections, staffing, and quality measures, with inspections weighted most heavily.
Calculator: See prices in your area
Tampa Lakes Health And Rehabilitation Center accepts Medicare, Medicaid, and private pay.

Overview of Tampa Lakes Health and Rehabilitation Center

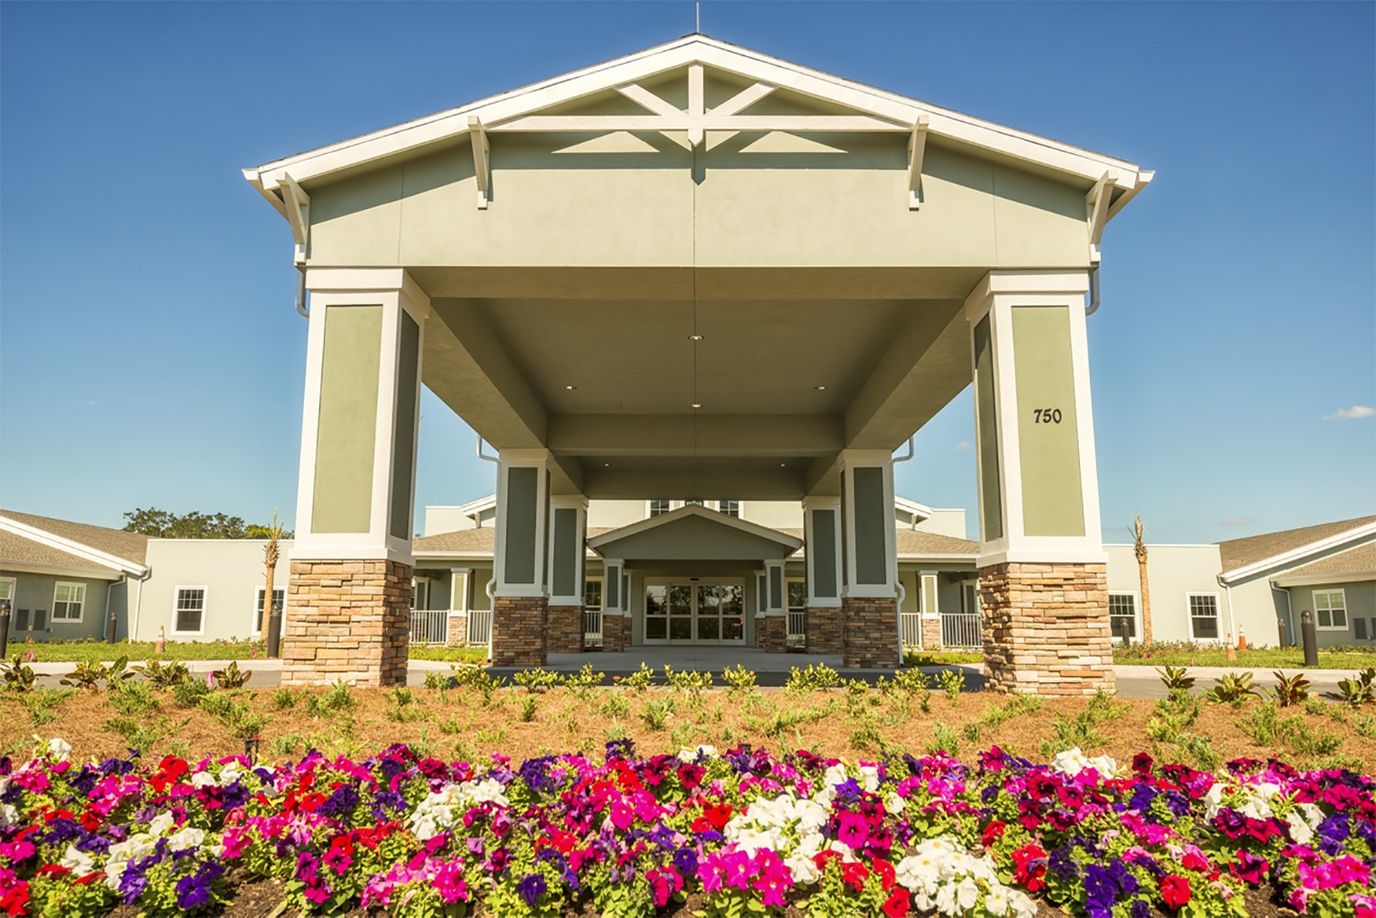
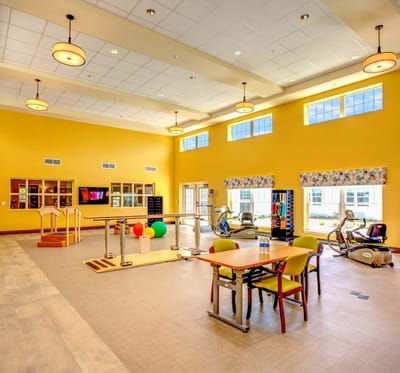
Surrounded by lush trees and green spaces in Lutz, FL, Tampa Lakes Health and Rehabilitation Center offers a safe and relaxing environment for those needing rehabilitation and skilled nursing care. Residents looking to recover their strengths and abilities have access to an excellent rehabilitation team that oversees their personalized treatment plans while utilizing therapeutic amenities, such as a state-of-the-art therapy gym, mobility therapy garden, and more. A 24/7 care team is also trained to offer residents an array of specialized healthcare services, including medication management, wound care, and wellness services like podiatry and dentistry.

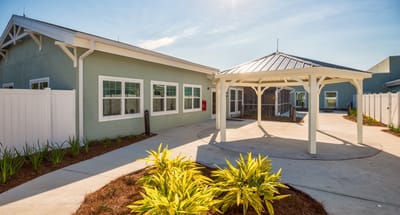
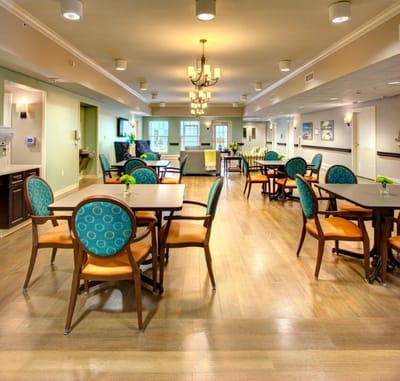
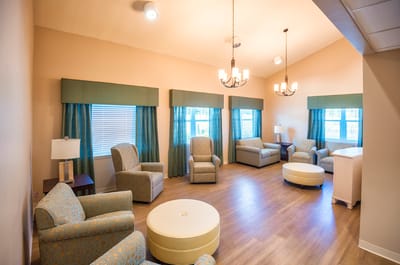
Their engaging activities, regular outings, and community events provide residents with opportunities to maintain their physical well-being while staying socially engaged to avoid isolation. Dietary services are offered to make sure residents are receiving proper nourishment and nutrition tailored to their unique preferences and needs. Amenities like a salon and cozy common areas are also available to make residents’ stay at Tampa Lakes Health and Rehabilitation Center as comfortable as possible.

(813) 559-1500

Quality ratings

Measured by Centers for Medicare & Medicaid Services (CMS)

Overall rating Info The Overall CMS Rating combines results from health inspections, staffing levels and quality measures. Health inspections carry the most weight. Staffing and quality scores can increase or decrease the final rating based on performance compared to state and national standards.
▲ 9.3% Above FL avg. ▲ 9.3% Above FL avg.Click the badge to see the full State ranking.Click here to see the full State ranking.
Health Inspection Info Based on the results of the facility's three most recent standard inspections and any complaint investigations. CMS reviews the number, scope, and severity of deficiencies, with more recent findings weighted more heavily.
▼ 5.4% Below FL avg. ▼ 5.4% Below FL avg.Click the badge to see the full State ranking.Click here to see the full State ranking.
Staffing Info Measures average nursing staff hours per resident per day, including Registered Nurses (RNs) and total nursing staff. Ratings are adjusted based on the level of care residents require and are compared to state and national benchmarks.
▼ 19.6% Below FL avg. ▼ 19.6% Below FL avg.Click the badge to see the full State ranking.Click here to see the full State ranking.
Quality Measures Info Based on clinical and physical health indicators reported to CMS, such as hospital readmissions, falls, pressure ulcers, and improvements in mobility. These measures reflect how well residents' health needs are being managed.
▲ 17.1% Above FL avg. ▲ 17.1% Above FL avg.Click the badge to see the full State ranking.Click here to see the full State ranking.

Staffing hours breakdown

Info Daily nursing hours per resident by staff type, reported to CMS. Higher is generally better — compare this facility to state and national averages to see where staffing stands.

Hours per resident per day — compared to Florida state averages

Total nursing care / resident Info This home is ranked 214th out of 252 homes in Florida for nurse hours. Total adjusted nursing hours per resident per day, combining RN, LPN, and aide time. CMS adjusts this for case-mix so facilities can be fairly compared.
3h 30m per day
Rank #214 / 252Nurse hours — State benchmarkedThis home is ranked 214th out of 252 homes in Florida for nurse hours. Shows adjusted nurse hours per resident per day benchmarked to the Florida average, with a ranking across 252 Florida SNFs. More hours mean more direct care. The national average is about 3.5 hrs; below 3.0 is a red flag.Click the rank badge to see the full State ranking.Click here to see the full State ranking.
This facility Florida avg (4h 25m per day)
vs Florida avg
-21%

2 of 6 metrics below state avg

Standout metric LPN / LVN is +9% above state avg
Staff typeHours / Day / Residentvs state avg
Registered Nurse (RN) Info RNs hold the highest nursing license and can assess residents, interpret test results, and direct care plans. More RN hours per day often signals stronger clinical oversight and faster response to health changes. 43m per day ■ Avg State avg: 44m per day · National avg: 41m per day
LPN / LVN Info Licensed Practical Nurses (LPNs) or Licensed Vocational Nurses (LVNs) deliver routine hands-on care — medication administration, wound dressing, and monitoring vital signs. They work under RN supervision and make up a large share of daily bedside care. 51m per day ▲ 9% State avg: 47m per day · National avg: 52m per day
Nurse Aide Info Certified Nurse Aides (CNAs) provide the most direct day-to-day assistance: bathing, dressing, feeding, and mobility. Nurse aide hours are typically the largest staffing category and directly affect residents' quality of life. 2h 26m per day ▲ 4% State avg: 2h 20m per day · National avg: 2h 21m per day
Weekend Total Nursing Info Combined nursing hours (RN + LPN + Nurse Aide) per resident per day on weekends. Staffing often drops on weekends — this figure reveals whether the facility maintains adequate coverage outside of weekday hours. 3h 35m per day ■ Avg State avg: 3h 31m per day · National avg: 3h 26m per day
Physical Therapist Info Hours per resident per day provided by licensed Physical Therapists (PTs) or PT Assistants. PT services help residents recover mobility after injury or illness and are especially important for post-acute (short-stay) rehabilitation. 4m per day ▼ 20% State avg: 5m per day · National avg: 4m per day
Weekend RN Info Registered nurse hours specifically on weekends. Facilities sometimes reduce RN presence on Saturdays and Sundays — a low weekend RN figure compared to weekday hours can indicate reduced clinical oversight when most administrative staff are absent. 31m per day ▼ 3% State avg: 32m per day · National avg: 29m per day

Capacity and availability

This home usually has availability

Lower occupancy than the Florida average: 84.3%
Occupancy rate
37.4% Rank #250 / 256Occupancy rate — State benchmarkedThis home is ranked 250th out of 256 homes in Florida for occupancy rate. Shows this facility's occupancy rate versus the Florida average, with its Statewide rank out of 256. Higher occupancy signals strong local demand and financial stability.Click the rank badge to see the full State ranking.Click here to see the full State ranking.
Avg. Length of Stay
69 days
Walk Score
Walk Score: 19 / 100 Rank #1108 / 1485Walk Score — State benchmarkedThis home is ranked 1108th out of 1485 homes in Florida for walk score. Shows how walkable this facility's neighborhood is compared to the average Walk Score across Florida SNFs. Higher scores benefit residents, families, and staff.Click the rank badge to see the full State ranking.Click here to see the full State ranking.
Car-dependent. Most errands require a car, with limited nearby walkable options.
BBB Rating
BBB Rating: A+ (Not Accredited)
An independent rating from the Better Business Bureau based on factors such as complaint history, transparency, and business practices.
How BBB ratings work

About this community

License Details

CMS Certification Number106112

Contact Tampa Lakes Health And Rehabilitation Center

Inspection History

In Florida, the Agency for Health Care Administration (AHCA) is the primary authority that conducts unannounced inspections and completes official health quality reports for all healthcare facilities.

Since 2021 · 5 years of data 17 citations
Inspection Score Info A composite 0–100 score combining this facility's inspections, citations, complaints, and enforcement actions relative to the Florida state average. We don't score profiles with fewer than 3 inspections on record because a small inspection history reads as "below average" on every count-based metric — that would over-reward a facility just for being new.

Limited inspection history. Not enough information to score against the Florida benchmark.

Florida nursing homes benchmark: B 83/100

Inspection score not available. Not enough information to score against the Florida benchmark.

Inspection Scorecard Info This scorecard compares key inspection, citation, and complaint metrics at this facility against the Florida state average. Metrics rated ≥15% worse than average are highlighted in red; those ≥15% better are highlighted in green.

Since 2021 vs. Florida state average
Overall vs. FL average 0 Worse No metrics in this bucket. 2 Better Metrics better than Florida average:
• Total citations (48% below)
• Citations per year (48% below)
Latest Inspection January 9, 2025 Routine

Citations Info Citations are formal regulatory issues recorded during state inspections.

This FacilityFL Averagevs. FL Avg
Total citations Info Formal regulatory issues recorded by inspectors across all inspection types. 1733 This facility has 48% fewer total citations than a typical Florida nursing home (17 vs. FL avg 33).↓ 48% better
Citations per year Info Average citations per year since 2021. 3.46.6 This facility has 48% fewer citations per year than a typical Florida nursing home (3.4 vs. FL avg 6.6).↓ 48% better

Inspection Reports Summary Info An editor-reviewed summary of the themes and findings across this facility's recent inspection reports.

  • January 9, 2025 routine inspection found five deficiencies including failure to complete PASRR Level II screenings, improper medication monitoring, food safety lapses, privacy breaches, and infection control failures.
  • May 15, 2024 complaint investigation confirmed Resident #3 was without his wheelchair for two days due to staff borrowing it without timely return, limiting mobility and causing distress.
  • March 13, 2024 inspection found one deficiency for unclean ice machines and dispensers despite confirmed cleaning schedules, with no further complaints or immediate jeopardy cited.

Health Inspection History

Inspections since 2021
Total health inspections 6

Florida average 4.3


Last Health inspection on Jan 2025

Total health citations
16 Rank #107 / 251Health citations — State benchmarkedThis home is ranked 107th out of 251 homes in Florida for health citations. Shows this facility's total health deficiency citations benchmarked to the Florida State average, with a ranking across all 251 FL SNFs. Lower citation counts earn a better rank.Click the rank badge to see the full State ranking.Click here to see the full State ranking.

Florida average 19.7

Citations per inspection
2.67 Rank #39 / 251Citations per inspection — State benchmarkedThis home is ranked 39th out of 251 homes in Florida for citations per inspection. Shows average deficiency citations per CMS inspection for this facility versus the Florida mean across 251 SNFs with citation data. Lower is better.Click the rank badge to see the full State ranking.Click here to see the full State ranking.

Florida average 4.48


Health citations are formal notices following inspections when they fail to comply with safety and care standards.

13 of 16 citations resulted from standard inspections; and 3 of 16 resulted from complaint investigations.

Breakdown of citation severity (last 5 years)
Critical health citations
0
100% better than Florida average

Florida average: 0.8


Serious health citations
0
100% better than Florida average

Florida average: 0.4

0 critical citations Florida average: 0.8

0 serious citations Florida average: 0.4

16 moderate citations Florida average: 18.4

0 minor citations Florida average: 0.2
Citations history (last 5 years)
Infection Control moderate citation Jan 09, 2025
Corrected

Nutrition moderate citation Jan 09, 2025
Corrected

Pharmacy moderate citation Jan 09, 2025
Corrected

Care Planning moderate citation Jan 09, 2025
Corrected

Staffing Data

Reporting period: October 1 – December 31, 2025 (Q4 2025). Source: CMS Payroll-Based Journal report.

Total staff 266
Employees 229
Contractors 37
Staff to resident ratio 1.55 : 1
5% more staff per resident than Florida average
Florida average ratio: 1.47 : 1 Florida average ratio: 1.47 : 1See full Florida ranking
Avg staff/day 101
Average shift 7.5 hours
5% worse than Florida average
Florida average: 7.9 hours Florida average shift: 7.9 hoursSee full Florida ranking
Total staff hours (quarter) 69,321

Nursing staff breakdown

Q4 2025 · Oct 1 – Dec 31 More info This data comes from the CMS Payroll-Based Journal report covering October 1 – December 31, 2025.
Registered Nurse

Manages medical care and health needs.

RN Staff Info All 26 RN Staff are full-time employees. No contractors work on this role. 26
Average shift length Info Average shift length. Calculated as total hours divided by days worked and average staff per day. 7.3 hours
Licensed Practical Nurse

Assists with medical care and medications.

LPN Staff Info All 47 LPN Staff are full-time employees. No contractors work on this role. 47
Average shift length Info Average shift length. Calculated as total hours divided by days worked and average staff per day. 8.1 hours
Certified Nursing Assistant

Helps with daily care and mobility.

CNA Staff Info All 140 CNA Staff are full-time employees. No contractors work on this role. 140
Average shift length Info Average shift length. Calculated as total hours divided by days worked and average staff per day. 7.3 hours

Contractor staffing

Q4 2025 · Oct 1 – Dec 31 More info This data comes from the CMS Payroll-Based Journal report covering October 1 – December 31, 2025.

Total hours from contractors

7.3%

5,050 contractor hours this quarter

Dietitian: 7 Speech Language Pathologist: 7 Physical Therapy Aide: 6 Physical Therapy Assistant: 5 Respiratory Therapy Technician: 4 Qualified Social Worker: 3 Occupational Therapy Aide: 3 Medical Director: 2

Staff by category

Q4 2025 · Oct 1 – Dec 31 More info This data comes from the CMS Payroll-Based Journal report covering October 1 – December 31, 2025.
Certified Nursing Assistant140014036,80792100%7.3
Licensed Practical Nurse4704712,25392100%8.1
Registered Nurse260268,31592100%7.3
Clinical Nurse Specialist5052,4976874%8
Speech Language Pathologist0771,3828087%7.1
Dietitian37101,2858592%7.3
Physical Therapy Aide0661,1748693%7.4
Respiratory Therapy Technician0448888188%7.8
Dental Services Staff2028876773%7.9
Physical Therapy Assistant0558337986%7.1
Qualified Social Worker0337166773%6.4
Nurse Practitioner1014806065%8
Mental Health Service Worker1014806065%8
RN Director of Nursing1014786267%7.7
Administrator1014766065%7.9
Occupational Therapy Aide2353615257%6.3
Medical Director022111112%1
140 Certified Nursing Assistant
% of Days 100%
47 Licensed Practical Nurse
% of Days 100%
26 Registered Nurse
% of Days 100%
5 Clinical Nurse Specialist
% of Days 74%
7 Speech Language Pathologist
% of Days 87%
10 Dietitian
% of Days 92%
6 Physical Therapy Aide
% of Days 93%
4 Respiratory Therapy Technician
% of Days 88%
2 Dental Services Staff
% of Days 73%
5 Physical Therapy Assistant
% of Days 86%
3 Qualified Social Worker
% of Days 73%
1 Nurse Practitioner
% of Days 65%
1 Mental Health Service Worker
% of Days 65%
1 RN Director of Nursing
% of Days 67%
1 Administrator
% of Days 65%
5 Occupational Therapy Aide
% of Days 57%
2 Medical Director
% of Days 12%

Penalties and fines

Federal penalties imposed by CMS for regulatory violations, including civil money penalties (fines) and denials of payment for new Medicare/Medicaid admissions.

Source: CMS Penalties Database

No penalties in the past 3 years

No civil money penalties or payment denials were reported in the last 3 years.

Quality of care over time

These measures show how residents usually do over time at this home, based on health outcomes and preventive care.

High-risk clinical events score Info A composite score based on pressure ulcers, falls with injury, weight loss, walking ability decline, and activities of daily living decline. 6.6
12% better than Florida average

Florida average: 7.4

Functional decline score Info A composite score based on activities of daily living decline, walking ability decline, and incontinence. 8.3
33% better than Florida average

Florida average: 12.4

Long-stay resident measures
Significantly above average Florida avg: 4.5 Info CMS star rating based on long-stay quality measure performance. 5 stars = significantly above average, 1 star = significantly below average.
Need for Help with Daily Activities Increased Info Percent of long-stay residents whose need for help with daily activities has increased 5.2%
50% better than Florida average

Florida average: 10.5%

Walking Ability Worsened Info Percent of long-stay residents whose ability to move independently worsened 14.7%
13% worse than Florida average

Florida average: 12.9%

Low Risk Residents with Bowel/Bladder Incontinence Info Percent of low risk long-stay residents who lose control of their bowels or bladder 5.1%
63% better than Florida average

Florida average: 13.5%

Falls with Major Injury Info Percent of long-stay residents experiencing one or more falls with major injury 3.1%
17% worse than Florida average

Florida average: 2.6%

High Risk Residents with Pressure Ulcers Info Percent of long-stay high risk residents with pressure ulcers 3.6%
32% better than Florida average

Florida average: 5.4%

Urinary Tract Infection Info Percent of long-stay residents with a urinary tract infection 0.2%
78% better than Florida average

Florida average: 0.9%

Lost Too Much Weight Info Percent of long-stay residents who lose too much weight 6.2%
In line with Florida average

Florida average: 6.0%

Depressive Symptoms Info Percent of long-stay residents who have depressive symptoms 0.8%
75% better than Florida average

Florida average: 3.3%

Antipsychotic Use Info Percent of long-stay residents who received an antipsychotic medication 5.4%
32% better than Florida average

Florida average: 8.0%

Pneumococcal Vaccine Info Percent of long-stay residents assessed and appropriately given the pneumococcal vaccine 99.8%
In line with Florida average

Florida average: 97.7%

Influenza Vaccine Info Percent of long-stay residents assessed and appropriately given the seasonal influenza vaccine 100.0%
In line with Florida average

Florida average: 99.2%

Hospitalizations per 1,000 days Info Number of hospitalizations per 1,000 long-stay resident days. 2.85
36% worse than Florida average

Florida average: 2.10

ED visits per 1,000 days Info Number of outpatient emergency department visits per 1,000 long-stay resident days. 0.89
25% better than Florida average

Florida average: 1.18

Short-stay resident measures
Significantly above average Florida avg: 3.1 Info CMS star rating based on short-stay quality measure performance. 5 stars = much above average, 1 star = much below average.
Pneumococcal Vaccine Info Percent of short-stay residents assessed and appropriately given the pneumococcal vaccine 98.2%
5% better than Florida average

Florida average: 94.0%

Antipsychotic medication increase Info Percent of short-stay residents who newly received an antipsychotic medication 0.5%
69% better than Florida average

Florida average: 1.5%

Influenza Vaccine Info Percent of short-stay residents assessed and appropriately given the seasonal influenza vaccine 96.5%
In line with Florida average

Florida average: 94.7%

Re-hospitalized after SNF stay Info Percentage of short-stay residents who were re-hospitalized after their nursing home admission. 29.6%
13% worse than Florida average

Florida average: 26.2%

Emergency department visits Info Percentage of short-stay residents who had an outpatient emergency department visit. 5.7%
39% better than Florida average

Florida average: 9.3%

Falls with major injury Info Percentage of SNF residents who experience falls with major injury during their stay. 1.3%
65% worse than Florida average

Florida average: 0.8%

Ability to care for self at discharge Info Percentage of residents at or above expected ability to care for themselves at discharge. 61.1%
14% better than Florida average

Florida average: 53.7%

Successful return to home or community Info Rate of successful return to home or community from a skilled nursing facility. 56.0%
11% better than Florida average

Florida average: 50.6%

Breakdown by payment type

Medicare

58% of new residents, usually for short-term rehab.

Typical stay 23 days

Private pay

13% of new residents, often for short stays.

Typical stay 4 - 5 months

Medicaid

29% of new residents, often for long-term daily care.

Typical stay 4 - 5 months

Facility Characteristics

Source: CMS Long-Term Care Facility Characteristics (Data as of Jan 2026)

Total residents 172
Medicare
30
17.4% of residents
Medicaid
108
62.8% of residents
Private pay or other
34
19.8% of residents
Programs & Services
Residents Group

Residents meet regularly to discuss policies, care quality, and activities

Family Member Group

Family members meet regularly to discuss policies, care quality, and activities

Active Family Council

Organized group of family members that meets regularly to discuss facility policies, resident care, and activities.

Active Resident Council

Organized group of residents that meets regularly to discuss facility policies, quality of life, and activities.

Finances and operations

Privately-owned community
Operated by a partnership between two or more business owners.
Home revenue
$29.3M
Profit
$933.7K
Privately-owned community Operated by a partnership between two or more business owners.
Home revenue
$29.3M Rank #46 / 256Revenue — State benchmarkedThis home is ranked 46th out of 256 homes in Florida for revenue. Shows this facility's annual revenue compared to the Florida SNF average. Higher revenue generally means more resources for staffing and capital — read alongside Payroll %.Click the rank badge to see the full State ranking.Click here to see the full State ranking.
Profit
$933.7K
Payroll costs Info The portion of the home's budget spent on staff, including nurses, caregivers, and other employees who support care and operations. Rank #50 / 256Payroll — State benchmarkedThis home is ranked 50th out of 256 homes in Florida for payroll. Shows total annual staff payroll benchmarked to the Florida average. Higher payroll investment relative to peers often signals better staffing and less reliance on cheaper contract labor.Click the rank badge to see the full State ranking.Click here to see the full State ranking.
$11.8M
40.1% of revenue Rank #165 / 256Payroll % — State benchmarkedThis home is ranked 165th out of 256 homes in Florida for payroll %. Shows payroll as a percentage of revenue versus the Florida average. Well-run Florida SNFs typically land around 49–56% — the top third Statewide. Below 25% may signal understaffing or heavy agency use — read with Staffing ratings.Click the rank badge to see the full State ranking.Click here to see the full State ranking.
Other operating costs Info All remaining costs needed to run the home, such as food, utilities, building maintenance, supplies and administrative expenses.
$16.6M
Total costs $28.4M

What does this home offer?

Housing options icon

Housing Options: Private / Semi-Private Rooms

Building type icon
Building type icon

Building Type: Single-story

Beauty services icon

Beauty Services

Transportation services icon

Transportation Services

Housekeeping icon
Housekeeping icon

Housekeeping Services

Recreational activities icon

Recreational Activities

Exercise program icon

Exercise Programs

Who this home usually serves

TYPE OF STAY

Mostly short-term rehab stays

Most residents typically stay for a few weeks or months before returning home or moving on.

Places of interest near Tampa Lakes Health And Rehabilitation Center

Address 4.1 miles from city center Info Estimated distance in miles from Lutz's city center to Tampa Lakes Health And Rehabilitation Center's address, calculated via Google Maps.

Calculate Travel Distance to Tampa Lakes Health And Rehabilitation Center

Add your location

Address

Financial Assistance for
Nursing Home in Florida

Tampa Lakes Health And Rehabilitation Center is located in Lutz, Florida.
Here are the financial assistance programs available to residents in Florida.

Get Financial aid guidance

Long-Term Care Waiver

Florida Medicaid LTC Waiver

Age 65+ or 21+ disabled
General Florida resident, Medicaid- eligible, nursing home-level care need.
Income Limits (2025) ~$2,829/month 300% FBR, individual
Asset Limits $2,000 (individual), $3,000 (couple).
FL

High demand; waitlists common.

Benefits
In-home care (6-8 hours/day) Assisted living Respite (240 hours/year) Case management

Community Care for the Elderly (CCE)

Florida CCE

Age 60+
General Florida resident, at risk of nursing home.
Income Limits ~$2,000/month varies
Asset Limits $5,000 individual
FL

Limited funding; regional variation.

Benefits
Homemaker services (3-5 hours/week) Adult day care (~$60/day) Respite (up to 10 days/year)

Home Care for the Elderly (HCE)

Florida Home Care for the Elderly

Age 60+
General Florida resident, at risk of nursing home placement; caregiver must be approved.
Income Limits (2025) ~$2,829/month individual, aligned with Medicaid thresholds
Asset Limits ~$2,000 (individual); varies by case manager discretion.
FL

Limited funding (~3,500 served annually); prioritizes low-income frail seniors.

Benefits
Basic subsidy (~$160/month) for housing/medical costs; special subsidies for supplies/services (e.g., incontinence supplies, ~$50-$200/month)

Program of All-Inclusive Care for the Elderly (PACE)

Florida Medicaid PACE

Age 55+
General Florida resident, nursing home-level care need, safe with PACE support.
Income Limits (2025) ~$2,829/month 300% FBR
Asset Limits $2,000 (individual), $3,000 (couple).
FL

Limited to specific counties (e.g., Hillsborough, Miami-Dade); ~10 sites statewide.

Benefits
Personal care (5-7 hours/day) Medical care Meals Transportation Therapy

Optional State Supplementation (OSS)

Florida Optional State Supplementation

Age 65+ or disabled
General Florida resident, living in approved facility, receiving SSI or low-income.
Income Limits (2025) ~$1,004/month individual, including SSI
Asset Limits $2,000 (individual), $3,000 (couple).
FL

Limited to specific facility types; ~$78.40/month max supplement.

Benefits
Cash payment (~$78.40/month) for room/board or personal needs in facilities

Compare Nursing Home around Hillsborough County

The information below is reported by the Florida Agency for Health Care Administration (AHCA).

4 facilities compared · CMS & FL Dept. of Health data

Filter by care type
Tampa Lakes Health And Rehabilitation Center
NH

Nursing Home Licensed facility providing 24/7 skilled nursing care for residents with complex, ongoing medical needs. Staffed by RNs, LPNs, and CNAs. Inspected and star-rated annually by CMS. Accepts Medicare (short-term rehab) and Medicaid (long-term care).

Lutz (North Tampa)
179
Facility 179
FL AVG 90
Rank #82 / 1073
37.4% -56%3.50 -19%-13%$0162.7-67A+
19
Facility 19
FL AVG 40
Rank #1108 / 1485
-$29.3M$11.8M40.1%106112
Fairway Oaks Center
NH

Nursing Home Licensed facility providing 24/7 skilled nursing care for residents with complex, ongoing medical needs. Staffed by RNs, LPNs, and CNAs. Inspected and star-rated annually by CMS. Accepts Medicare (short-term rehab) and Medicaid (long-term care).

Tampa
120
Facility 120
FL AVG 90
Rank #262 / 1073
93.5% +11%3.28 -23%-19%$0268.7-108B-
32
Facility 32
FL AVG 40
Rank #887 / 1485
Dawn Debrunner$13.3M$7.2M54.1%105305
Woodbridge Care Center
NH

Nursing Home Licensed facility providing 24/7 skilled nursing care for residents with complex, ongoing medical needs. Staffed by RNs, LPNs, and CNAs. Inspected and star-rated annually by CMS. Accepts Medicare (short-term rehab) and Medicaid (long-term care).

Tampa (Town N County Park)
120
Facility 120
FL AVG 90
Rank #262 / 1073
100.0% +19%3.37 +43%-17%$4.9k217.0-112-
72
Facility 72
FL AVG 40
Rank #185 / 1485
Woodbridge Nursing Holdco LLC$11.9M$2.8M23.5%105426
The Bristol at Tampa Rehabilitation & Nursing Center -
NH

Nursing Home Licensed facility providing 24/7 skilled nursing care for residents with complex, ongoing medical needs. Staffed by RNs, LPNs, and CNAs. Inspected and star-rated annually by CMS. Accepts Medicare (short-term rehab) and Medicaid (long-term care).

Tampa (Cross Fletcher)
266
Facility 266
FL AVG 90
Rank #10 / 1073
--3.91----28%-3%$173.4k549.06229-
75
Facility 75
FL AVG 40
Rank #150 / 1485
Bristol Holdco LLC$24.4M$13.8M56.3%105140

Frequently Asked Questions about Tampa Lakes Health And Rehabilitation Center

What neighborhood is Tampa Lakes Health And Rehabilitation Center in?

Tampa Lakes Health And Rehabilitation Center is in the North Tampa neighborhood of Lutz.

Is Tampa Lakes Health And Rehabilitation Center in a walkable area?

Tampa Lakes Health And Rehabilitation Center has a walk score of 19. Car-dependent. Most errands require a car, with limited nearby walkable options.

Are there photos of Tampa Lakes Health And Rehabilitation Center?

Yes — there are 5 photos of Tampa Lakes Health And Rehabilitation Center in the photo gallery on this page.

What is the address of Tampa Lakes Health And Rehabilitation Center?

Tampa Lakes Health And Rehabilitation Center is located at 750 Hayes Rd, Lutz, FL 33549.

What is the phone number of Tampa Lakes Health And Rehabilitation Center?

(813) 559-1500 will put you in contact with the team at Tampa Lakes Health And Rehabilitation Center.

Is Tampa Lakes Health And Rehabilitation Center Medicare or Medicaid certified?

Yes — Tampa Lakes Health And Rehabilitation Center is a CMS-certified provider of Medicare and Medicaid.

Guides for Better Senior Living

Care Cost Calculator: See Prices in Your Area

Nursing Home Data Explorer

Don’t Wait Too Long: 7 Red Flag Signs Your Parent Needs Assisted Living Now

The True Cost of Assisted Living in 2025 – And How Families Are Paying For It

Understanding Senior Living Costs: Pricing Models, Discounts & Financial Assistance

Explore Open Rooms
1 Contact details
2 What type of senior care service are you looking for?
3 What budget do you have in mind for senior care?
4 How soon do you need to find care?
5 Additional details

Thank you for your interest!

Our team will be in touch shortly to help with next steps.